You are not logged in.
This means you
CAN ONLY VIEW reports that were published prior to Tuesday, February 20, 2024.
You
MUST UPGRADE YOUR MEMBERSHIP if you want to see any current reports.
AFTER MARKET UPDATE - FRIDAY, SEPTEMBER 6TH, 2019
Previous After Market Report Next After Market Report >>>
|
|
|
|
DOW |
+69.31 |
26,797.46 |
+0.26% |
|
Volume |
735,109,900 |
-16% |
|
Volume |
1,859,252,634 |
-10% |
|
NASDAQ |
-13.76 |
8,103.07 |
-0.17% |
|
Advancers |
1,614 |
57% |
|
Advancers |
1,423 |
47% |
|
S&P 500 |
+2.71 |
2,978.71 |
+0.09% |
|
Decliners |
1,213 |
43% |
|
Decliners |
1,626 |
53% |
|
Russell 2000 |
-5.60 |
1,505.15 |
-0.37% |
|
52 Wk Highs |
138 |
|
|
52 Wk Highs |
80 |
|
|
S&P 600 |
-2.29 |
930.11 |
-0.25% |
|
52 Wk Lows |
20 |
|
|
52 Wk Lows |
45 |
|
|
 |
Healthy Leadership Remains in Present Market Rally
Kenneth J. Gruneisen - Passed the CAN SLIM® Master's Exam
For the week, the S&P rallied 1.8%, while the Dow and Nasdaq Composite advanced 1.5% and 1.8%, respectively. On Friday the Dow climbed 69 points, while the S&P 500 rose 0.1%. The Nasdaq Composite declined 0.2%. Volume totals reported were lighter than the prior session totals on the NYSE and on the Nasdaq exchange. Breadth was positive as advancers led decliners by a 4-3 margin on the NYSE, however, decliners led advancers by 8-7 on the Nasdaq exchange. Healthy leadership was reassuring as 77 high-ranked companies from the Leaders List hit new 52-week highs and were listed on the BreakOuts Page, versus the total of 74 on the prior session. New 52-week highs totals contracted but still outnumbered new 52-week lows totals on the NYSE and on the Nasdaq exchange. Concerning the M criteria of the fact-based investment system, investors have a green light to make carefully selected new buying efforts. The Featured Stocks Page provides the most timely analysis on high-ranked leaders. Charts used courtesy of www.stockcharts.com
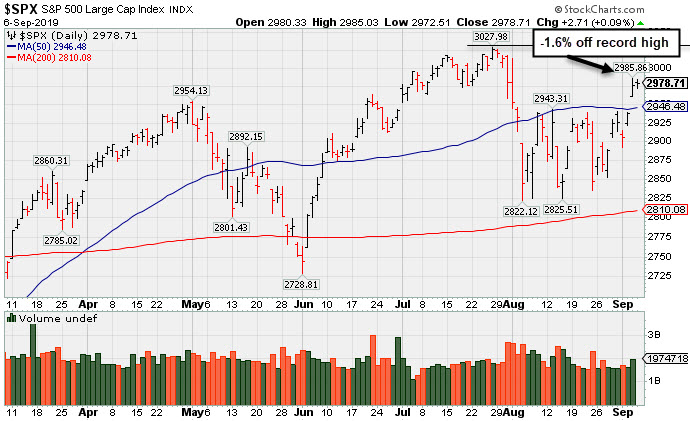
PICTURED: The S&P 500 Index is perched -1.6% off its record high hit on 7/26/19. It rebounded above its 50-day moving average (DMA) line with Thursday's gain helping its technical stance.
Stocks finished mixed Friday as investors digested economic data and central bank updates. The moves capped a second consecutive weekly gain for the major averages, as news of high level trade discussions in October helped lift investor sentiment.
On the data front, the Labor Department’s non-farm payrolls report showed 130,000 jobs were added to the U.S. economy in August, below expectations and lower than the prior month’s downwardly revised 159,000 figure. However, the unemployment rate remained steady at 3.7%.
Further, the labor participation rate rose and wage inflation increased more than expected.
In central bank news, Federal Reserve Chair Jerome Powell’s speech in Zurich garnered attention ahead of next week’s “quiet period” that precedes the September 17-18 policy meeting. Powell repeated policymakers’ intention to “act as appropriate” to sustain the current economic expansion, though he reiterated the ongoing monitoring of “significant risks.” He also noted that the Fed does not foresee a recession at this time. Treasuries were little changed, with the yield on the 10-year note down one basis point to 1.55%. In commodities, WTI crude was up 0.4% to $56.52/barrel, while COMEX gold shed 0.8% to $1,507.00/ounce.
In earnings, Lululemon (LULU +7.82%) managed a "breakaway gap" after the easily topping analyst profit and sales expectations and raising its full-year guidance. Costco (COST +2.29%) also hit a new high after releasing stronger-than-expected comparable-store sales in August, citing solid e-commerce growth.
|
 Kenneth J. Gruneisen started out as a licensed stockbroker in August 1987, a couple of months prior to the historic stock market crash that took the Dow Jones Industrial Average down -22.6% in a single day. He has published daily fact-based fundamental and technical analysis on high-ranked stocks online for two decades. Through FACTBASEDINVESTING.COM, Kenneth provides educational articles, news, market commentary, and other information regarding proven investment systems that work in good times and bad.
Comments contained in the body of this report are technical opinions only and are not necessarily those of Gruneisen Growth Corp. The material herein has been obtained from sources believed to be reliable and accurate, however, its accuracy and completeness cannot be guaranteed. Our firm, employees, and customers may effect transactions, including transactions contrary to any recommendation herein, or have positions in the securities mentioned herein or options with respect thereto. Any recommendation contained in this report may not be suitable for all investors and it is not to be deemed an offer or solicitation on our part with respect to the purchase or sale of any securities. |
|
 |
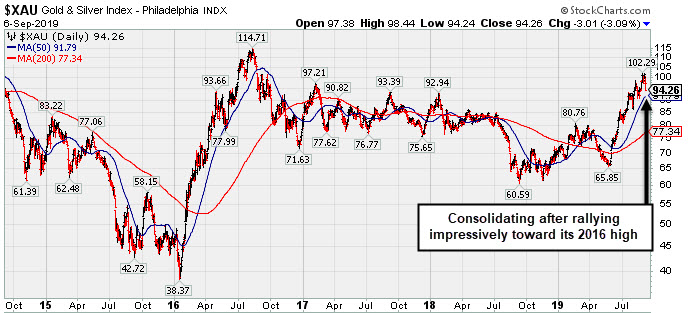
Gold & Silver Index Consolidates After Impressive Rally
Kenneth J. Gruneisen - Passed the CAN SLIM® Master's Exam
The Bank Index ($BKX -0.31%) edged lower and the Broker/Dealer Index ($XBD +0.38%) posted a small gain while the Retail Index ($RLX +0.10%) finished nearly flat. The tech sector was mixed as the Networking Index ($NWX +0.66%) rose and the Semiconductor Index ($SOX +0.14%) inched higher, but the Biotech Index ($BTK -0.77%) lost ground. Commodity-linked groups were mixed as the Integrated Oil Index ($XOI +0.23%) and the Oil Services Index ($OSX +0.44%) rose, meanwhile, the Gold & Silver Index ($XAU -3.09%) was a standout decliner for the second consecutive session.
PICTURED: The 5-year graph of the Gold & Silver Index ($XAU -3.09%) shows it consolidating after rallying impressively for the past 3 months toward its 2016 high.
| Oil Services |
$OSX |
66.58 |
+0.29 |
+0.44% |
-17.39% |
| Integrated Oil |
$XOI |
1,191.27 |
+2.90 |
+0.24% |
+2.78% |
| Semiconductor |
$SOX |
1,568.34 |
+2.13 |
+0.14% |
+35.77% |
| Networking |
$NWX |
561.30 |
+3.66 |
+0.66% |
+14.86% |
| Broker/Dealer |
$XBD |
264.09 |
+0.99 |
+0.38% |
+11.27% |
| Retail |
$RLX |
2,408.22 |
+2.48 |
+0.10% |
+23.41% |
| Gold & Silver |
$XAU |
94.26 |
-3.01 |
-3.09% |
+33.40% |
| Bank |
$BKX |
94.60 |
-0.30 |
-0.32% |
+10.27% |
| Biotech |
$BTK |
4,271.42 |
-33.36 |
-0.77% |
+1.20% |
|
|
|
 |
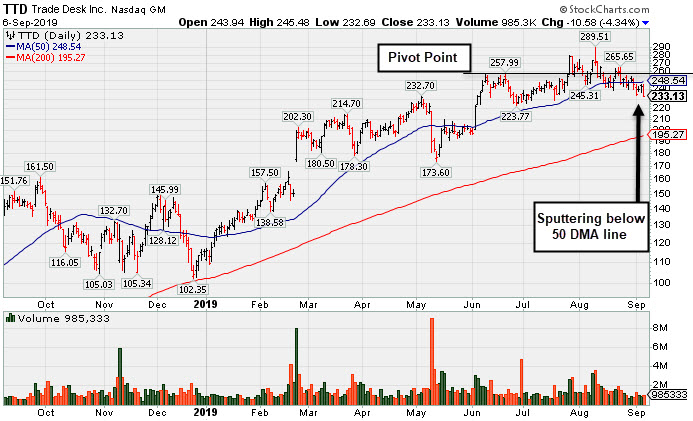
Negated Breakout and Slumped Below Noted Support
Kenneth J. Gruneisen - Passed the CAN SLIM® Master's Exam
The Trade Desk Inc Cl A (TTD $233.13 -$10.58 -4.34%) has recently been sputtering below its 50-day moving average (DMA) line ($248.54) and below the recent low ($239.01 on 8/21/19) raising concerns and triggering technical sell signals. It completely negated the prior breakout above its pivot point as it fell back into the prior base. Only a prompt rebound above the 50 DMA line would help its outlook improve. Prior lows in the $223-228 area now define important near-term support above its 200 DMA line ($195).
Fundamentals remain strong after it recently it reported Jun '19 quarterly earnings +58% on +42% sales revenues. Seven of the past 8 quarterly comparisons were well above the +25% minimum guideline (C criteria). Its annual earnings (A criteria) history has been strong, and it has a highest possible 99 Earnings Per Share Rating.
The high-ranked Comml Svcs-Advertising firm was last shown in this FSU section on 8/16/19 with an annotated graph under the headline, "Consolidating Near 50-Day Moving Average Line". The number of top-rated funds owning its shares rose from 280 in Mar '18 to 560 in Jun '19, a reassuring sign concerning the I criteria. Its current Up/Down Volume Ratio of 1.0 is an unbiased indication its shares have been neutral concerning accumulation/distribution over the past 50 days. It has a Timeliness Rating of B and a Sponsorship Rating of B. There are only 45.0 million shares outstanding (S criteria) which can contribute to greater volatility in the event of institutional buying or selling.
Charts courtesy of www.stockcharts.com
 |
|
|
Color Codes Explained :
Y - Better candidates highlighted by our
staff of experts.
G - Previously featured
in past reports as yellow but may no longer be buyable under the
guidelines.
***Last / Change / Volume data in this table is the closing quote data***
Symbol/Exchange
Company Name
Industry Group |
PRICE |
CHANGE
(%Change) |
Day High |
Volume
(% DAV)
(% 50 day avg vol) |
52 Wk Hi
% From Hi |
Featured
Date |
Price
Featured |
Pivot Featured |
|
Max Buy |
 EPAM
-
NYSE
EPAM
-
NYSE
Epam Systems Inc
COMPUTER SOFTWARE and SERVICES - Information Technology Service
|
$192.89
|
-1.93
-0.99% |
$196.81
|
226,256
56.85% of 50 DAV
50 DAV is 398,000
|
$201.00
-4.03%
|
5/9/2019
|
$169.25
|
PP = $180.55
|
|
MB = $189.58
|
Most Recent Note - 9/4/2019 1:14:32 PM
G - Faces some resistance due to overhead supply up to the $201 level. Quietly consolidating near its 50 DMA line ($188.31) which defines support above the recent low ($175.33 on 8/07/19). Reported earnings +27% on +24% sales revenues for the Jun '19 quarter. See the latest FSU analysis for more details and an annotated graph.
>>> FEATURED STOCK ARTICLE : Volume Light During Brief Consolidation Above 50-Day Average - 8/29/2019 |
View all notes |
Set NEW NOTE alert |
Company Profile |
SEC
News |
Chart |
Request a new note
C
A
S
I |
AUDC
-
NASDAQ
Audiocodes Ltd
ELECTRONICS - Scientific and Technical Instrum
|
$17.46
|
+0.03
0.17% |
$17.80
|
64,484
37.06% of 50 DAV
50 DAV is 174,000
|
$19.74
-11.55%
|
7/15/2019
|
$17.10
|
PP = $17.54
|
|
MB = $18.42
|
Most Recent Note - 9/5/2019 12:54:41 PM
Y - Consolidating near important support defined by its 50 DMA line ($17.27) and recent low ($16.51 on 8/14/19). More damaging losses would raise concerns and trigger technical sell signals. Reported earnings +57% on +14% sales revenues for the Jun '19 quarter, continuing its strong earnings track record.
>>> FEATURED STOCK ARTICLE : Volume Cooling While Consolidating Above Support Levels - 8/30/2019 |
View all notes |
Set NEW NOTE alert |
Company Profile |
SEC
News |
Chart |
Request a new note
C
A
S
I |
LHCG
-
NASDAQ
L H C Group Inc
HEALTH SERVICES - Home Health Care
|
$122.39
|
+2.22
1.85% |
$123.45
|
177,653
80.75% of 50 DAV
50 DAV is 220,000
|
$129.37
-5.40%
|
7/1/2019
|
$110.94
|
PP = $122.20
|
|
MB = $128.31
|
Most Recent Note - 9/5/2019 12:59:30 PM
G - Still quietly sputtering just below its 50 DMA line ($121.30) which has acted as resistance. A breach of the prior low ($116.67 on 8/13/19) would raise more serious concerns and trigger a worrisome technical sell signal.
>>> FEATURED STOCK ARTICLE : Sputtering Below 50-Day Average and Below Pivot Point - 8/20/2019 |
View all notes |
Set NEW NOTE alert |
Company Profile |
SEC
News |
Chart |
Request a new note
C
A
S
I |
CHDN
-
NASDAQ
Churchill Downs Inc
LEISURE - Gaming Activities
|
$125.00
|
+0.98
0.79% |
$125.70
|
217,542
95.83% of 50 DAV
50 DAV is 227,000
|
$132.73
-5.82%
|
7/22/2019
|
$118.45
|
PP = $118.89
|
|
MB = $124.83
|
Most Recent Note - 9/4/2019 5:37:23 PM
Y - Its 50 DMA line ($119) and prior low ($113.88 on 8/05/19) define important near-term support to watch. Jun '19 earnings +10% on +26% sales revenues versus the year ago period were below the +25% minimum earnings guideline (C criteria), noted recently raising fundamental concerns. See the latest FSU analysis for more details and a new annotated graph.
>>> FEATURED STOCK ARTICLE : Found Support After Making Limited Progress - 9/4/2019 |
View all notes |
Set NEW NOTE alert |
Company Profile |
SEC
News |
Chart |
Request a new note
C
A
S
I |
LULU
-
NASDAQ
Lululemon Athletica
MANUFACTURING - Textile Manufacturing
|
$203.14
|
+14.73
7.82% |
$204.44
|
10,916,488
710.25% of 50 DAV
50 DAV is 1,537,000
|
$194.25
4.58%
|
9/6/2019
|
$201.25
|
PP = $194.35
|
|
MB = $204.07
|
 Most Recent Note - 9/6/2019 5:10:45 PM
Y - Finished strong after highlighted in yellow in the earlier mid-day report with new pivot point cited based on its 7/31/19 high plus 10 cents. Gapped up today triggering a technical buy signal after reporting earnings +35% on +22% sales revenues for the Jul '19 quarter, continuing its strong earnings track record. Members were reminded that volume and volatility often increase near earnings news as it rebounded above its 50 DMA line ($184) with 2 consecutive gains with above average volume.
>>> FEATURED STOCK ARTICLE : Sank Below 50-Day Average Toward Prior Lows With High Volume - 9/3/2019 |
View all notes |
Set NEW NOTE alert |
Company Profile |
SEC
News |
Chart |
Request a new note
C
A
S
I |
Symbol/Exchange
Company Name
Industry Group |
PRICE |
CHANGE
(%Change) |
Day High |
Volume
(% DAV)
(% 50 day avg vol) |
52 Wk Hi
% From Hi |
Featured
Date |
Price
Featured |
Pivot Featured |
|
Max Buy |
CPRT
-
NASDAQ
Copart Inc
SPECIALTY RETAIL - Auto Dealerships
|
$81.38
|
+0.77
0.96% |
$82.32
|
2,062,559
172.89% of 50 DAV
50 DAV is 1,193,000
|
$79.74
2.06%
|
9/5/2019
|
$79.13
|
PP = $79.84
|
|
MB = $83.83
|
Most Recent Note - 9/6/2019 12:04:21 PM
Y - Hit a new high today. Finished strong on the prior session after highlighted in yellow with pivot point cited based on its 7/26/19 high plus 10 cents. The big volume-driven gain above the pivot point clinched a technical buy signal. Reported earnings +43% on +21% sales revenues for the Jul '19 quarter. Three of the past 4 quarterly earnings increases were above the +25% minimum guideline (C criteria) and its sales revenues growth rate has accelerated. Annual earnings (A criteria) history has been strong and steady since a downturn in FY '13. See the latest FSU analysis for more details and an annotated graph.
>>> FEATURED STOCK ARTICLE : Heavy Volume Behind Breakout Gain After Earnings Report - 9/5/2019 |
View all notes |
Set NEW NOTE alert |
Company Profile |
SEC
News |
Chart |
Request a new note
C
A
S
I |
VEEV
-
NYSE
Veeva Systems Inc Cl A
Computer Sftwr-Medical
|
$157.33
|
-2.09
-1.31% |
$161.29
|
1,128,141
82.41% of 50 DAV
50 DAV is 1,369,000
|
$176.90
-11.06%
|
5/30/2019
|
$154.32
|
PP = $145.80
|
|
MB = $153.09
|
Most Recent Note - 9/5/2019 1:04:02 PM
G - Still sputtering below its 50 DMA line ($164.30). A convincing rebound is needed for its outlook to improve. The 50 DMA line has acted as resistance. Reported earnings +41% on +27% for the Jul '19 quarter continuing its strong earnings track record.
>>> FEATURED STOCK ARTICLE : Met Resistance After Slumping Below 50-Day Moving Average - 8/23/2019 |
View all notes |
Set NEW NOTE alert |
Company Profile |
SEC
News |
Chart |
Request a new note
C
A
S
I |
PAYC
-
NYSE
Paycom Software Inc
COMPUTER SOFTWARE and SERVICES - Application Software
|
$249.62
|
-3.07
-1.21% |
$254.53
|
441,204
75.81% of 50 DAV
50 DAV is 582,000
|
$259.71
-3.89%
|
8/20/2019
|
$246.97
|
PP = $246.95
|
|
MB = $259.30
|
Most Recent Note - 9/5/2019 12:57:56 PM
Y - Volume totals still have been cooling while hovering near its all-time high. Color code was changed to yellow with new pivot point cited based on its 7/11/19 high plus 10 cents. Recent gains above the pivot point did not have the +40% above average volume necessary to trigger a proper new (or add-on) technical buy signal. Its 50 DMA line ($239) defines support above the recent low ($216.55 on 8/05/19). Fundamentals remain strong.
>>> FEATURED STOCK ARTICLE : Recently Wedged Higher Without Great Volume Conviction - 8/26/2019 |
View all notes |
Set NEW NOTE alert |
Company Profile |
SEC
News |
Chart |
Request a new note
C
A
S
I |
BLD
-
NYSE
Topbuild Corp
Bldg-Constr Prds/Misc
|
$91.59
|
+0.17
0.19% |
$92.57
|
131,616
46.18% of 50 DAV
50 DAV is 285,000
|
$93.59
-2.14%
|
5/17/2019
|
$82.19
|
PP = $87.31
|
|
MB = $91.68
|
Most Recent Note - 9/4/2019 5:39:38 PM
G - Posted a gain today on light volume and it is perched within close striking distance of its all-time high. Earnings rose +39% on +9% sales revenues for the Jun '19 quarter versus the year ago period. Prior highs in the $86 area define initial support to watch above its 50 DMA line ($85.54) on pullbacks.
>>> FEATURED STOCK ARTICLE : Topbuild Has 4 Consecutive Weekly Gains and Stubbornly Held Ground - 8/19/2019 |
View all notes |
Set NEW NOTE alert |
Company Profile |
SEC
News |
Chart |
Request a new note
C
A
S
I |
TEAM
-
NASDAQ
Atlassian Corp Plc Cl A
Comp Sftwr-Spec Enterprs
|
$132.21
|
-1.13
-0.85% |
$137.59
|
2,471,258
192.77% of 50 DAV
50 DAV is 1,282,000
|
$149.80
-11.74%
|
8/27/2019
|
$142.62
|
PP = $149.90
|
|
MB = $157.40
|
Most Recent Note - 9/6/2019 12:25:28 PM
G - A rebound above the 50 DMA line ($138.35) is needed for its outlook to improve. Halted its slide on the prior session after undercutting the prior low ($130.78 on 7/23/19) this week triggering a worrisome technical sell signal. Fundamentals remain strong.
>>> FEATURED STOCK ARTICLE : Consolidating Near High After Recently Finding Support - 8/21/2019 |
View all notes |
Set NEW NOTE alert |
Company Profile |
SEC
News |
Chart |
Request a new note
C
A
S
I |
Symbol/Exchange
Company Name
Industry Group |
PRICE |
CHANGE
(%Change) |
Day High |
Volume
(% DAV)
(% 50 day avg vol) |
52 Wk Hi
% From Hi |
Featured
Date |
Price
Featured |
Pivot Featured |
|
Max Buy |
TTD
-
NASDAQ
The Trade Desk Inc Cl A
Comml Svcs-Advertising
|
$233.13
|
-10.58
-4.34% |
$245.48
|
984,123
69.06% of 50 DAV
50 DAV is 1,425,000
|
$289.51
-19.47%
|
7/18/2019
|
$240.61
|
PP = $258.10
|
|
MB = $271.01
|
Most Recent Note - 9/6/2019 5:12:18 PM
G - Slumped further below its 50 DMA line ($248) and below the recent low ($239.01 on 8/21/19) with losses this week raising concerns and triggering technical sell signals. Only a prompt rebound above the 50 DMA line would help its outlook improve. Reported Jun '19 quarterly earnings +58% on +42% sales revenues. See the latest FSU analysis for more details and a new annotated graph.
>>> FEATURED STOCK ARTICLE : Negated Breakout and Slumped Below Noted Support - 9/6/2019 |
View all notes |
Set NEW NOTE alert |
Company Profile |
SEC
News |
Chart |
Request a new note
C
A
S
I |
PAGS
-
NYSE
Pagseguro Digital Cl A
Finance-CrdtCard/PmtPr
|
$51.67
|
-1.21
-2.29% |
$53.22
|
925,268
43.16% of 50 DAV
50 DAV is 2,144,000
|
$53.43
-3.29%
|
6/25/2019
|
$37.69
|
PP = $40.07
|
|
MB = $42.07
|
Most Recent Note - 9/4/2019 12:51:17 PM
G - Perched within striking distance of its all-time high with today's gain on light volume. Volume totals have been cooling while stubbornly holding its ground near its all-time high. Its 50 DMA line ($45.52) and the recent low ($42.00 on 8/05/19) define important levels to watch on pullbacks. Reported earnings +35% on +39% sales revenues for the quarter ended June 30,2019 versus the year ago period.
>>> FEATURED STOCK ARTICLE : Brazil-Based Digital Payments Firm Perched at All-Time High - 8/22/2019 |
View all notes |
Set NEW NOTE alert |
Company Profile |
SEC
News |
Chart |
Request a new note
C
A
S
I |
|
|
|
THESE ARE NOT BUY RECOMMENDATIONS!
Comments contained in the body of this report are technical
opinions only. The material herein has been obtained
from sources believed to be reliable and accurate, however,
its accuracy and completeness cannot be guaranteed.
This site is not an investment advisor, hence it does
not endorse or recommend any securities or other investments.
Any recommendation contained in this report may not
be suitable for all investors and it is not to be deemed
an offer or solicitation on our part with respect to
the purchase or sale of any securities. All trademarks,
service marks and trade names appearing in this report
are the property of their respective owners, and are
likewise used for identification purposes only.
This report is a service available
only to active Paid Premium Members.
You may opt-out of receiving report notifications
at any time. Questions or comments may be submitted
by writing to Premium Membership Services 665 S.E. 10 Street, Suite 201 Deerfield Beach, FL 33441-5634 or by calling 1-800-965-8307
or 954-785-1121.
|
|
|