You are not logged in.
This means you
CAN ONLY VIEW reports that were published prior to Monday, February 19, 2024.
You
MUST UPGRADE YOUR MEMBERSHIP if you want to see any current reports.
AFTER MARKET UPDATE - WEDNESDAY, SEPTEMBER 4TH, 2019
Previous After Market Report Next After Market Report >>>
|
|
|
|
DOW |
+237.45 |
26,355.47 |
+0.91% |
|
Volume |
749,125,550 |
-12% |
|
Volume |
1,860,955,105 |
-3% |
|
NASDAQ |
+103.16 |
7,977.32 |
+1.31% |
|
Advancers |
2,319 |
80% |
|
Advancers |
2,074 |
68% |
|
S&P 500 |
+31.51 |
2,937.78 |
+1.08% |
|
Decliners |
563 |
20% |
|
Decliners |
987 |
32% |
|
Russell 2000 |
+12.47 |
1,484.76 |
+0.85% |
|
52 Wk Highs |
219 |
|
|
52 Wk Highs |
81 |
|
|
S&P 600 |
+8.50 |
914.47 |
+0.94% |
|
52 Wk Lows |
30 |
|
|
52 Wk Lows |
83 |
|
|
 |
Major Indices Rally With Lackluster Volume Totals
Kenneth J. Gruneisen - Passed the CAN SLIM® Master's Exam
The Dow climbed 237 points, while the S&P 500 gained 1.1%. The Nasdaq Composite jumped 1.3%. Volume totals reported were lighter than the prior session totals on the NYSE and on the Nasdaq exchange, revealing lackluster institutional buying demand. Breadth was positive as advancers led decliners by a 4-1 margin on the NYSE and by more than 2-1 on the Nasdaq exchange. Leadership improved as 53 high-ranked companies from the Leaders List hit new 52-week highs and were listed on the BreakOuts Page, nearly doubling the total of 27 on the prior session. New 52-week highs totals expanded and outnumbered new 52-week lows on the NYSE, but new lows still outnumbered new highs on the Nasdaq exchange. A follow-through day on 8/13/19 marked a bullish shift concerning the M criteria of the fact-based investment system, but the market faced immediate pressure. Investors have a green light to make carefully selected new buying efforts, however, subsequent losses below prior low for the Nasdaq Composite Index would technically kill the new rally. The Featured Stocks Page provides the most timely analysis on high-ranked leaders. Charts used courtesy of www.stockcharts.com
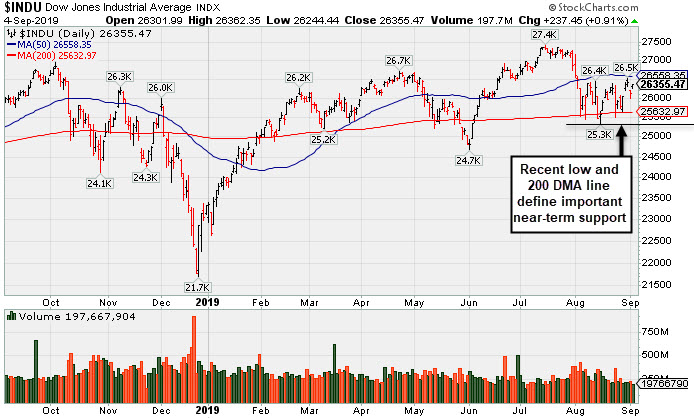
PICTURED: The Dow Jones Industrial Average remains below its 50-day moving average (DMA) line. The recent low defines important support along with its 200 DMA line. More damaging losses would raise concerns and prompt investors to reduce their exposure to stocks.
Stocks finished higher Wednesday as investors assessed easing political tensions around the world and central bank updates. Investor sentiment was boosted after Hong Kong’s controversial extradition bill was withdrawn. Over in Europe, a British parliamentary vote increased the chances of another Brexit delay, while two opposing political groups in Italy agreed to form a coalition government. The updates outweighed Tuesday’s release from the Institute for Supply Management, which showed the U.S. manufacturing sector contracted for the first time in three years.
On the data front Wednesday, an update showed the U.S. trade deficit narrowed in July, but the gap with China expanded to the widest in six months. In central bank news, New York Fed President John Williams reiterated that the Federal Reserve will “act as appropriate” to help the economic expansion. The release of the Fed’s Beige Book showed that the U.S. economy expanded at a modest pace despite trade uncertainties. Treasuries advanced, with the yield on the 10-year note dipping one basis point to 1.46%.
All 11 S&P 500 sectors finished in positive territory with Technology shares pacing the gains amid a rally in chipmakers. Energy stocks also outperformed as WTI crude spiked +4.5% to $56.38/barrel after a private report showed China’s services sector expanded at the fastest rate in three months. In earnings, Navistar International (NAV +13.36%) rose after the truck maker topped analyst profit and sales estimates. Tyson Foods (TSN -7.8%) slumped following a reduction in its full-year earnings guidance.
|
 Kenneth J. Gruneisen started out as a licensed stockbroker in August 1987, a couple of months prior to the historic stock market crash that took the Dow Jones Industrial Average down -22.6% in a single day. He has published daily fact-based fundamental and technical analysis on high-ranked stocks online for two decades. Through FACTBASEDINVESTING.COM, Kenneth provides educational articles, news, market commentary, and other information regarding proven investment systems that work in good times and bad.
Comments contained in the body of this report are technical opinions only and are not necessarily those of Gruneisen Growth Corp. The material herein has been obtained from sources believed to be reliable and accurate, however, its accuracy and completeness cannot be guaranteed. Our firm, employees, and customers may effect transactions, including transactions contrary to any recommendation herein, or have positions in the securities mentioned herein or options with respect thereto. Any recommendation contained in this report may not be suitable for all investors and it is not to be deemed an offer or solicitation on our part with respect to the purchase or sale of any securities. |
|
 |
Financial, Retail, Commodity, and Tech Groups Rose
Kenneth J. Gruneisen - Passed the CAN SLIM® Master's Exam
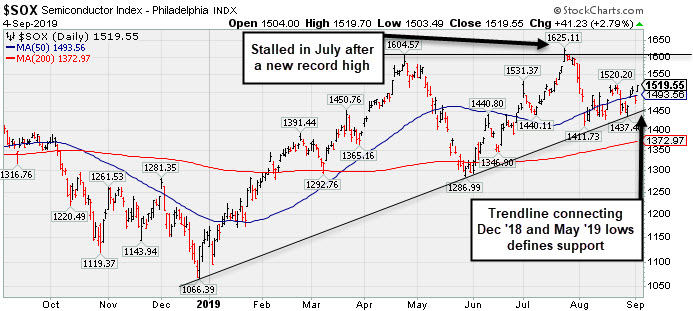
The Bank Index ($BKX +1.17%) and the Broker/Dealer Index ($XBD 1.03%) both posted solid gains while the Retail Index ($RLX +0.62%) posted a smaller gain. The tech sector had a positive bias as the Semiconductor Index ($SOX +2.79%) and Networking Index ($NWX +1.08%), but the Biotech Index ($BTK -0.34%) ended slightly in the red. Commodity-linked groups had a positive bias as the Integrated Oil Index ($XOI +1.33%) and the Oil Services Index ($OSX +2.73%) rose along with the Gold & Silver Index ($XAU +1.55%).
PICTURED: The Semiconductor Index ($SOX +2.79%) climbed back above its 50-day moving average (DMA) line. It stalled after rebounding and hitting a new record high in July. The upward trendline connecting its Dec '18 and May '19 lows defines an important support level watch above its 200 DMA line.
| Oil Services |
$OSX |
63.65 |
+1.68 |
+2.71% |
-21.03% |
| Integrated Oil |
$XOI |
1,176.30 |
+15.43 |
+1.33% |
+1.48% |
| Semiconductor |
$SOX |
1,519.55 |
+41.23 |
+2.79% |
+31.54% |
| Networking |
$NWX |
547.50 |
+5.85 |
+1.08% |
+12.04% |
| Broker/Dealer |
$XBD |
257.15 |
+2.62 |
+1.03% |
+8.35% |
| Retail |
$RLX |
2,355.11 |
+14.60 |
+0.62% |
+20.69% |
| Gold & Silver |
$XAU |
101.76 |
+1.55 |
+1.55% |
+44.01% |
| Bank |
$BKX |
92.50 |
+1.07 |
+1.17% |
+7.82% |
| Biotech |
$BTK |
4,261.63 |
-14.47 |
-0.34% |
+0.97% |
|
|
|
 |
Found Support After Making Limited Progress
Kenneth J. Gruneisen - Passed the CAN SLIM® Master's Exam
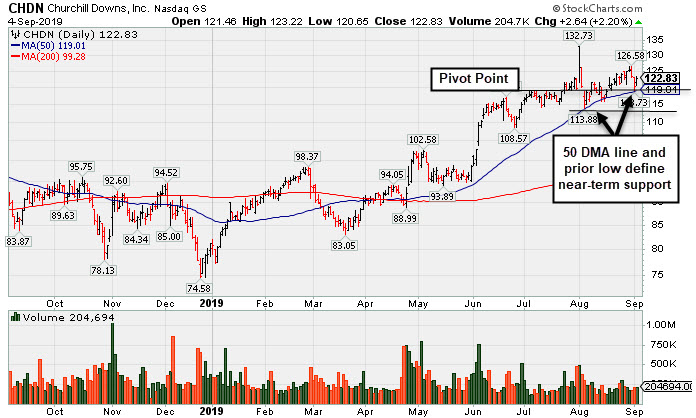
Churchill Downs Inc (CHDN +$2.64 or +2.20% to $122.83) is quietly hovering near its all-time high. It made limited progress above its latest pivot point and has been sputtering. Recently it has found support near its 50-day moving average (DMA) line ($119.02). More damaging losses below that important short-term average or undercutting the recent low ($113.88 on 8/05/19) would raise greater concerns and trigger technical sell signals.
Recently it reported Jun '19 earnings +10% on +26% sales revenues versus the year ago period, below the +25% minimum earnings guideline (C criteria). That broke a streak of 6 consecutive quarters well above the +25% minimum earnings guideline (C criteria) versus the year ago periods. It still has an earnings Per Share Rating of 95.
The L criteria of the fact-based investment system guides investors toward buying leading stocks that are in leading industry groups. The Leisure - Gaming/Equipment industry group has a Group Relative Strength Rating of D+.
It was highlighted in yellow in the 6/05/19 mid-day report (read here). It was last shown in this FSU section on 8/14/19 with an annotated graph under the headline, "Recently Found Support at 50-Day Moving Average". Annual earnings (A criteria) growth has been strong since a downturn in FY '14.
The number of top-rated funds owning its shares rose from 333 in Jun '17 to 437 in Jun '18, a reassuring sign concerning the I criteria. Its current Up/Down Volume Ratio of 1.5 is an unbiased indication its shares have been under accumulation over the past 50 days. It has a small supply of 35.2 million shares (S criteria) outstanding following a 3:1 split effective 1/28/19, and this small supply can contribute to greater price volatility in the event of institutional buying or selling. |
|
|
Color Codes Explained :
Y - Better candidates highlighted by our
staff of experts.
G - Previously featured
in past reports as yellow but may no longer be buyable under the
guidelines.
***Last / Change / Volume data in this table is the closing quote data***
Symbol/Exchange
Company Name
Industry Group |
PRICE |
CHANGE
(%Change) |
Day High |
Volume
(% DAV)
(% 50 day avg vol) |
52 Wk Hi
% From Hi |
Featured
Date |
Price
Featured |
Pivot Featured |
|
Max Buy |
 EPAM
-
NYSE
EPAM
-
NYSE
Epam Systems Inc
COMPUTER SOFTWARE and SERVICES - Information Technology Service
|
$191.44
|
+3.17
1.68% |
$192.00
|
309,000
78.03% of 50 DAV
50 DAV is 396,000
|
$201.00
-4.76%
|
5/9/2019
|
$169.25
|
PP = $180.55
|
|
MB = $189.58
|
 Most Recent Note - 9/4/2019 1:14:32 PM
G - Faces some resistance due to overhead supply up to the $201 level. Quietly consolidating near its 50 DMA line ($188.31) which defines support above the recent low ($175.33 on 8/07/19). Reported earnings +27% on +24% sales revenues for the Jun '19 quarter. See the latest FSU analysis for more details and an annotated graph.
>>> FEATURED STOCK ARTICLE : Volume Light During Brief Consolidation Above 50-Day Average - 8/29/2019 |
View all notes |
Set NEW NOTE alert |
Company Profile |
SEC
News |
Chart |
Request a new note
C
A
S
I |
AUDC
-
NASDAQ
Audiocodes Ltd
ELECTRONICS - Scientific and Technical Instrum
|
$17.43
|
-0.14
-0.80% |
$17.93
|
89,445
52.31% of 50 DAV
50 DAV is 171,000
|
$19.74
-11.70%
|
7/15/2019
|
$17.10
|
PP = $17.54
|
|
MB = $18.42
|
Most Recent Note - 8/30/2019 4:59:14 PM
Y - Volume totals have been cooling while consolidating near important support defined by prior highs in the $17 area and its 50 DMA line ($17.16). More damaging losses would raise concerns and trigger technical sell signals. Reported earnings +57% on +14% sales revenues for the Jun '19 quarter, continuing its strong earnings track record. See the latest FSU analysis for more details and a new annotated graph.
>>> FEATURED STOCK ARTICLE : Volume Cooling While Consolidating Above Support Levels - 8/30/2019 |
View all notes |
Set NEW NOTE alert |
Company Profile |
SEC
News |
Chart |
Request a new note
C
A
S
I |
LHCG
-
NASDAQ
L H C Group Inc
HEALTH SERVICES - Home Health Care
|
$119.90
|
+1.34
1.13% |
$121.20
|
184,811
84.39% of 50 DAV
50 DAV is 219,000
|
$129.37
-7.32%
|
7/1/2019
|
$110.94
|
PP = $122.20
|
|
MB = $128.31
|
Most Recent Note - 8/30/2019 4:53:45 PM
G - Still quietly sputtering just below its 50 DMA line ($121.07) which has acted as resistance. Any breach of recent low ($116.67 on 8/13/19) could raise more serious concerns.
>>> FEATURED STOCK ARTICLE : Sputtering Below 50-Day Average and Below Pivot Point - 8/20/2019 |
View all notes |
Set NEW NOTE alert |
Company Profile |
SEC
News |
Chart |
Request a new note
C
A
S
I |
CHDN
-
NASDAQ
Churchill Downs Inc
LEISURE - Gaming Activities
|
$122.83
|
+2.64
2.20% |
$123.22
|
204,488
90.08% of 50 DAV
50 DAV is 227,000
|
$132.73
-7.46%
|
7/22/2019
|
$118.45
|
PP = $118.89
|
|
MB = $124.83
|
Most Recent Note - 9/4/2019 5:37:23 PM
Y - Its 50 DMA line ($119) and prior low ($113.88 on 8/05/19) define important near-term support to watch. Jun '19 earnings +10% on +26% sales revenues versus the year ago period were below the +25% minimum earnings guideline (C criteria), noted recently raising fundamental concerns. See the latest FSU analysis for more details and a new annotated graph.
>>> FEATURED STOCK ARTICLE : Found Support After Making Limited Progress - 9/4/2019 |
View all notes |
Set NEW NOTE alert |
Company Profile |
SEC
News |
Chart |
Request a new note
C
A
S
I |
LULU
-
NASDAQ
Lululemon Athletica
MANUFACTURING - Textile Manufacturing
|
$180.70
|
+1.16
0.65% |
$181.86
|
2,072,076
140.86% of 50 DAV
50 DAV is 1,471,000
|
$194.25
-6.98%
|
6/13/2019
|
$174.48
|
PP = $179.60
|
|
MB = $188.58
|
Most Recent Note - 9/3/2019 5:44:10 PM
G - Slumped below its 50 DMA line ($183.68) today with a loss on heavier volume. Faces near-term resistance due to overhead supply up to the $194 level. Due to report earnings news on 9/05/19. Volume and volatility often increase near earnings news. See the latest FSU analysis for more details and a new annotated graph.
>>> FEATURED STOCK ARTICLE : Sank Below 50-Day Average Toward Prior Lows With High Volume - 9/3/2019 |
View all notes |
Set NEW NOTE alert |
Company Profile |
SEC
News |
Chart |
Request a new note
C
A
S
I |
Symbol/Exchange
Company Name
Industry Group |
PRICE |
CHANGE
(%Change) |
Day High |
Volume
(% DAV)
(% 50 day avg vol) |
52 Wk Hi
% From Hi |
Featured
Date |
Price
Featured |
Pivot Featured |
|
Max Buy |
VEEV
-
NYSE
Veeva Systems Inc Cl A
Computer Sftwr-Medical
|
$156.51
|
-1.30
-0.82% |
$158.77
|
1,427,197
98.36% of 50 DAV
50 DAV is 1,451,000
|
$176.90
-11.53%
|
5/30/2019
|
$154.32
|
PP = $145.80
|
|
MB = $153.09
|
Most Recent Note - 8/30/2019
G - Sputtering below its 50 DMA line ($164.66). A convincing rebound is needed for its outlook to improve. The 50 DMA line has acted as resistance. Reported earnings +41% on +27% for the Jul '19 quarter continuing its strong earnings track record.
>>> FEATURED STOCK ARTICLE : Met Resistance After Slumping Below 50-Day Moving Average - 8/23/2019 |
View all notes |
Set NEW NOTE alert |
Company Profile |
SEC
News |
Chart |
Request a new note
C
A
S
I |
PAYC
-
NYSE
Paycom Software Inc
COMPUTER SOFTWARE and SERVICES - Application Software
|
$247.88
|
+3.61
1.48% |
$248.96
|
367,427
62.38% of 50 DAV
50 DAV is 589,000
|
$259.71
-4.56%
|
8/20/2019
|
$246.97
|
PP = $246.95
|
|
MB = $259.30
|
Most Recent Note - 8/30/2019 4:55:28 PM
Y - Volume totals have been cooling while hovering near its all-time high. Color code was changed to yellow with new pivot point cited based on its 7/11/19 high plus 10 cents. Gains above a stock's pivot must have at least +40% above average volume to trigger a proper new (or add-on) technical buy signal. Its 50 DMA line ($237) defines support above the recent low ($216.55 on 8/05/19). Fundamentals remain strong.
>>> FEATURED STOCK ARTICLE : Recently Wedged Higher Without Great Volume Conviction - 8/26/2019 |
View all notes |
Set NEW NOTE alert |
Company Profile |
SEC
News |
Chart |
Request a new note
C
A
S
I |
BLD
-
NYSE
Topbuild Corp
Bldg-Constr Prds/Misc
|
$92.34
|
+2.51
2.79% |
$93.10
|
250,178
86.27% of 50 DAV
50 DAV is 290,000
|
$93.59
-1.34%
|
5/17/2019
|
$82.19
|
PP = $87.31
|
|
MB = $91.68
|
Most Recent Note - 9/4/2019 5:39:38 PM
G - Posted a gain today on light volume and it is perched within close striking distance of its all-time high. Earnings rose +39% on +9% sales revenues for the Jun '19 quarter versus the year ago period. Prior highs in the $86 area define initial support to watch above its 50 DMA line ($85.54) on pullbacks.
>>> FEATURED STOCK ARTICLE : Topbuild Has 4 Consecutive Weekly Gains and Stubbornly Held Ground - 8/19/2019 |
View all notes |
Set NEW NOTE alert |
Company Profile |
SEC
News |
Chart |
Request a new note
C
A
S
I |
TEAM
-
NASDAQ
Atlassian Corp Plc Cl A
Comp Sftwr-Spec Enterprs
|
$129.83
|
-2.06
-1.56% |
$133.42
|
1,721,447
136.19% of 50 DAV
50 DAV is 1,264,000
|
$149.80
-13.33%
|
8/27/2019
|
$142.62
|
PP = $149.90
|
|
MB = $157.40
|
Most Recent Note - 8/30/2019 1:28:37 PM
G - Color code is changed to green after violating its 50 DMA line with today's 4th consecutive loss Formed a 5-week flat base with new pivot point cited based on its 7/26/19 high plus 10 cents. Prior low ($130.78 on 7/23/19) defines the next important near-term support to watch where a violation would raise serious concerns and trigger a more worrisome technical sell signal. Reported earnings +43% on +36% sales revenues for the Jun '19 quarter, continuing its strong earnings track record.
>>> FEATURED STOCK ARTICLE : Consolidating Near High After Recently Finding Support - 8/21/2019 |
View all notes |
Set NEW NOTE alert |
Company Profile |
SEC
News |
Chart |
Request a new note
C
A
S
I |
TTD
-
NASDAQ
The Trade Desk Inc Cl A
Comml Svcs-Advertising
|
$240.19
|
+5.21
2.22% |
$243.69
|
986,916
68.82% of 50 DAV
50 DAV is 1,434,000
|
$289.51
-17.04%
|
7/18/2019
|
$240.61
|
PP = $258.10
|
|
MB = $271.01
|
Most Recent Note - 9/3/2019 5:46:35 PM
G - Slumped below its 50 DMA line ($248) and below the recent low ($239.01 on 8/21/19) raising concerns and triggering technical sell signals. Only a prompt rebound above the 50 DMA line would help its outlook improve. Reported Jun '19 quarterly earnings +58% on +42% sales revenues.
>>> FEATURED STOCK ARTICLE : Consolidating Near 50-Day Moving Average Line - 8/16/2019 |
View all notes |
Set NEW NOTE alert |
Company Profile |
SEC
News |
Chart |
Request a new note
C
A
S
I |
Symbol/Exchange
Company Name
Industry Group |
PRICE |
CHANGE
(%Change) |
Day High |
Volume
(% DAV)
(% 50 day avg vol) |
52 Wk Hi
% From Hi |
Featured
Date |
Price
Featured |
Pivot Featured |
|
Max Buy |
PAGS
-
NYSE
Pagseguro Digital Cl A
Finance-CrdtCard/PmtPr
|
$51.40
|
+1.29
2.57% |
$52.24
|
1,146,507
51.83% of 50 DAV
50 DAV is 2,212,000
|
$53.43
-3.80%
|
6/25/2019
|
$37.69
|
PP = $40.07
|
|
MB = $42.07
|
Most Recent Note - 9/4/2019 12:51:17 PM
G - Perched within striking distance of its all-time high with today's gain on light volume. Volume totals have been cooling while stubbornly holding its ground near its all-time high. Its 50 DMA line ($45.52) and the recent low ($42.00 on 8/05/19) define important levels to watch on pullbacks. Reported earnings +35% on +39% sales revenues for the quarter ended June 30,2019 versus the year ago period.
>>> FEATURED STOCK ARTICLE : Brazil-Based Digital Payments Firm Perched at All-Time High - 8/22/2019 |
View all notes |
Set NEW NOTE alert |
Company Profile |
SEC
News |
Chart |
Request a new note
C
A
S
I |
|
|
|
THESE ARE NOT BUY RECOMMENDATIONS!
Comments contained in the body of this report are technical
opinions only. The material herein has been obtained
from sources believed to be reliable and accurate, however,
its accuracy and completeness cannot be guaranteed.
This site is not an investment advisor, hence it does
not endorse or recommend any securities or other investments.
Any recommendation contained in this report may not
be suitable for all investors and it is not to be deemed
an offer or solicitation on our part with respect to
the purchase or sale of any securities. All trademarks,
service marks and trade names appearing in this report
are the property of their respective owners, and are
likewise used for identification purposes only.
This report is a service available
only to active Paid Premium Members.
You may opt-out of receiving report notifications
at any time. Questions or comments may be submitted
by writing to Premium Membership Services 665 S.E. 10 Street, Suite 201 Deerfield Beach, FL 33441-5634 or by calling 1-800-965-8307
or 954-785-1121.
|
|
|