You are not logged in.
This means you
CAN ONLY VIEW reports that were published prior to Friday, February 16, 2024.
You
MUST UPGRADE YOUR MEMBERSHIP if you want to see any current reports.
AFTER MARKET UPDATE - THURSDAY, SEPTEMBER 3RD, 2020
Previous After Market Report Next After Market Report >>>
|
|
|
|
DOW |
-807.77 |
28,292.73 |
-2.78% |
|
Volume |
993,342,765 |
+12% |
|
Volume |
4,426,210,800 |
+12% |
|
NASDAQ |
-587.72 |
11,468.73 |
-4.87% |
|
Advancers |
585 |
20% |
|
Advancers |
689 |
22% |
|
S&P 500 |
-125.78 |
3,455.06 |
-3.51% |
|
Decliners |
2,320 |
80% |
|
Decliners |
2,427 |
78% |
|
Russell 2000 |
-47.61 |
1,544.68 |
-2.99% |
|
52 Wk Highs |
44 |
|
|
52 Wk Highs |
42 |
|
|
S&P 600 |
-24.03 |
896.17 |
-2.61% |
|
52 Wk Lows |
14 |
|
|
52 Wk Lows |
52 |
|
|
 |
Major Indices Fell With Higher Volume While Leadership Thinned
Kenneth J. Gruneisen - Passed the CAN SLIM® Master's Exam
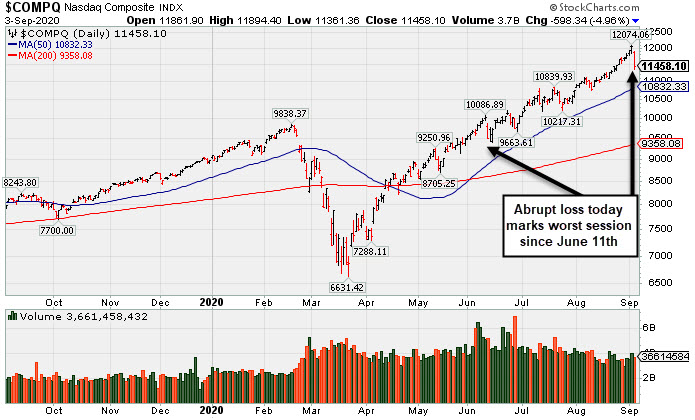
The Nasdaq Composite tumbled 5.0%, snapping a 10-session winning streak. The S&P 500 lost 3.5%, while the Dow slumped 807 points. The reported volume totals were higher than the prior session totals on the NYSE and on the Nasdaq exchange, indicative of distributional pressure or increased selling from the institutional crowd. Breadth was negative as decliners led advancers by a 4-1 margin on the NYSE and nearly 4-1 on the Nasdaq exchange. Leadership contracted abruptly as there were only 12 high-ranked companies from the Leaders List that hit new 52-week highs and were listed on the BreakOuts Page, versus the total of 102 on the prior session. New 52-week highs totals contracted yet still outnumbered new 52-week lows on the NYSE, but new lows outnumbered new highs on the Nasdaq exchange. The major indices are in a confirmed uptrend (M criteria). Any sustainable rally requires a healthy crop of new leaders, so it remains ever-important to see substantial new highs totals.
PICTURED: The Nasdaq Composite Index suffered an abrupt loss on Thursday, marking its worst session since June 11th.
U.S. Stocks suffered their largest selloff since June Thursday amid a retreat in Technology stocks. Elsewhere, the CBOE Volatility Index, commonly referred to as Wall Streets “fear gauge,” rose 25.5% on the day to its highest level since July.
All 11 S&P 500 sectors finished the session in negative territory, led by a 5.8% decline in Information Technology stocks. Microsoft, Apple, Amazon, Alphabet, and Facebook shed more than $500 billion in combined market cap, with investors citing lofty valuations and the recent surge in mega-cap stocks as a possible rationale for the rout. Meanwhile, travel stocks bucked the downtrend with Carnival Corp (CCL +5.21%) and United Airlines (UAL +1.38%) rose.
Economic data was also in focus, with a report showing initial jobless claims fell below 1 million for the second time since mid-March. A separate update from the Institute for Supply Management (ISM) showed services sector activity expanded at a slightly slower pace in August compared with the prior month. Investors received an encouraging update on the COVID front, as the Centers for Disease Control and Prevention (CDC) gave guidance for states to prepare for vaccine distribution as soon as November.
Treasuries rallied amid the perceived “risk off” sentiment, sending the yield on the 10-year note down two basis points to 0.63%. Commodities were mostly lower, WTI crude falling 0.4% to $41.35/barrel and COMEX gold easing 0.3% to $1938.00/ounce. |
 Kenneth J. Gruneisen started out as a licensed stockbroker in August 1987, a couple of months prior to the historic stock market crash that took the Dow Jones Industrial Average down -22.6% in a single day. He has published daily fact-based fundamental and technical analysis on high-ranked stocks online for two decades. Through FACTBASEDINVESTING.COM, Kenneth provides educational articles, news, market commentary, and other information regarding proven investment systems that work in good times and bad.
Comments contained in the body of this report are technical opinions only and are not necessarily those of Gruneisen Growth Corp. The material herein has been obtained from sources believed to be reliable and accurate, however, its accuracy and completeness cannot be guaranteed. Our firm, employees, and customers may effect transactions, including transactions contrary to any recommendation herein, or have positions in the securities mentioned herein or options with respect thereto. Any recommendation contained in this report may not be suitable for all investors and it is not to be deemed an offer or solicitation on our part with respect to the purchase or sale of any securities. |
|
 |
Retail and Tech Indexes Led Market Downdraft
Kenneth J. Gruneisen - Passed the CAN SLIM® Master's Exam
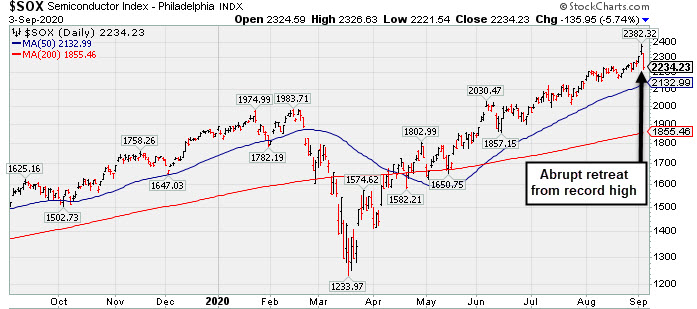
The Retail Index ($RLX -4.06%) weighed on the major indices as it suffered a big loss while the Broker/Dealer Index ($XBD -1.39%) and Bank Index ($BKX -0.78%) each had smaller losses. The Semiconductor Index ($SOX -5.69%) and Networking Index ($NWX -7.80%) both outpaced the Biotech Index ($BTK -3.39%) to the downside. Commodity-linked groups also edged lower as the Gold & Silver Index ($XAU -0.96%), Integrated Oil Index ($XOI -0.76%), and Oil Services Index ($OSX -0.36%) each lost ground.
PICTURED: The Semiconductor Index ($SOX -5.69%) abruptly retreated from its record high.
| Oil Services |
$OSX |
35.26 |
-0.13 |
-0.36% |
-54.96% |
| Integrated Oil |
$XOI |
705.74 |
-5.41 |
-0.76% |
-44.45% |
| Semiconductor |
$SOX |
2,235.29 |
-134.90 |
-5.69% |
+20.85% |
| Networking |
$NWX |
559.13 |
-47.29 |
-7.80% |
-4.16% |
| Broker/Dealer |
$XBD |
294.80 |
-4.15 |
-1.39% |
+1.52% |
| Retail |
$RLX |
3,541.75 |
-149.96 |
-4.06% |
+44.60% |
| Gold & Silver |
$XAU |
150.93 |
-1.47 |
-0.96% |
+41.16% |
| Bank |
$BKX |
77.54 |
-0.61 |
-0.78% |
-31.60% |
| Biotech |
$BTK |
5,278.35 |
-184.96 |
-3.39% |
+4.16% |
|
|
|
 |
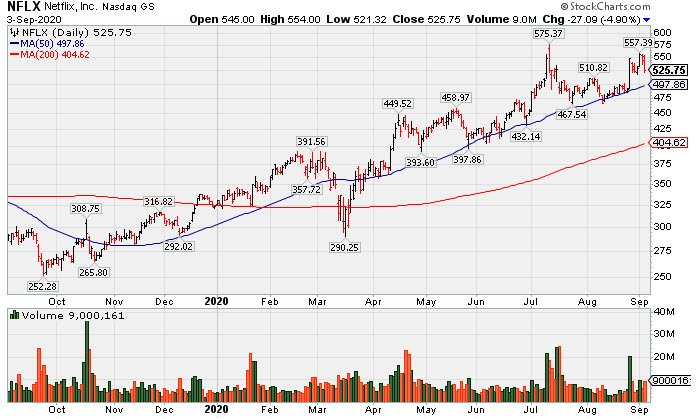
Pulling Back After Best Ever Close on Tuesday
Kenneth J. Gruneisen - Passed the CAN SLIM® Master's Exam
Netflix Inc (NFLX -$27.09 or -4.90% to $525.75) pulled back today with +15% above average volume. A new pivot point cited based on its 7/13/20 high plus 10 cents. Subsequent volume-driven gains above the pivot point may trigger a new (or add-on) technical buy signal. It found support near its 50 DMA line ($498) on consolidations during its ongoing ascent. More damaging losses woud raise concerns and trigger a technical sell signal. NFLX was last shown in this FSU section on 8/18/20 with an annotated graph under the headline,"50-Day Moving Average Acted As Support Level". Fundamentals remain strong. NFLX has been consolidating after reporting Jun '20 earnings +165% on +25% sales revenues versus the year ago period. It has tallied 4 consecutive quarterly comparisons well above the +25% minimum guideline (C criteria). It has traded up as much as +46.2% since it was highlighted in yellow with pivot point cited based on its 3/03/20 high plus 10 cents in the 4/13/20 mid-day report (read here). A previously noted downturn in FY '15 earnings (A criteria) has been followed by very strong growth. The number of top-rated funds owning its shares (I criteria) rose from 1,534 in Mar '17 to 2,774 in Jun '20, a reassuring sign concerning the I criteria. Its current Up/Down Volume Ratio of 1.1 is an unbiased indication its shares have been under slight accumulation over the past 50 days. The company has 423.4 million shares in the public float (S criteria) which can make it a less likely sprinter. It has a Timeliness rating of A, a Sponsorship rating of B, and an Accumulation/Distribution Rating of C+. Charts courtesy of www.stockcharts.com
 |
|
|
Color Codes Explained :
Y - Better candidates highlighted by our
staff of experts.
G - Previously featured
in past reports as yellow but may no longer be buyable under the
guidelines.
***Last / Change / Volume data in this table is the closing quote data***
Symbol/Exchange
Company Name
Industry Group |
PRICE |
CHANGE
(%Change) |
Day High |
Volume
(% DAV)
(% 50 day avg vol) |
52 Wk Hi
% From Hi |
Featured
Date |
Price
Featured |
Pivot Featured |
|
Max Buy |
 CRL
-
NYSE
CRL
-
NYSE
Charles River Labs Intl
DRUGS - Biotechnology
|
$207.91
|
-12.20
-5.54% |
$219.88
|
362,322
105.63% of 50 DAV
50 DAV is 343,000
|
$221.97
-6.33%
|
7/15/2020
|
$192.66
|
PP = $189.95
|
|
MB = $199.45
|
 Most Recent Note - 9/3/2020 6:15:05 PM
G - Volume was higher (near average) behind today's big loss while retreating from its all-time high. The 50 DMA line ($201) defines important near-term support to watch. Recently reported Jun '20 quarterly earnings -3% on +4% sales revenues, below the +25% minimum guideline (C criteria), but better than expected while the company also raised its guidance.
>>> FEATURED STOCK ARTICLE : Volume Totals Cooling While Hovering in Tight Range Near Record High - 8/25/2020 |
View all notes |
Set NEW NOTE alert |
Company Profile |
SEC
News |
Chart |
Request a new note
C
A
S
I |
EBS
-
NYSE
Emergent Biosolutions
DRUGS - Biotechnology
|
$106.97
|
-4.54
-4.07% |
$111.50
|
407,604
41.38% of 50 DAV
50 DAV is 985,000
|
$137.61
-22.27%
|
7/7/2020
|
$89.47
|
PP = $93.68
|
|
MB = $98.36
|
Most Recent Note - 9/3/2020 6:25:24 PM
G - Undercut both its prior high $107.16 on 7/20/20) and its 50 DMA line ($107.37) with today's loss on light volume raising concerns. Fundamentals remain strong.
>>> FEATURED STOCK ARTICLE : High Ranked Biomed Leader is Extended From Prior Base - 8/21/2020 |
View all notes |
Set NEW NOTE alert |
Company Profile |
SEC
News |
Chart |
Request a new note
C
A
S
I |
AMD
-
NASDAQ
Advanced Micro Devices
ELECTRONICS - Semiconductor - Broad Line
|
$82.54
|
-7.68
-8.51% |
$88.47
|
86,548,382
137.24% of 50 DAV
50 DAV is 63,063,000
|
$94.28
-12.45%
|
8/31/2020
|
$90.42
|
PP = $87.39
|
|
MB = $91.76
|
Most Recent Note - 9/3/2020 6:09:20 PM
Y - Abruptly pulling back from its all-time high with a big volume-driven loss today negating the recent breakout after it rose from an advanced "3-weeks tight" base this week. The recent low ($76.10 on 8/11/20) defines near-term support above its 50 DMA line ($70.93). Fundamentals remain strong. See the latest FSU analysis for more details and an annotated graph.
>>> FEATURED STOCK ARTICLE : Perched at All-Time High After Another Bullish Breakout - 9/2/2020 |
View all notes |
Set NEW NOTE alert |
Company Profile |
SEC
News |
Chart |
Request a new note
C
A
S
I |
TREX
-
NYSE
Trex Company Inc
MATERIALS and CONSTRUCTION - General Building Materials
|
$141.31
|
-10.97
-7.20% |
$150.79
|
598,074
77.07% of 50 DAV
50 DAV is 776,000
|
$156.63
-9.78%
|
6/26/2020
|
$109.05
|
PP = $132.94
|
|
MB = $139.59
|
Most Recent Note - 9/3/2020 6:35:48 PM
G - Abruptly retreated from its all-time high with today's big loss backed by below average volume. Important near-term support is at its 50 DMA line ($137.65). Reported Jun '20 quarterly earnings +27% on +7% sales revenues versus the year ago period.
>>> FEATURED STOCK ARTICLE : Wedging Into New High Territory After Latest Earnings Report - 8/19/2020 |
View all notes |
Set NEW NOTE alert |
Company Profile |
SEC
News |
Chart |
Request a new note
C
A
S
I |
NFLX
-
NASDAQ
Netflix Inc
SPECIALTY RETAIL - Music and Video Stores
|
$525.75
|
-27.09
-4.90% |
$554.00
|
8,998,497
115.74% of 50 DAV
50 DAV is 7,775,000
|
$575.37
-8.62%
|
9/1/2020
|
$547.45
|
PP = $575.47
|
|
MB = $604.24
|
Most Recent Note - 9/3/2020 6:28:34 PM
Y - Pulled back today on +15% above average volume after a best-ever close on Tuesday. A new pivot point was cited based on its 7/13/20 high plus 10 cents. Subsequent volume-driven gains above the pivot point may trigger a new (or add-on) technical buy signal. Found support near its 50 DMA line ($498) on consolidations during its ongoing ascent. Fundamentals remain strong. See the latest FSU analysis for more details and a new annotated graph.
>>> FEATURED STOCK ARTICLE : Pulling Back After Best Ever Close on Tuesday - 9/3/2020 |
View all notes |
Set NEW NOTE alert |
Company Profile |
SEC
News |
Chart |
Request a new note
C
A
S
I |
Symbol/Exchange
Company Name
Industry Group |
PRICE |
CHANGE
(%Change) |
Day High |
Volume
(% DAV)
(% 50 day avg vol) |
52 Wk Hi
% From Hi |
Featured
Date |
Price
Featured |
Pivot Featured |
|
Max Buy |
CHGG
-
NYSE
Chegg Inc
Consumer Svcs-Education
|
$69.90
|
-8.06
-10.34% |
$76.36
|
5,043,009
140.32% of 50 DAV
50 DAV is 3,594,000
|
$89.82
-22.18%
|
6/17/2020
|
$63.71
|
PP = $68.08
|
|
MB = $71.48
|
Most Recent Note - 9/3/2020 6:12:48 PM
Violated its 50 DMA line ($75.15) with today's big loss on higher volume raising greater concerns and triggering a worrisome technical sell signal. Only a prompt rebound would help its outlook improve. It will be dropped from the Featured Stocks list tonight. Reported Jun '20 quarterly earnings +61% on +63% sales revenues versus the year ago period.
>>> FEATURED STOCK ARTICLE : Volume-Driven Loss Tests Support at 50-Day Moving Average - 8/24/2020 |
View all notes |
Set NEW NOTE alert |
Company Profile |
SEC
News |
Chart |
Request a new note
C
A
S
I |
LGIH
-
NASDAQ
L G I Homes Inc
Bldg-Resident/Comml
|
$114.85
|
-8.06
-6.56% |
$123.30
|
569,683
175.83% of 50 DAV
50 DAV is 324,000
|
$123.94
-7.33%
|
7/7/2020
|
$99.19
|
PP = $95.82
|
|
MB = $100.61
|
Most Recent Note - 9/3/2020 6:26:01 PM
G - Pulled back abruptly today after challenging its 52-week high. It did not form a sound new base of sufficient length. Its 50 DMA line ($108.43) defines near-term support to watch above the prior low ($104.24 on 8/11/20). Reported Jun '20 quarterly earnings +21% on +4% sales revenues, breaking a streak of 4 comparisons above the +25% minimum guideline (C criteria).
>>> FEATURED STOCK ARTICLE : Leadership in Building - Residential/Commercial Group Improving - 8/20/2020 |
View all notes |
Set NEW NOTE alert |
Company Profile |
SEC
News |
Chart |
Request a new note
C
A
S
I |
NOW
-
NYSE
Servicenow Inc
Computer Sftwr-Enterprse
|
$468.84
|
-30.85
-6.17% |
$487.99
|
2,021,848
118.93% of 50 DAV
50 DAV is 1,700,000
|
$501.82
-6.57%
|
8/20/2020
|
$453.34
|
PP = $454.79
|
|
MB = $477.53
|
Most Recent Note - 9/3/2020 6:31:40 PM
Y - Pulled back on higher volume today retreating below its "max buy" level and its color code changed to yellow. The prior high ($454) defines initial support to watch above its 50 DMA line ($436). Fundamentals remain strong.
>>> FEATURED STOCK ARTICLE : Quiet Gain to New High for Computer Software Firm - 8/28/2020 |
View all notes |
Set NEW NOTE alert |
Company Profile |
SEC
News |
Chart |
Request a new note
C
A
S
I |
TTD
-
NASDAQ
The Trade Desk Inc Cl A
Comml Svcs-Advertising
|
$464.65
|
-50.36
-9.78% |
$500.17
|
1,506,250
116.76% of 50 DAV
50 DAV is 1,290,000
|
$515.20
-9.81%
|
6/3/2020
|
$340.61
|
PP = $327.35
|
|
MB = $343.72
|
Most Recent Note - 9/3/2020 6:37:39 PM
G - Suffered a big loss with +17% above average volume today, abruptly retreating from its all-time high. Recently reported Jun '20 quarterly earnings -3% on -13% sales revenues versus the year ago period, raising fundamental concerns. Its 50 DMA line ($454) defines near-term support above the prior low ($404 on 7/24/20) where violations may trigger technical sell signals.
>>> FEATURED STOCK ARTICLE : Volume Totals Cooling While Still Hovering Near Record High - 8/27/2020 |
View all notes |
Set NEW NOTE alert |
Company Profile |
SEC
News |
Chart |
Request a new note
C
A
S
I |
DOCU
-
NASDAQ
Docusign Inc
Computer Sftwr-Enterprse
|
$242.01
|
-23.15
-8.73% |
$251.90
|
30,397,206
590.93% of 50 DAV
50 DAV is 5,144,000
|
$290.23
-16.61%
|
6/10/2020
|
$149.73
|
PP = $152.10
|
|
MB = $159.71
|
Most Recent Note - 9/3/2020 6:21:37 PM
G - There was a "negative reversal" on the prior session and another big volume-driven loss today, abruptly retreating from its all-time high. It did not form a sound base of sufficient length. Its 50 DMA line ($205) and prior low ($189.12 on 8/12/20) define important near-term support to watch.
>>> FEATURED STOCK ARTICLE : Perched Near All-Time High After Finding Support Above 50 DMA - 8/31/2020 |
View all notes |
Set NEW NOTE alert |
Company Profile |
SEC
News |
Chart |
Request a new note
C
A
S
I |
Symbol/Exchange
Company Name
Industry Group |
PRICE |
CHANGE
(%Change) |
Day High |
Volume
(% DAV)
(% 50 day avg vol) |
52 Wk Hi
% From Hi |
Featured
Date |
Price
Featured |
Pivot Featured |
|
Max Buy |
PING
-
NYSE
Ping Identity Holdings Corp
Computer Sftwr-Security
|
$32.29
|
-3.76
-10.43% |
$35.25
|
1,319,688
108.38% of 50 DAV
50 DAV is 1,217,700
|
$37.80
-14.58%
|
6/1/2020
|
$29.24
|
PP = $29.90
|
|
MB = $31.40
|
Most Recent Note - 9/3/2020 6:34:03 PM
G - Violated its 50 DMA line ($33.55) with today's big volume-driven loss raising concerns and triggering a technical sell signal. The prior low ($30.50 on 8/13/20) defines the next important support to watch. Sputtering in recent weeks after it reported Jun '20 quarterly earnings -27% on -6% sales revenues versus the year ago period, below the +25% minimum earnings guideline, raising fundamental concerns. Completed Secondary Offerings on 7/09/20 and 5/15/20.
>>> FEATURED STOCK ARTICLE : Found Support Near 50 DMA Line But Latest Earnings Were Sub Par - 8/26/2020 |
View all notes |
Set NEW NOTE alert |
Company Profile |
SEC
News |
Chart |
Request a new note
C
A
S
I |
DT
-
NYSE
Dynatrace Inc
Computer Sftwr-Enterprse
|
$41.74
|
-4.95
-10.60% |
$45.50
|
4,711,578
149.01% of 50 DAV
50 DAV is 3,162,000
|
$48.85
-14.55%
|
9/1/2020
|
$46.37
|
PP = $44.75
|
|
MB = $46.99
|
Most Recent Note - 9/3/2020 6:23:43 PM
Y - Negated the recent breakout with a big volume-driven loss today raising concerns and testing its 50 DMA line ($41.27). See the latest FSU analysis for more details and an annotated graph.
>>> FEATURED STOCK ARTICLE : Volume-Driven Gain for New High Triggered Technical Buy Signal - 9/1/2020 |
View all notes |
Set NEW NOTE alert |
Company Profile |
SEC
News |
Chart |
Request a new note
C
A
S
I |
|
|
|
THESE ARE NOT BUY RECOMMENDATIONS!
Comments contained in the body of this report are technical
opinions only. The material herein has been obtained
from sources believed to be reliable and accurate, however,
its accuracy and completeness cannot be guaranteed.
This site is not an investment advisor, hence it does
not endorse or recommend any securities or other investments.
Any recommendation contained in this report may not
be suitable for all investors and it is not to be deemed
an offer or solicitation on our part with respect to
the purchase or sale of any securities. All trademarks,
service marks and trade names appearing in this report
are the property of their respective owners, and are
likewise used for identification purposes only.
This report is a service available
only to active Paid Premium Members.
You may opt-out of receiving report notifications
at any time. Questions or comments may be submitted
by writing to Premium Membership Services 665 S.E. 10 Street, Suite 201 Deerfield Beach, FL 33441-5634 or by calling 1-800-965-8307
or 954-785-1121.
|
|
|