You are not logged in.
This means you
CAN ONLY VIEW reports that were published prior to Sunday, February 25, 2024.
You
MUST UPGRADE YOUR MEMBERSHIP if you want to see any current reports.
AFTER MARKET UPDATE - TUESDAY, SEPTEMBER 1ST, 2020
Previous After Market Report Next After Market Report >>>
|
|
|
|
DOW |
+215.61 |
28,645.66 |
+0.76% |
|
Volume |
814,175,270 |
-28% |
|
Volume |
3,474,877,100 |
-4% |
|
NASDAQ |
+164.21 |
11,939.67 |
+1.39% |
|
Advancers |
1,875 |
63% |
|
Advancers |
1,790 |
54% |
|
S&P 500 |
+26.34 |
3,526.65 |
+0.75% |
|
Decliners |
1,085 |
37% |
|
Decliners |
1,535 |
46% |
|
Russell 2000 |
+16.71 |
1,578.58 |
+1.07% |
|
52 Wk Highs |
112 |
|
|
52 Wk Highs |
209 |
|
|
S&P 600 |
+10.55 |
909.34 |
+1.17% |
|
52 Wk Lows |
16 |
|
|
52 Wk Lows |
43 |
|
|
 |
Leadership Improved but Volume Totals Were Lower as Indices Rose
Kenneth J. Gruneisen - Passed the CAN SLIM® Master's Exam
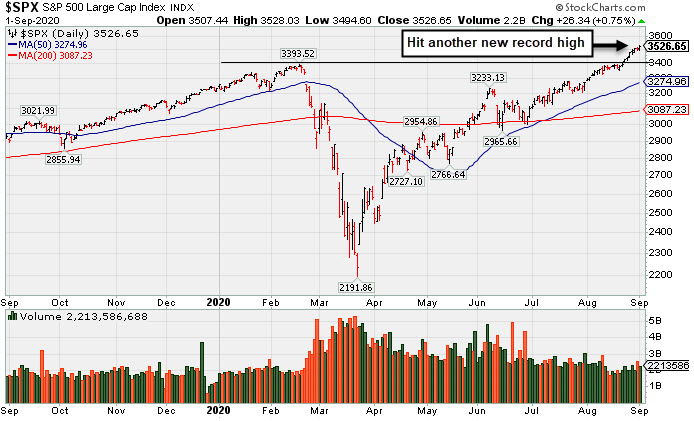
Both the S&P 500 and Nasdaq Composite climbed to fresh all-time highs, rising 0.8% and 1.4%, respectively. The Dow jumped 215 points, and now sits within 3.1% of its pre-pandemic record level. The reported volume totals were lighter than the prior session totals on the NYSE and on the Nasdaq exchange. Breadth was positive as advancers led decliners by a 9-5 margin on the NYSE and 6-5 on the Nasdaq exchange. There were 75 high-ranked companies from the Leaders List that hit new 52-week highs and were listed on the BreakOuts Page, versus the total of 38 on the prior session. New 52-week highs totals expanded and easily outnumbered new 52-week lows totals on both the NYSE and Nasdaq exchange. The major indices are in a confirmed uptrend (M criteria). Any sustainable rally requires a healthy crop of new leaders, so it remains ever-important to see substantial new highs totals.
Charts used courtesy of www.stockcharts.com
PICTURED: The S&P 500 Index hit another new record high.
Stocks resumed their rally on the first day of September as investors digested upbeat manufacturing reports from around the world. Also buoying the mood were comments from U.S. Treasury Secretary Steven Mnuchin, who suggested that a new fiscal stimulus bill would "hopefully" be announced next week.
On the data front, a report from the Institute for Supply Management (ISM) showed U.S. manufacturing PMI increased from 54.2 to 56.0 in August, the best reading since late 2018. Overseas, a private survey of Chinese manufacturing activity indicated that sector growth accelerated at the fastest pace in nearly a decade last month. Elsewhere, Federal Reserve Governor Lael Brainard noted that policymakers need to “pivot from stabilization to accommodation” in order to hit the Fed’s new goals of maximum employment and average inflation of 2% over time. Treasuries advanced following the comments, with the 10-year note yield losing three basis points to 0.68%. In commodities, WTI crude rose 0.7% to $42.92/barrel as improving economic data bolstered the outlook for demand.
Tech was a notable outperformer, with Apple (AAPL +3.7%) rose following news the company requested that its suppliers build at least 75 million 5G iPhones this year to meet strong demand. In earnings, Zoom Video Communications (ZM +40.78%) surged after raising its forward guidance on the heels of an earnings beat. In other corporate news, Walmart (WMT +6.29%) rose after unveiling Walmart+, a new membership program set to launch on September 15.
|
 Kenneth J. Gruneisen started out as a licensed stockbroker in August 1987, a couple of months prior to the historic stock market crash that took the Dow Jones Industrial Average down -22.6% in a single day. He has published daily fact-based fundamental and technical analysis on high-ranked stocks online for two decades. Through FACTBASEDINVESTING.COM, Kenneth provides educational articles, news, market commentary, and other information regarding proven investment systems that work in good times and bad.
Comments contained in the body of this report are technical opinions only and are not necessarily those of Gruneisen Growth Corp. The material herein has been obtained from sources believed to be reliable and accurate, however, its accuracy and completeness cannot be guaranteed. Our firm, employees, and customers may effect transactions, including transactions contrary to any recommendation herein, or have positions in the securities mentioned herein or options with respect thereto. Any recommendation contained in this report may not be suitable for all investors and it is not to be deemed an offer or solicitation on our part with respect to the purchase or sale of any securities. |
|
 |
Retail, Financial, and Semiconductor Indexes Led Group Gainers
Kenneth J. Gruneisen - Passed the CAN SLIM® Master's Exam
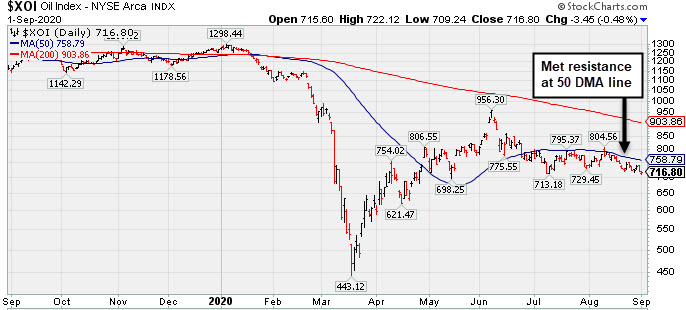
The Retail Index ($RLX +1.05%) and Broker/Dealer Index ($XBD +0.90%) helped underpin the major indices' rally and the Bank Index ($BKX +0.35%) also edged higher. The tech sector was mixed as the Semiconductor Index ($SOX +1.98%) posted a big gain and outpaced the Networking Index ($NWX +0.73%), meanwhile the Biotech Index ($BTK -2.12%) lost ground. Energy-linked groups were mixed as the Oil Services Index ($OSX +0.56%) edged higher and the Integrated Oil Index ($XOI -0.48%) edged lower. The Gold & Silver Index ($XAU -1.20%) lost ground.
PICTURED: The Integrated Oil Index ($XOI -0.48%) has sputtered in recent months and met resistance at its 50-day moving average (DMA) line when trying to rebound.
| Oil Services |
$OSX |
35.91 |
+0.20 |
+0.56% |
-54.14% |
| Integrated Oil |
$XOI |
716.80 |
-3.45 |
-0.48% |
-43.58% |
| Semiconductor |
$SOX |
2,305.20 |
+44.77 |
+1.98% |
+24.63% |
| Networking |
$NWX |
596.52 |
+4.30 |
+0.73% |
+2.25% |
| Broker/Dealer |
$XBD |
296.89 |
+2.66 |
+0.90% |
+2.24% |
| Retail |
$RLX |
3,653.23 |
+37.82 |
+1.05% |
+49.16% |
| Gold & Silver |
$XAU |
152.36 |
-1.85 |
-1.20% |
+42.50% |
| Bank |
$BKX |
76.99 |
+0.26 |
+0.35% |
-32.09% |
| Biotech |
$BTK |
5,361.98 |
-116.05 |
-2.12% |
+5.81% |
|
|
|
 |
Volume-Driven Gain for New High Triggered Technical Buy Signal
Kenneth J. Gruneisen - Passed the CAN SLIM® Master's Exam
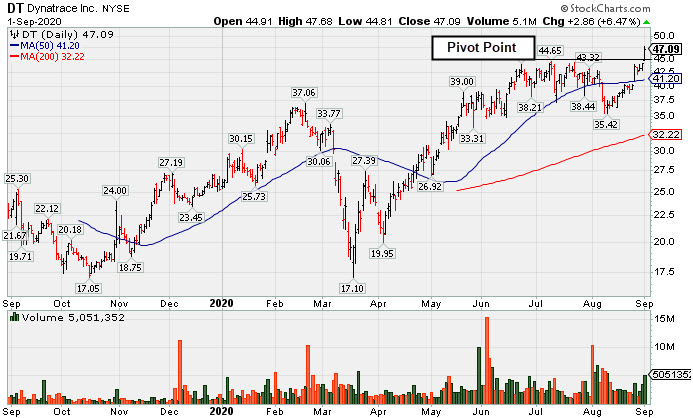
Dynatrace Inc (DT +$2.86 or +6.47% to $47.09) was highlighted in yellow with pivot point cited based on its 7/10/20 high plus 10 cents in the earlier mid-day report (read here). It hit a new 52-week high with today's "breakaway gap" and volume-driven gain triggering a technical buy signal. The high-ranked Computer Sftwr-Enterprse firm completed yet another Secondary Offering on 6/03/20. Such offerings can hinder upward price progress for a while, however they often help companies to attract greater institutional ownership interest. There are 160.2 million shares in the public float (S criteria).
DT went through a deep consolidation and rebounded impressively since completing a Secondary Offering on 2/21/20. Recently it reported earnings +333% on +27% sales revenues for the Jun '20 quarter versus the year ago period, its 4th consecutive strong quarterly comparison versus the year ago periods. Limited history has been noted as a concern since it completed its $16.00 IPO on 8/01/19 and a Secondary Offering on 12/06/19.
The number of top-rated funds owning its shares rose from 226 in Sep '19 to 522 in Jun '20, a reassuring sign concerning the I criteria. Its current Up/Down Volume ratio of 1.2 is an unbiased indication its shares have been under accumulation over the past 50 days. It has an A Timeliness rating and a B Sponsorship rating.
|
|
|
Color Codes Explained :
Y - Better candidates highlighted by our
staff of experts.
G - Previously featured
in past reports as yellow but may no longer be buyable under the
guidelines.
***Last / Change / Volume data in this table is the closing quote data***
Symbol/Exchange
Company Name
Industry Group |
PRICE |
CHANGE
(%Change) |
Day High |
Volume
(% DAV)
(% 50 day avg vol) |
52 Wk Hi
% From Hi |
Featured
Date |
Price
Featured |
Pivot Featured |
|
Max Buy |
 CRL
-
NYSE
CRL
-
NYSE
Charles River Labs Intl
DRUGS - Biotechnology
|
$216.05
|
-2.90
-1.32% |
$219.40
|
367,964
106.04% of 50 DAV
50 DAV is 347,000
|
$221.97
-2.67%
|
7/15/2020
|
$192.66
|
PP = $189.95
|
|
MB = $199.45
|
 Most Recent Note - 9/1/2020 5:43:55 PM
G - Volume was higher (near average) behind today's small loss while still hovering in a very tight range near its all-time high. The 50 DMA line ($199.65) defines initial support to watch above the prior high ($189.85 on 6/03/20). Recently reported Jun '20 quarterly earnings -3% on +4% sales revenues, below the +25% minimum guideline (C criteria), but better than expected while the company also raised its guidance.
>>> FEATURED STOCK ARTICLE : Volume Totals Cooling While Hovering in Tight Range Near Record High - 8/25/2020 |
View all notes |
Set NEW NOTE alert |
Company Profile |
SEC
News |
Chart |
Request a new note
C
A
S
I |
EBS
-
NYSE
Emergent Biosolutions
DRUGS - Biotechnology
|
$110.84
|
-3.21
-2.81% |
$114.49
|
682,250
69.48% of 50 DAV
50 DAV is 982,000
|
$137.61
-19.45%
|
7/7/2020
|
$89.47
|
PP = $93.68
|
|
MB = $98.36
|
Most Recent Note - 8/31/2020 7:30:32 PM
G - Retreating from its all-time high with below average volume behind today's 10th loss in the span of 12 sessions. Its prior high $107.16 on 7/20/20) and its 50 DMA line ($105.19) define near-term support to watch. Fundamentals remain strong.
>>> FEATURED STOCK ARTICLE : High Ranked Biomed Leader is Extended From Prior Base - 8/21/2020 |
View all notes |
Set NEW NOTE alert |
Company Profile |
SEC
News |
Chart |
Request a new note
C
A
S
I |
AMD
-
NASDAQ
Advanced Micro Devices
ELECTRONICS - Semiconductor - Broad Line
|
$92.18
|
+1.36
1.50% |
$92.51
|
55,768,214
88.82% of 50 DAV
50 DAV is 62,789,000
|
$92.64
-0.50%
|
8/31/2020
|
$90.42
|
PP = $87.39
|
|
MB = $91.76
|
Most Recent Note - 8/31/2020 12:37:45 PM
Y - Color code is changed to yellow with new pivot point cited based on its 8/07/20 high after an advanced "3-weeks tight" base. Hitting a new all-time high with today's big gain. A gain above the pivot point backed by at least +40% above average volume may trigger a new (or ad-on) technical buy signal. The recent low ($76.10 on 8/11/20) defines near-term support above its 50 DMA line ($68.85). Fundamentals remain strong.
>>> FEATURED STOCK ARTICLE : AMD Rose +46% Since First Featured on June 9th - 8/14/2020 |
View all notes |
Set NEW NOTE alert |
Company Profile |
SEC
News |
Chart |
Request a new note
C
A
S
I |
TREX
-
NYSE
Trex Company Inc
MATERIALS and CONSTRUCTION - General Building Materials
|
$155.68
|
+6.19
4.14% |
$156.63
|
698,360
89.42% of 50 DAV
50 DAV is 781,000
|
$153.16
1.65%
|
6/26/2020
|
$109.05
|
PP = $132.94
|
|
MB = $139.59
|
Most Recent Note - 9/1/2020 5:38:56 PM
G - Hit another new all-time high with today's big gain backed by higher (near average) volume. It is extended from any sound base. Important near-term support is at its 50 DMA line ($136.72). Reported Jun '20 quarterly earnings +27% on +7% sales revenues versus the year ago period.
>>> FEATURED STOCK ARTICLE : Wedging Into New High Territory After Latest Earnings Report - 8/19/2020 |
View all notes |
Set NEW NOTE alert |
Company Profile |
SEC
News |
Chart |
Request a new note
C
A
S
I |
NFLX
-
NASDAQ
Netflix Inc
SPECIALTY RETAIL - Music and Video Stores
|
$556.55
|
+26.99
5.10% |
$557.39
|
9,538,846
123.72% of 50 DAV
50 DAV is 7,710,000
|
$575.37
-3.27%
|
9/1/2020
|
$547.45
|
PP = $575.47
|
|
MB = $604.24
|
Most Recent Note - 9/1/2020 12:47:53 PM
Y - Color code is changed to yellow with new pivot point cited based on its 7/13/20 high plus 10 cents. Subsequent volume-driven gains above the pivot point may trigger a new (or add-on) technical buy signal. Found support near its 50 DMA line ($494) on consolidations during its ongoing ascent. Fundamentals remain strong.
>>> FEATURED STOCK ARTICLE : 50-Day Moving Average Acted As Support Level - 8/18/2020 |
View all notes |
Set NEW NOTE alert |
Company Profile |
SEC
News |
Chart |
Request a new note
C
A
S
I |
Symbol/Exchange
Company Name
Industry Group |
PRICE |
CHANGE
(%Change) |
Day High |
Volume
(% DAV)
(% 50 day avg vol) |
52 Wk Hi
% From Hi |
Featured
Date |
Price
Featured |
Pivot Featured |
|
Max Buy |
CHGG
-
NYSE
Chegg Inc
Consumer Svcs-Education
|
$76.58
|
+2.84
3.85% |
$77.42
|
2,511,631
68.79% of 50 DAV
50 DAV is 3,651,000
|
$89.82
-14.74%
|
6/17/2020
|
$63.71
|
PP = $68.08
|
|
MB = $71.48
|
Most Recent Note - 9/1/2020 5:42:42 PM
G - Rebounded to close above its 50 DMA line ($74.81) with today's gain backed by lighter volume. Faces near-term resistance due to overhead supply up to the $89 level. More damaging losses would raise greater concerns and trigger a worrisome technical sell signal. Reported Jun '20 quarterly earnings +61% on +63% sales revenues versus the year ago period.
>>> FEATURED STOCK ARTICLE : Volume-Driven Loss Tests Support at 50-Day Moving Average - 8/24/2020 |
View all notes |
Set NEW NOTE alert |
Company Profile |
SEC
News |
Chart |
Request a new note
C
A
S
I |
LGIH
-
NASDAQ
L G I Homes Inc
Bldg-Resident/Comml
|
$115.96
|
+4.10
3.67% |
$115.96
|
258,637
81.85% of 50 DAV
50 DAV is 316,000
|
$123.94
-6.44%
|
7/7/2020
|
$99.19
|
PP = $95.82
|
|
MB = $100.61
|
Most Recent Note - 8/31/2020 7:27:59 PM
G - Consolidating near its 52-week high while its 50 DMA line ($106.69) defines near-term support to watch above the prior low ($104.24 on 8/11/20). Reported Jun '20 quarterly earnings +21% on +4% sales revenues, breaking a streak of 4 comparisons above the +25% minimum guideline (C criteria).
>>> FEATURED STOCK ARTICLE : Leadership in Building - Residential/Commercial Group Improving - 8/20/2020 |
View all notes |
Set NEW NOTE alert |
Company Profile |
SEC
News |
Chart |
Request a new note
C
A
S
I |
NOW
-
NYSE
Servicenow Inc
Computer Sftwr-Enterprse
|
$497.19
|
+15.17
3.15% |
$497.25
|
1,367,628
79.98% of 50 DAV
50 DAV is 1,710,000
|
$494.00
0.65%
|
8/20/2020
|
$453.34
|
PP = $454.79
|
|
MB = $477.53
|
Most Recent Note - 9/1/2020 5:44:47 PM
G - Hit yet another new all-time high today with light volume behind its gain, getting more extended from the latest base. On pullbacks the prior high ($45) defines initial support to watch above its 50 DMA line ($433). Fundamentals remain strong. See the latest FSU analysis for more details and an annotated graph.
>>> FEATURED STOCK ARTICLE : Quiet Gain to New High for Computer Software Firm - 8/28/2020 |
View all notes |
Set NEW NOTE alert |
Company Profile |
SEC
News |
Chart |
Request a new note
C
A
S
I |
TTD
-
NASDAQ
The Trade Desk Inc Cl A
Comml Svcs-Advertising
|
$501.39
|
+20.09
4.17% |
$502.24
|
817,196
62.86% of 50 DAV
50 DAV is 1,300,000
|
$510.00
-1.69%
|
6/3/2020
|
$340.61
|
PP = $327.35
|
|
MB = $343.72
|
Most Recent Note - 9/1/2020 5:40:02 PM
G - Posted a gain with light volume today for its best ever close. Volume totals have been cooling in recent weeks while holding its ground perched near its all-time high. Recently reported Jun '20 quarterly earnings -3% on -13% sales revenues versus the year ago period, raising fundamental concerns. It is extended from any sound base of sufficient length. Its 50 DMA line ($451) defines near-term support above the prior low ($404 on 7/24/20) where violations may trigger technical sell signals.
>>> FEATURED STOCK ARTICLE : Volume Totals Cooling While Still Hovering Near Record High - 8/27/2020 |
View all notes |
Set NEW NOTE alert |
Company Profile |
SEC
News |
Chart |
Request a new note
C
A
S
I |
DOCU
-
NASDAQ
Docusign Inc
Computer Sftwr-Enterprse
|
$268.80
|
+45.80
20.54% |
$271.44
|
20,651,206
463.55% of 50 DAV
50 DAV is 4,455,000
|
$229.83
16.96%
|
6/10/2020
|
$149.73
|
PP = $152.10
|
|
MB = $159.71
|
Most Recent Note - 9/1/2020 12:21:26 PM
G - Hitting new all-time highs with today's big "breakaway gap" and volume-driven gain following 5 consecutive gains with below average volume. It did not form a sound base of sufficient length. Its 50 DMA line ($201) and prior low ($189.12 on 8/12/20) define important near-term support to watch. See the latest FSU analysis for more details and an annotated graph.
>>> FEATURED STOCK ARTICLE : Perched Near All-Time High After Finding Support Above 50 DMA - 8/31/2020 |
View all notes |
Set NEW NOTE alert |
Company Profile |
SEC
News |
Chart |
Request a new note
C
A
S
I |
Symbol/Exchange
Company Name
Industry Group |
PRICE |
CHANGE
(%Change) |
Day High |
Volume
(% DAV)
(% 50 day avg vol) |
52 Wk Hi
% From Hi |
Featured
Date |
Price
Featured |
Pivot Featured |
|
Max Buy |
PING
-
NYSE
Ping Identity Holdings Corp
Computer Sftwr-Security
|
$36.37
|
+1.90
5.51% |
$36.40
|
790,035
63.99% of 50 DAV
50 DAV is 1,234,700
|
$37.80
-3.78%
|
6/1/2020
|
$29.24
|
PP = $29.90
|
|
MB = $31.40
|
Most Recent Note - 9/1/2020 5:37:43 PM
G - Closed near the session high as it posted a big gain today with below average volume. Near-term support levels to watch are its 50 DMA line ($33.48) and prior low ($30.50 on 8/13/20). Sputtering in recent weeks after it reported Jun '20 quarterly earnings -27% on -6% sales revenues versus the year ago period, below the +25% minimum earnings guideline, raising fundamental concerns. Completed Secondary Offerings on 7/09/20 and 5/15/20.
>>> FEATURED STOCK ARTICLE : Found Support Near 50 DMA Line But Latest Earnings Were Sub Par - 8/26/2020 |
View all notes |
Set NEW NOTE alert |
Company Profile |
SEC
News |
Chart |
Request a new note
C
A
S
I |
DT
-
NYSE
Dynatrace Inc
Computer Sftwr-Enterprse
|
$47.09
|
+2.86
6.47% |
$47.68
|
5,051,345
166.66% of 50 DAV
50 DAV is 3,031,000
|
$44.65
5.46%
|
9/1/2020
|
$46.37
|
PP = $44.75
|
|
MB = $46.99
|
Most Recent Note - 9/1/2020 5:35:47 PM
Y - Finished strong after highlighted in yellow with pivot point cited based on its 7/10/20 high plus 10 cents in the earlier mid-day report. Hit a new 52-week high with today's "breakaway gap" and volume was +67% above average behind the big gain triggering a technical buy signal. Completed yet another Secondary Offering on 6/03/20. Went through a deep consolidation and rebounded impressively since completing a Secondary Offering on 2/21/20. Reported earnings +333% on +27% sales revenues for the Jun '20 quarter versus the year ago period, its 4th consecutive strong quarterly comparison versus the year ago periods. Limited history has been noted as a concern since it completed its $16.00 IPO on 8/01/19 and a Secondary Offering on 12/06/19. See the latest FSU analysis for more details and a new annotated graph.
>>> FEATURED STOCK ARTICLE : Volume-Driven Gain for New High Triggered Technical Buy Signal - 9/1/2020 |
View all notes |
Set NEW NOTE alert |
Company Profile |
SEC
News |
Chart |
Request a new note
C
A
S
I |
|
|
|
THESE ARE NOT BUY RECOMMENDATIONS!
Comments contained in the body of this report are technical
opinions only. The material herein has been obtained
from sources believed to be reliable and accurate, however,
its accuracy and completeness cannot be guaranteed.
This site is not an investment advisor, hence it does
not endorse or recommend any securities or other investments.
Any recommendation contained in this report may not
be suitable for all investors and it is not to be deemed
an offer or solicitation on our part with respect to
the purchase or sale of any securities. All trademarks,
service marks and trade names appearing in this report
are the property of their respective owners, and are
likewise used for identification purposes only.
This report is a service available
only to active Paid Premium Members.
You may opt-out of receiving report notifications
at any time. Questions or comments may be submitted
by writing to Premium Membership Services 665 S.E. 10 Street, Suite 201 Deerfield Beach, FL 33441-5634 or by calling 1-800-965-8307
or 954-785-1121.
|
|
|