You are not logged in.
This means you
CAN ONLY VIEW reports that were published prior to Sunday, February 25, 2024.
You
MUST UPGRADE YOUR MEMBERSHIP if you want to see any current reports.
AFTER MARKET UPDATE - WEDNESDAY, AUGUST 31ST, 2022
Previous After Market Report Next After Market Report >>>
|
|
|
|
DOW |
-280.44 |
31,510.43 |
-0.88% |
|
Volume |
1,241,835,855 |
+52% |
|
Volume |
4,925,324,000 |
+7% |
|
NASDAQ |
-66.93 |
11,816.20 |
-0.56% |
|
Advancers |
915 |
30% |
|
Advancers |
1,751 |
41% |
|
S&P 500 |
-31.16 |
3,955.00 |
-0.78% |
|
Decliners |
2,089 |
70% |
|
Decliners |
2,502 |
59% |
|
Russell 2000 |
-11.48 |
1,844.12 |
-0.62% |
|
52 Wk Highs |
11 |
|
|
52 Wk Highs |
25 |
|
|
S&P 600 |
-11.81 |
1,183.98 |
-0.99% |
|
52 Wk Lows |
160 |
|
|
52 Wk Lows |
229 |
|
|
Deterioration has been noted in the market uptrend (M criteria) in recent market commentaries. A caution flag has been raised by the technical damage in the major indices coupled with a shrinking list of stocks hitting new highs.
|
 |
Market Averages Closed Month of August With Losses
Kenneth J. Gruneisen - Passed the CAN SLIM® Master's Exam
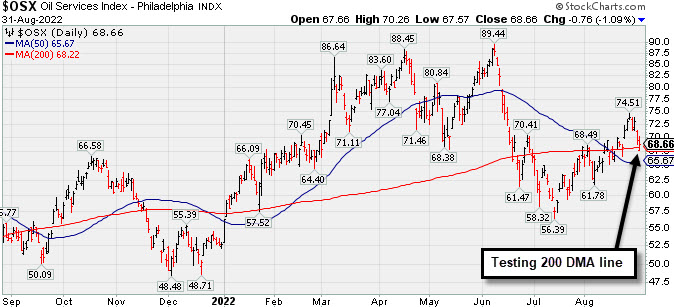
The tech-heavy Nasdaq Composite slipped 0.6%, logging its fourth monthly drop in the last five months (-2.7%). The Dow lost 280 points, bringing its August slide to 2.4%. The S&P 500 shed 0.8%, capping a four-day losing streak that marked its longest declining stretch in three weeks. The broad benchmark ended 2.5% lower in August, having fallen 8.1% from its mid-month peak. The volume totals reported were higher than the prior session on the NYSE and on the Nasdaq exchange, indicative of even greater institutional selling pressure. Breadth was clearly negative as decliners led advancers by more than a 2-1 margin on the NYSE and by 4-3 on the Nasdaq exchange. There were 0 high-ranked companies from the Leaders List that hit new 52-week highs and were listed on the BreakOuts Page, for the 2nd consecutive session. New 52-week lows totals outnumbered shrinking new 52-week highs on the NYSE and on the Nasdaq exchange. The market uptrend is now under pressure (M criteria). Any sustainable rally requires a healthy crop of leading stocks hitting new highs.
Chart courtesy of www.stockcharts.com%20on%20Tuesday.%20Yesterday,%20the%20broad%20benchmark%20eclipsed%20the%204,300%20level%20for%20the%20first%20time%20since%20late%20April.%20The%20Nasdaq%20Composite%20fell%201.3%%20amid%20weakness%20in%20mega-cap%20tech%20shares.%20The%20volume%20totals%20reported%20were%20mixed,%20lighter%20than%20the%20prior%20session%20on%20the%20NYSE%20and%20higher%20on%20the%20Nasdaq%20exchange.%20Decliners%20led%20advancers%20by%20a%204-1%20margin%20on%20the%20NYSE%20ad%20by%20a%203-1%20margin%20on%20the%20Nasdaq%20exchange.%20There%20were%2017%20high-ranked%20companies%20from%20the%20Leaders%20List%20that%20hit%20new%2052-week%20highs%20and%20were%20listed%20on%20the%20BreakOuts%20Page,%20down%20from%20the%20total%20of%2045%20on%20the%20prior%20session.%20New%2052-week%20highs%20outnumbered%20new%2052-week%20lows%20on%20the%20NYSE,%20but%20new%20lows%20outnumbered%20new%20highs%20on%20the%20Nasdaq%20exchange.%20The%20market%20is%20in%20a%20confirmed%20uptrend%20(M%20criteria).%20Any%20sustainable%20rally%20requires%20a%20healthy%20crop%20of%20leading%20stocks%20hitting%20new%20highs,%20so%20the%20recent%20improvement%20in%20leadership%20was%20a%20reassuring%20sign.) 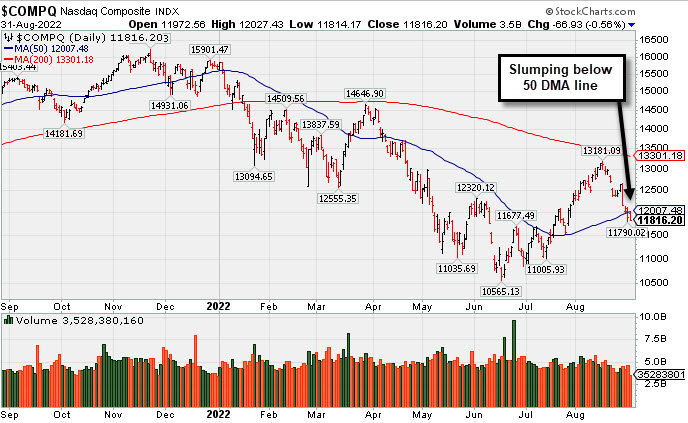 PICTURED: The Nasdaq Composite Index violated its 50-day moving average (DMA) line during a streak of 4 consecutive losses. Its rebound met resistance well below its 200 DMA line in recent weeks.
U.S. stocks finished lower on Wednesday as the major averages closed out a downbeat month. Nine of 11 S&P 500 sectors finished in negative territory for the month, with Energy and Utilities bucking the downtrend, mirroring year-to-date sector performance. Equities quickly relinquished August gains over the past few sessions as a wave of commentary from Federal Reserve (Fed) leaders reiterated policymakers’ firm stance on fighting elevated inflation with further interest rate hikes.
Longer-dated Treasuries retreated, with the yield on the 10-year note up seven basis points (0.07%) to 3.18%, recording a 0.52% monthly advance. The two-year note yield rose three basis points (0.03%) to 3.49%, its highest level since 2007. In commodities, West Texas Intermediate crude fell 2.8% to $89.04/barrel, weathering a third-straight monthly decline—its worst run since April 2020—as concerns surrounding a global growth slowdown pressured the demand outlook.
On the data front, a report from Automatic Data Processing (ADP) showed private payrolls increased by 132,000 in August, missing estimates of a 300,000 addition. This precedes Friday’s more comprehensive non-farm payrolls report from the Department of Labor. Overseas, Eurozone consumer price inflation soared at a fresh record pace in August (+9.1% year-over-year), while China’s official gauge of manufacturing activity contracted for a second month. |
 Kenneth J. Gruneisen started out as a licensed stockbroker in August 1987, a couple of months prior to the historic stock market crash that took the Dow Jones Industrial Average down -22.6% in a single day. He has published daily fact-based fundamental and technical analysis on high-ranked stocks online for two decades. Through FACTBASEDINVESTING.COM, Kenneth provides educational articles, news, market commentary, and other information regarding proven investment systems that work in good times and bad.
Comments contained in the body of this report are technical opinions only and are not necessarily those of Gruneisen Growth Corp. The material herein has been obtained from sources believed to be reliable and accurate, however, its accuracy and completeness cannot be guaranteed. Our firm, employees, and customers may effect transactions, including transactions contrary to any recommendation herein, or have positions in the securities mentioned herein or options with respect thereto. Any recommendation contained in this report may not be suitable for all investors and it is not to be deemed an offer or solicitation on our part with respect to the purchase or sale of any securities. |
|
 |
Retail, Financial, Tech, and Commodity-Linked Groups Fell
Kenneth J. Gruneisen - Passed the CAN SLIM® Master's Exam
The Retail Index ($RLX -1.32%) weighed on the major averages and the Bank Index ($BKX -0.73%) and Broker/Dealer Index ($XBD -0.37%) both suffered smaller losses. Commodity-linked groups were weaker as the Oil Services Index ($OSX -1.09%), Integrated Oil Index ($XOI -1.11%), and Gold & Silver Index ($XAU -1.56%) ended unanimously lower. The Semiconductor Index ($SOX -1.15%), Networking Index ($NWX -0.67%), and Biotech Index ($BTK -0.28%) each lost ground, rounding out a widely negative session.
PICTURED: The Oil Services Index ($OSX -1.09%) is slumping back below its 200-day moving average (DMA) line. It quickly rallied for a +31% gain from its July low to its August peak.
| Oil Services |
$OSX |
68.66 |
-0.76 |
-1.09% |
+30.24% |
| Integrated Oil |
$XOI |
1,648.43 |
-18.56 |
-1.11% |
+39.91% |
| Semiconductor |
$SOX |
2,677.39 |
-31.24 |
-1.15% |
-32.15% |
| Networking |
$NWX |
810.25 |
-5.44 |
-0.67% |
-16.56% |
| Broker/Dealer |
$XBD |
438.78 |
-1.64 |
-0.37% |
-9.87% |
| Retail |
$RLX |
3,216.57 |
-43.02 |
-1.32% |
-23.89% |
| Gold & Silver |
$XAU |
98.05 |
-1.56 |
-1.56% |
-25.97% |
| Bank |
$BKX |
105.80 |
-0.78 |
-0.73% |
-19.98% |
| Biotech |
$BTK |
4,654.20 |
-13.03 |
-0.28% |
-15.66% |
|
|
|
 |
Featured Stocks
Kenneth J. Gruneisen - Passed the CAN SLIM® Master's Exam
|
|
|
Color Codes Explained :
Y - Better candidates highlighted by our
staff of experts.
G - Previously featured
in past reports as yellow but may no longer be buyable under the
guidelines.
***Last / Change / Volume data in this table is the closing quote data***
Symbol/Exchange
Company Name
Industry Group |
PRICE |
CHANGE
(%Change) |
Day High |
Volume
(% DAV)
(% 50 day avg vol) |
52 Wk Hi
% From Hi |
Featured
Date |
Price
Featured |
Pivot Featured |
|
Max Buy |
 IMXI
-
NASDAQ
IMXI
-
NASDAQ
International Money Exp
Financial Svcs-Specialty
|
$22.40
|
-0.78
-3.36% |
$23.27
|
1,041,243
201.40% of 50 DAV
50 DAV is 517,000
|
$26.23
-14.60%
|
7/1/2022
|
$21.27
|
PP = $21.38
|
|
MB = $22.45
|
 Most Recent Note - 8/31/2022 12:40:34 PM
G - Violating its 50 DMA line ($23.19) with today's 4th consecutive loss raising concerns, technically. Testing prior highs in the $22 area. Recently reported Jun '22 quarterly earnings +21% on +17% sales revenues versus the year ago period, below the +25% minimum earnings guideline (C criteria), raising fundamental concerns.
>>> FEATURED STOCK ARTICLE : June Quarter Was Below +25% Minimum Earnings Guideline - 8/23/2022 |
View all notes |
Set NEW NOTE alert |
Company Profile |
SEC
News |
Chart |
Request a new note
C
A
S
I |
CI
-
NYSE
Cigna Corp
Medical-Managed Care
|
$283.45
|
-1.62
-0.57% |
$286.71
|
2,451,829
126.91% of 50 DAV
50 DAV is 1,932,000
|
$293.96
-3.58%
|
7/7/2022
|
$276.55
|
PP = $273.68
|
|
MB = $287.36
|
Most Recent Note - 8/31/2022 12:25:54 PM
Y - Quietly consolidating back below its "max buy" level with below average volume. Volume totals have been cooling while still hovering near its all-time high. Reported earnings for the Jun '22 quarter rose +19% on +5% sales revenues versus the year ago period, breaking a streak of 3 quarterly earnings increases above the +25% minimum guideline (C criteria), raising fundamental concerns. Near-term support to watch is at its 50 DMA line ($277).
>>> FEATURED STOCK ARTICLE : Cigna Hovering Near High Despite Earnings Under +25% Minimum - 8/26/2022 |
View all notes |
Set NEW NOTE alert |
Company Profile |
SEC
News |
Chart |
Request a new note
C
A
S
I |
AN
-
NYSE
Autonation Inc
SPECIALTY RETAIL - Auto Dealerships
|
$124.60
|
-0.95
-0.76% |
$125.73
|
594,935
90.69% of 50 DAV
50 DAV is 656,000
|
$135.57
-8.09%
|
7/20/2022
|
$122.03
|
PP = $126.49
|
|
MB = $132.81
|
Most Recent Note - 8/30/2022 5:40:32 PM
Y - Stalled after its recent breakout and sputtering near prior highs in the $126 area which were noted as initial support to watch. Faces no resistance due to overhead supply. Reported Jun '22 quarterly earnings +34% on -2% sales revenues versus the year ago period. See the latest FSU analysis for more details and a new annotated graph.
>>> FEATURED STOCK ARTICLE : Autonation Stalled After Recent Breakout - 8/30/2022 |
View all notes |
Set NEW NOTE alert |
Company Profile |
SEC
News |
Chart |
Request a new note
C
A
S
I |
ESQ
-
NASDAQ
Esquire Financial Hldgs
Finance-Commercial Loans
|
$37.38
|
-0.17
-0.45% |
$37.70
|
20,669
36.91% of 50 DAV
50 DAV is 56,000
|
$41.68
-10.32%
|
7/26/2022
|
$37.74
|
PP = $39.19
|
|
MB = $41.15
|
Most Recent Note - 8/26/2022 1:14:16 PM
Y - Volume totals have remained lighter than average volume while sputtering back and testing support near prior resistance in the $39 area. Confirming gains above the pivot point backed by at least +40% above average volume would be a reassuring sign of fresh institutional buying. Its 50 DMA line ($36.13) defines important near-term support.
>>> FEATURED STOCK ARTICLE : Closed at Session High With Gain for New All-Time High - 8/12/2022 |
View all notes |
Set NEW NOTE alert |
Company Profile |
SEC
News |
Chart |
Request a new note
C
A
S
I |
GPK
-
NYSE
Graphic Packaging Hldg
CONSUMER NON-DURABLES - Packaging and Containers
|
$22.27
|
-0.36
-1.59% |
$22.90
|
2,168,834
73.27% of 50 DAV
50 DAV is 2,960,000
|
$23.71
-6.07%
|
7/26/2022
|
$22.63
|
PP = $23.09
|
|
MB = $24.24
|
Most Recent Note - 8/29/2022 5:39:26 PM
Y - Still holding its ground but it has made no real progress since its 8/10/22 breakout. Its 50 DMA line ($21.73) defines near-term support.
>>> FEATURED STOCK ARTICLE : Churned Heavy Volume Perched at High After 6 Straight Gains - 8/15/2022 |
View all notes |
Set NEW NOTE alert |
Company Profile |
SEC
News |
Chart |
Request a new note
C
A
S
I |
Symbol/Exchange
Company Name
Industry Group |
PRICE |
CHANGE
(%Change) |
Day High |
Volume
(% DAV)
(% 50 day avg vol) |
52 Wk Hi
% From Hi |
Featured
Date |
Price
Featured |
Pivot Featured |
|
Max Buy |
CSL
-
NYSE
Carlisle Cos Inc
Diversified Operations
|
$295.66
|
+0.25
0.08% |
$298.83
|
3,164,374
769.92% of 50 DAV
50 DAV is 411,000
|
$318.71
-7.23%
|
7/28/2022
|
$282.31
|
PP = $275.23
|
|
MB = $288.99
|
Most Recent Note - 8/31/2022 12:30:38 PM
G - Holding its ground today following 3 consecutive losses. It remains extended from the previously noted base. Its 50 DMA line ($277.67) and prior highs in the $275 area define important near-term support to watch.
>>> FEATURED STOCK ARTICLE : Pulling Back From All-Time High After Volume-Driven Gains - 8/22/2022 |
View all notes |
Set NEW NOTE alert |
Company Profile |
SEC
News |
Chart |
Request a new note
C
A
S
I |
ENPH
-
NASDAQ
Enphase Energy Inc
Energy-Solar
|
$286.44
|
+0.67
0.23% |
$293.80
|
2,711,308
81.67% of 50 DAV
50 DAV is 3,320,000
|
$308.88
-7.26%
|
7/28/2022
|
$276.66
|
PP = $282.55
|
|
MB = $296.68
|
Most Recent Note - 8/26/2022 1:09:36 PM
Y - Pulling back today with light volume. Volume totals cooled while hovering near its all-time high in recent weeks. The prior high in the $282 area has been noted as initial support to watch above its 50 DMA line ($241). Fundamentals remain strong.
>>> FEATURED STOCK ARTICLE : Enphase Energy Consolidating After Rallying to New Highs - 8/19/2022 |
View all notes |
Set NEW NOTE alert |
Company Profile |
SEC
News |
Chart |
Request a new note
C
A
S
I |
PWR
-
NYSE
Quanta Services Inc
MATERIALS and CONSTRUCTION - General Contractors
|
$141.30
|
+0.54
0.38% |
$142.06
|
1,412,271
128.04% of 50 DAV
50 DAV is 1,103,000
|
$149.33
-5.38%
|
7/28/2022
|
$141.83
|
PP = $140.14
|
|
MB = $147.15
|
Most Recent Note - 8/30/2022 5:20:27 PM
Y - Pulled back today with light volume. Volume totals have been below average while recently wedging back above its pivot point since encountering some distributional pressure. Confirming volume-driven gains for new highs would be a reassuring sign of serious institutional buying demand. Its 50 DMA line ($134.26) defines important near-term support to watch. Fundamentals remain strong.
>>> FEATURED STOCK ARTICLE : Stalled After Breakout But Still Quietly Hovering Near High - 8/16/2022 |
View all notes |
Set NEW NOTE alert |
Company Profile |
SEC
News |
Chart |
Request a new note
C
A
S
I |
CLFD
-
NASDAQ
Clearfield Inc
TELECOMMUNICATIONS - Cables / Satalite Equipment
|
$116.11
|
-2.57
-2.17% |
$121.62
|
323,756
93.84% of 50 DAV
50 DAV is 345,000
|
$130.01
-10.69%
|
7/29/2022
|
$94.10
|
PP = $86.81
|
|
MB = $91.15
|
Most Recent Note - 8/31/2022 6:24:50 PM
G - Pulled back from its all-time high with today's 5th consecutive loss backed by near average volume. Still very extended from any sound base. Its 50 DMA line ($92.33) and prior high in the $86 area define important support to watch. Fundamentals remain strong.
>>> FEATURED STOCK ARTICLE : Clearfield Showed Resilience After Considerable Rally - 8/17/2022 |
View all notes |
Set NEW NOTE alert |
Company Profile |
SEC
News |
Chart |
Request a new note
C
A
S
I |
GFF
-
NYSE
Griffon Corporation
MATERIALS and CONSTRUCTION - General Building Materials
|
$31.35
|
-0.97
-3.00% |
$32.21
|
360,150
81.30% of 50 DAV
50 DAV is 443,000
|
$34.35
-8.73%
|
8/8/2022
|
$32.46
|
PP = $31.12
|
|
MB = $32.68
|
Most Recent Note - 8/31/2022 6:20:30 PM
Y - Color code is changed to yellow after pulling back below its "max buy" level with below average volume behind recent losses. Prior highs in the $31 area define initial support to watch above its 50 DMA line ($29.16).
>>> FEATURED STOCK ARTICLE : Best Ever Close With Gain on Lighter Volume - 8/25/2022 |
View all notes |
Set NEW NOTE alert |
Company Profile |
SEC
News |
Chart |
Request a new note
C
A
S
I |
Symbol/Exchange
Company Name
Industry Group |
PRICE |
CHANGE
(%Change) |
Day High |
Volume
(% DAV)
(% 50 day avg vol) |
52 Wk Hi
% From Hi |
Featured
Date |
Price
Featured |
Pivot Featured |
|
Max Buy |
CLH
-
NYSE
Clean Harbors Inc
Pollution Control
|
$117.42
|
-0.31
-0.26% |
$118.89
|
283,245
90.21% of 50 DAV
50 DAV is 314,000
|
$124.33
-5.56%
|
8/10/2022
|
$111.78
|
PP = $115.10
|
|
MB = $120.86
|
Most Recent Note - 8/29/2022 5:34:29 PM
Y - Color code is changed to yellow while consolidating below its "max buy" level. Previously noted gain and strong close above the pivot point backed by +116% above average volume on 8/12/22 triggered a technical buy signal. No resistance remains due to overhead supply. Fundamentals remain strong. Prior high in the $115 area defines important near-term support to watch on pullbacks. See latest FSU analysis for more details and a new annotated graph.
>>> FEATURED STOCK ARTICLE : Quietly Consolidating Below "Max Buy" Level After Breakout - 8/29/2022 |
View all notes |
Set NEW NOTE alert |
Company Profile |
SEC
News |
Chart |
Request a new note
C
A
S
I |
SNPS
-
NASDAQ
Synopsys Inc
COMPUTER SOFTWARE and SERVICES - Technical and System Software
|
$346.02
|
+0.02
0.01% |
$353.30
|
1,653,046
175.30% of 50 DAV
50 DAV is 943,000
|
$391.17
-11.54%
|
8/17/2022
|
$381.37
|
PP = $377.70
|
|
MB = $396.59
|
Most Recent Note - 8/31/2022 12:50:29 PM
G - Holding its ground today after testing its 50 DMA line ($342) with a spurt of losses. More damaging losses would raise greater concerns. Encountered distributional pressure while retreating from its all-time high in recent weeks. Reported Jul '22 quarterly earnings +16% on +18% sales revenues versus the year ago period, below the +25% minimum earnings guideline (C criteria), raising fundamental concerns. Renewed strength and subsequent gains above the pivot point backed by at least +40% above average volume are needed to clinch a technical buy signal.
>>> FEATURED STOCK ARTICLE : Earnings Report Below +25% Minimum and Encountering Distributional Pressure - 8/18/2022 |
View all notes |
Set NEW NOTE alert |
Company Profile |
SEC
News |
Chart |
Request a new note
C
A
S
I |
|
|
|
THESE ARE NOT BUY RECOMMENDATIONS!
Comments contained in the body of this report are technical
opinions only. The material herein has been obtained
from sources believed to be reliable and accurate, however,
its accuracy and completeness cannot be guaranteed.
This site is not an investment advisor, hence it does
not endorse or recommend any securities or other investments.
Any recommendation contained in this report may not
be suitable for all investors and it is not to be deemed
an offer or solicitation on our part with respect to
the purchase or sale of any securities. All trademarks,
service marks and trade names appearing in this report
are the property of their respective owners, and are
likewise used for identification purposes only.
This report is a service available
only to active Paid Premium Members.
You may opt-out of receiving report notifications
at any time. Questions or comments may be submitted
by writing to Premium Membership Services 665 S.E. 10 Street, Suite 201 Deerfield Beach, FL 33441-5634 or by calling 1-800-965-8307
or 954-785-1121.
|
|
|