You are not logged in.
This means you
CAN ONLY VIEW reports that were published prior to Friday, February 16, 2024.
You
MUST UPGRADE YOUR MEMBERSHIP if you want to see any current reports.
AFTER MARKET UPDATE - FRIDAY, AUGUST 30TH, 2019
Previous After Market Report Next After Market Report >>>
|
|
|
|
DOW |
+41.03 |
26,403.28 |
+0.16% |
|
Volume |
863,654,260 |
+21% |
|
Volume |
1,641,969,368 |
-3% |
|
NASDAQ |
-10.51 |
7,962.88 |
-0.13% |
|
Advancers |
1,579 |
57% |
|
Advancers |
1,579 |
52% |
|
S&P 500 |
+1.88 |
2,926.46 |
+0.06% |
|
Decliners |
1,198 |
43% |
|
Decliners |
1,467 |
48% |
|
Russell 2000 |
-1.88 |
1,494.84 |
-0.13% |
|
52 Wk Highs |
156 |
|
|
52 Wk Highs |
49 |
|
|
S&P 600 |
-1.30 |
918.74 |
-0.14% |
|
52 Wk Lows |
39 |
|
|
52 Wk Lows |
60 |
|
|
 |
Indices Quiet Ahead of Memorial Day Weekend
Kenneth J. Gruneisen - Passed the CAN SLIM® Master's Exam
For the week, the S&P advanced 2.8%, the Dow climbed 3%, and the Nasdaq Composite rallied 2.7%. For the month, the S&P 500 declined 1.8%, the Dow dropped 1.7%, and the Nasdaq Composite fell 2.6%. The S&P 500 rose less than 0.1% Friday, with trading volume roughly 30% below average ahead of the long weekend. The Dow added 41 points, while the Nasdaq Composite was down 0.1%. Volume totals reported were mixed, higher than the prior session total on the NYSE and lighter on the Nasdaq exchange. Breadth was positive as advancers led decliners by a 4-3 margin on the NYSE and advancers led decliners by a narrow margin on the Nasdaq exchange. There were 39 high-ranked companies from the Leaders List hit new 52-week highs and were listed on the BreakOuts Page, versus the total of 44 on the prior session. New 52-week highs outnumbered new 52-week lows on the NYSE, but new lows still outnumbered new highs on the Nasdaq exchange. A follow-through day on 8/13/19 marked a bullish shift concerning the M criteria of the fact-based investment system, but the market faced immediate pressure. Investors have a green light to make carefully selected new buying efforts, however, subsequent losses below prior low for the Nasdaq Composite Index would technically kill the new rally. The Featured Stocks Page provides the most timely analysis on high-ranked leaders. Charts used courtesy of www.stockcharts.com
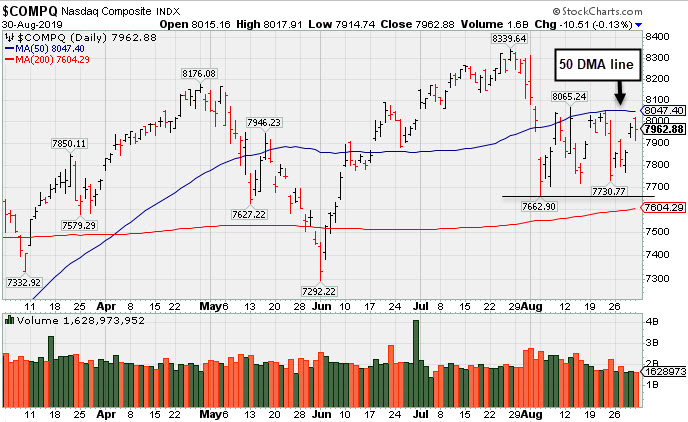
PICTURED: The Nasdaq Composite Index's recent low defines important support along with its 200-day moving average (DMA) line. More damaging losses would raise concerns and prompt investors to reduce their exposure to stocks.
Stocks finished mixed Friday as investors assessed trade headlines and economic updates. Although the week was filled with mostly positive trade rhetoric, fresh U.S. tariffs on Chinese goods are set to take effect Sunday. The major averages snapped a four-week losing streak, though still tallying the largest monthly decline since May.
On the data front, personal spending jumped 0.6% in July, while personal income edged up 0.1%. Separately, the final University of Michigan survey for August showed consumer sentiment dropping the most since December 2012. Additionally, the core PCE deflator, the Fed’s preferred proxy for inflation, showed an annualized gain of 1.6% in July, matching the prior reading. Treasuries finished little changed Friday, with the yield on the 10-year note steady at 1.50%. The benchmark yield shed more than 0.50% in August, its biggest slide since 2015. In commodities, WTI crude lost 2.8% to $55.10/barrel, capping a monthly decline of more than 6%.
In earnings, Ulta Beauty (ULTA -29.55%) gapped down after missing analyst profit estimates and lowering forward guidance. In other earnings, Campbell Soup (CPB +3.90%) rose after delivering an earnings beat. Dell Technologies (DELL +10.18%) rose following its positive quarterly results.
|
 Kenneth J. Gruneisen started out as a licensed stockbroker in August 1987, a couple of months prior to the historic stock market crash that took the Dow Jones Industrial Average down -22.6% in a single day. He has published daily fact-based fundamental and technical analysis on high-ranked stocks online for two decades. Through FACTBASEDINVESTING.COM, Kenneth provides educational articles, news, market commentary, and other information regarding proven investment systems that work in good times and bad.
Comments contained in the body of this report are technical opinions only and are not necessarily those of Gruneisen Growth Corp. The material herein has been obtained from sources believed to be reliable and accurate, however, its accuracy and completeness cannot be guaranteed. Our firm, employees, and customers may effect transactions, including transactions contrary to any recommendation herein, or have positions in the securities mentioned herein or options with respect thereto. Any recommendation contained in this report may not be suitable for all investors and it is not to be deemed an offer or solicitation on our part with respect to the purchase or sale of any securities. |
|
 |
Financials and Semiconductor Index Rose
Kenneth J. Gruneisen - Passed the CAN SLIM® Master's Exam
The Bank Index ($BKX +0.54%) and the Broker/Dealer Index ($XBD +0.83%) both notched gains on Friday. The Retail Index ($RLX -0.63%) created a drag on the major indices. The tech sector was mixed as the Semiconductor Index ($SOX +0.61%) rose, but the Networking Index ($NWX -0.11%) and the Biotech Index ($BTK -0.66%) both lost ground. Energy-linked groups were mixed and little changed as the Integrated Oil Index ($XOI +0.18%) inched higher and the Oil Services Index ($OSX -0.27%) edged lower. The Gold & Silver Index ($XAU 0.52%) posted a small gain.
Charts courtesy of www.stockcharts.com
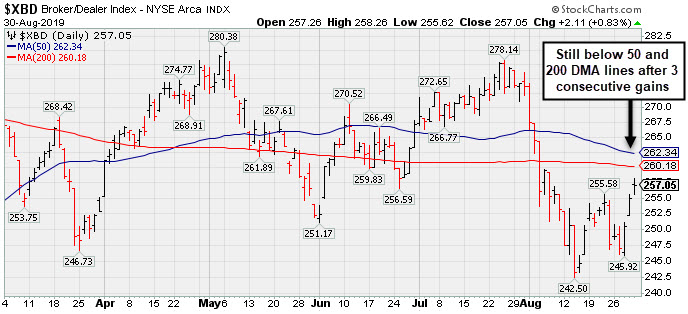
PICTURED: The Broker/Dealer Index ($XBD +0.83%) posted a 3rd consecutive gain while rebounding from recent low. It remains below its 50-day and 200-day moving average (DMA) lines, in weak technical shape. Rebounding above those lines would be a reassuring sign, but more damaging losses would raise serious concerns for the broader market outlook.
| Oil Services |
$OSX |
62.88 |
-0.17 |
-0.27% |
-21.99% |
| Integrated Oil |
$XOI |
1,165.72 |
+2.05 |
+0.18% |
+0.57% |
| Semiconductor |
$SOX |
1,504.92 |
+9.10 |
+0.61% |
+30.28% |
| Networking |
$NWX |
549.54 |
-0.61 |
-0.11% |
+12.46% |
| Broker/Dealer |
$XBD |
257.05 |
+2.11 |
+0.83% |
+8.30% |
| Retail |
$RLX |
2,345.69 |
-14.96 |
-0.63% |
+20.20% |
| Gold & Silver |
$XAU |
98.98 |
+0.51 |
+0.52% |
+40.08% |
| Bank |
$BKX |
93.09 |
+0.50 |
+0.54% |
+8.51% |
| Biotech |
$BTK |
4,386.95 |
-28.74 |
-0.65% |
+3.94% |
|
|
|
 |
Volume Cooling While Consolidating Above Support Levels
Kenneth J. Gruneisen - Passed the CAN SLIM® Master's Exam
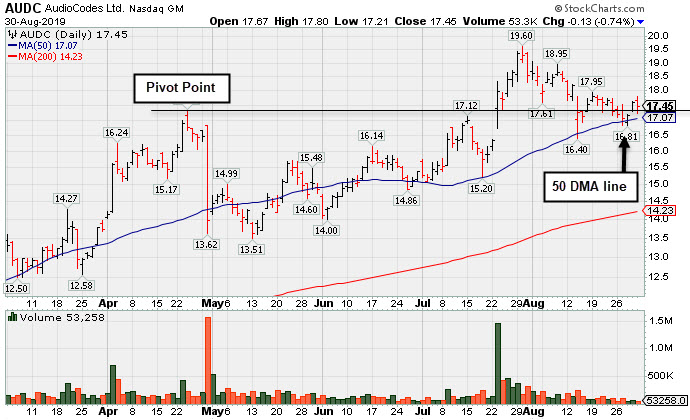
Audiocodes Ltd (AUDC -$0.13 or -0.74% to $17.45) has seen its volume totals cooling while consolidating near important support defined by prior highs in the $17 area and its 50-day moving average (DMA) line ($17.16). More damaging losses would raise concerns and trigger technical sell signals.
Bullish action came after it reported earnings +57% on +14% sales revenues for the Jun '19 quarter, continuing its strong earnings track record for a 10th consecutive quarterly comparison above the +25% minimum guideline (C criteria). Annual earnings growth has been strong and it has a 99 Earnings Per Share Rating.
AUDC was highlighted in yellow with new pivot point cited based on its 4/24/19 high plus 10 cents in the 7/15/19 mid-day report (read here). This Israel-based designer of advanced voice-over-IP products shown in this FSU section on 8/13/19 with an annotated graph under the headline, "Volume Totals Cooling as Bullish Action Continues".
The number of top-rated funds owning its shares rose from 33 in Mar '18 to 73 in Jun '19, a reassuring sign concerning the I criteria. Its current Up/Down Volume Ratio of 1.4 is an unbiased indication its shares have been under accumulation over the past 50 days. It has a Timeliness Rating of B and Sponsorship Rating of B. The small supply of 22.8 million shares (S criteria) in the public float can contribute to greater price volatility in the event of institutional buying or selling.
Charts courtesy of www.stockcharts.com
|
|
|
Color Codes Explained :
Y - Better candidates highlighted by our
staff of experts.
G - Previously featured
in past reports as yellow but may no longer be buyable under the
guidelines.
***Last / Change / Volume data in this table is the closing quote data***
Symbol/Exchange
Company Name
Industry Group |
PRICE |
CHANGE
(%Change) |
Day High |
Volume
(% DAV)
(% 50 day avg vol) |
52 Wk Hi
% From Hi |
Featured
Date |
Price
Featured |
Pivot Featured |
|
Max Buy |
 EPAM
-
NYSE
EPAM
-
NYSE
Epam Systems Inc
COMPUTER SOFTWARE and SERVICES - Information Technology Service
|
$191.33
|
-0.65
-0.34% |
$194.53
|
138,450
34.19% of 50 DAV
50 DAV is 405,000
|
$201.00
-4.81%
|
5/9/2019
|
$169.25
|
PP = $180.55
|
|
MB = $189.58
|
Most Recent Note - 8/29/2019 5:34:49 PM
G - Quietly consolidating above its 50 DMA line ($187.33). It has not formed a new base of sufficient length and faces some resistance due to overhead supply up to the $201 level. Reported earnings +27% on +24% sales revenues for the Jun '19 quarter. See the latest FSU analysis for more details and a new annotated graph.
>>> FEATURED STOCK ARTICLE : Volume Light During Brief Consolidation Above 50-Day Average - 8/29/2019 |
View all notes |
Set NEW NOTE alert |
Company Profile |
SEC
News |
Chart |
Request a new note
C
A
S
I |
AUDC
-
NASDAQ
Audiocodes Ltd
ELECTRONICS - Scientific and Technical Instrum
|
$17.45
|
-0.13
-0.74% |
$17.80
|
53,255
30.96% of 50 DAV
50 DAV is 172,000
|
$19.74
-11.60%
|
7/15/2019
|
$17.10
|
PP = $17.54
|
|
MB = $18.42
|
 Most Recent Note - 8/30/2019 4:59:14 PM
Y - Volume totals have been cooling while consolidating near important support defined by prior highs in the $17 area and its 50 DMA line ($17.16). More damaging losses would raise concerns and trigger technical sell signals. Reported earnings +57% on +14% sales revenues for the Jun '19 quarter, continuing its strong earnings track record. See the latest FSU analysis for more details and a new annotated graph.
>>> FEATURED STOCK ARTICLE : Volume Cooling While Consolidating Above Support Levels - 8/30/2019 |
View all notes |
Set NEW NOTE alert |
Company Profile |
SEC
News |
Chart |
Request a new note
C
A
S
I |
LHCG
-
NASDAQ
L H C Group Inc
HEALTH SERVICES - Home Health Care
|
$118.50
|
-1.91
-1.59% |
$121.48
|
163,421
71.99% of 50 DAV
50 DAV is 227,000
|
$129.37
-8.40%
|
7/1/2019
|
$110.94
|
PP = $122.20
|
|
MB = $128.31
|
Most Recent Note - 8/30/2019 4:53:45 PM
G - Still quietly sputtering just below its 50 DMA line ($121.07) which has acted as resistance. Any breach of recent low ($116.67 on 8/13/19) could raise more serious concerns.
>>> FEATURED STOCK ARTICLE : Sputtering Below 50-Day Average and Below Pivot Point - 8/20/2019 |
View all notes |
Set NEW NOTE alert |
Company Profile |
SEC
News |
Chart |
Request a new note
C
A
S
I |
CHDN
-
NASDAQ
Churchill Downs Inc
LEISURE - Gaming Activities
|
$123.26
|
-1.81
-1.45% |
$126.58
|
155,397
66.13% of 50 DAV
50 DAV is 235,000
|
$132.73
-7.13%
|
7/22/2019
|
$118.45
|
PP = $118.89
|
|
MB = $124.83
|
Most Recent Note - 8/30/2019 4:52:31 PM
Y - Quietly hovering near its all-time high. Recently found support near its 50 DMA line ($118.61). The prior low ($113.88 on 8/05/19) defines the next important near-term support to watch. Reported Jun '19 earnings rose +10% on +26% sales revenues versus the year ago period, below the +25% minimum earnings guideline (C criteria).
>>> FEATURED STOCK ARTICLE : Recently Found Support at 50-Day Moving Average - 8/14/2019 |
View all notes |
Set NEW NOTE alert |
Company Profile |
SEC
News |
Chart |
Request a new note
C
A
S
I |
LULU
-
NASDAQ
Lululemon Athletica
MANUFACTURING - Textile Manufacturing
|
$184.67
|
-1.39
-0.75% |
$187.74
|
1,212,076
79.48% of 50 DAV
50 DAV is 1,525,000
|
$194.25
-4.93%
|
6/13/2019
|
$174.48
|
PP = $179.60
|
|
MB = $188.58
|
Most Recent Note - 8/29/2019 5:55:42 PM
G - Rebounded above the 50 DMA line ($183.77) helping its technical stance improve. Faces near-term resistance up to the $194 level. Due to report earnings news on 9/05/19. Volume and volatility often increase near earnings news.
>>> FEATURED STOCK ARTICLE : Sputtering After Slump Below 50-Day Moving Average - 8/15/2019 |
View all notes |
Set NEW NOTE alert |
Company Profile |
SEC
News |
Chart |
Request a new note
C
A
S
I |
Symbol/Exchange
Company Name
Industry Group |
PRICE |
CHANGE
(%Change) |
Day High |
Volume
(% DAV)
(% 50 day avg vol) |
52 Wk Hi
% From Hi |
Featured
Date |
Price
Featured |
Pivot Featured |
|
Max Buy |
ULTA
-
NASDAQ
Ulta Beauty Inc
SPECIALTY RETAIL - Specialty Retail, Other
|
$237.73
|
-99.72
-29.55% |
$254.50
|
16,017,879
2,096.58% of 50 DAV
50 DAV is 764,000
|
$368.83
-35.54%
|
3/15/2019
|
$341.27
|
PP = $322.59
|
|
MB = $338.72
|
Most Recent Note - 8/30/2019 2:08:43 PM
G - Gapped down today after reporting earnings +11% on +12% sales revenues for the Jul '19 quarter, violating its 200 DMA line ($320) and prior low triggering a worrisome technical sell signal. That marked its 2nd consecutive quarterly comparison below the +25% minimum earnings guideline (C criteria) and raised fundamental concerns. See the latest FSU analysis for more details and an annotated graph.
>>> FEATURED STOCK ARTICLE : Slumped Near 200-Day Average Ahead of Earnings Report - 8/28/2019 |
View all notes |
Set NEW NOTE alert |
Company Profile |
SEC
News |
Chart |
Request a new note
C
A
S
I |
CHGG
-
NYSE
Chegg Inc
Consumer Svcs-Education
|
$39.64
|
-0.81
-2.00% |
$40.33
|
2,258,103
142.20% of 50 DAV
50 DAV is 1,588,000
|
$48.22
-17.79%
|
7/8/2019
|
$44.11
|
PP = $41.79
|
|
MB = $43.88
|
Most Recent Note - 8/30/2019 4:57:55 PM
G - Slumped further below its 50 DMA line ($41.81) with above average volume behind today's loss. A rebound above the 50 DMA line is needed for its outlook to improve. Fundamentals remain strong.
>>> FEATURED STOCK ARTICLE : Sputtering Below 50-Day Average Line in Recent Weeks - 8/27/2019 |
View all notes |
Set NEW NOTE alert |
Company Profile |
SEC
News |
Chart |
Request a new note
C
A
S
I |
VEEV
-
NYSE
Veeva Systems Inc Cl A
Computer Sftwr-Medical
|
$160.38
|
-8.24
-4.89% |
$170.35
|
2,048,357
141.07% of 50 DAV
50 DAV is 1,452,000
|
$176.90
-9.34%
|
5/30/2019
|
$154.32
|
PP = $145.80
|
|
MB = $153.09
|
Most Recent Note - 8/30/2019
G - Sputtering below its 50 DMA line ($164.66). A convincing rebound is needed for its outlook to improve. The 50 DMA line has acted as resistance. Reported earnings +41% on +27% for the Jul '19 quarter continuing its strong earnings track record.
>>> FEATURED STOCK ARTICLE : Met Resistance After Slumping Below 50-Day Moving Average - 8/23/2019 |
View all notes |
Set NEW NOTE alert |
Company Profile |
SEC
News |
Chart |
Request a new note
C
A
S
I |
PAYC
-
NYSE
Paycom Software Inc
COMPUTER SOFTWARE and SERVICES - Application Software
|
$250.12
|
-3.98
-1.57% |
$255.98
|
369,525
60.38% of 50 DAV
50 DAV is 612,000
|
$259.71
-3.69%
|
8/20/2019
|
$246.97
|
PP = $246.95
|
|
MB = $259.30
|
Most Recent Note - 8/30/2019 4:55:28 PM
Y - Volume totals have been cooling while hovering near its all-time high. Color code was changed to yellow with new pivot point cited based on its 7/11/19 high plus 10 cents. Gains above a stock's pivot must have at least +40% above average volume to trigger a proper new (or add-on) technical buy signal. Its 50 DMA line ($237) defines support above the recent low ($216.55 on 8/05/19). Fundamentals remain strong.
>>> FEATURED STOCK ARTICLE : Recently Wedged Higher Without Great Volume Conviction - 8/26/2019 |
View all notes |
Set NEW NOTE alert |
Company Profile |
SEC
News |
Chart |
Request a new note
C
A
S
I |
BLD
-
NYSE
Topbuild Corp
Bldg-Constr Prds/Misc
|
$92.62
|
+1.11
1.21% |
$92.88
|
125,363
41.79% of 50 DAV
50 DAV is 300,000
|
$93.59
-1.04%
|
5/17/2019
|
$82.19
|
PP = $87.31
|
|
MB = $91.68
|
Most Recent Note - 8/29/2019 5:58:41 PM
G - Perched near its all-time high. Stubbornly held its ground following bullish action after it reported earnings +39% on +9% sales revenues for the Jun '19 quarter versus the year ago period, continuing its strong earnings track record. Prior highs in the $86 area define initial support to watch above 50 DMA line ($84.75) on pullbacks.
>>> FEATURED STOCK ARTICLE : Topbuild Has 4 Consecutive Weekly Gains and Stubbornly Held Ground - 8/19/2019 |
View all notes |
Set NEW NOTE alert |
Company Profile |
SEC
News |
Chart |
Request a new note
C
A
S
I |
Symbol/Exchange
Company Name
Industry Group |
PRICE |
CHANGE
(%Change) |
Day High |
Volume
(% DAV)
(% 50 day avg vol) |
52 Wk Hi
% From Hi |
Featured
Date |
Price
Featured |
Pivot Featured |
|
Max Buy |
TEAM
-
NASDAQ
Atlassian Corp Plc Cl A
Comp Sftwr-Spec Enterprs
|
$134.51
|
-3.54
-2.56% |
$139.18
|
1,738,052
139.71% of 50 DAV
50 DAV is 1,244,000
|
$149.80
-10.21%
|
8/27/2019
|
$142.62
|
PP = $149.90
|
|
MB = $157.40
|
Most Recent Note - 8/30/2019 1:28:37 PM
G - Color code is changed to green after violating its 50 DMA line with today's 4th consecutive loss Formed a 5-week flat base with new pivot point cited based on its 7/26/19 high plus 10 cents. Prior low ($130.78 on 7/23/19) defines the next important near-term support to watch where a violation would raise serious concerns and trigger a more worrisome technical sell signal. Reported earnings +43% on +36% sales revenues for the Jun '19 quarter, continuing its strong earnings track record.
>>> FEATURED STOCK ARTICLE : Consolidating Near High After Recently Finding Support - 8/21/2019 |
View all notes |
Set NEW NOTE alert |
Company Profile |
SEC
News |
Chart |
Request a new note
C
A
S
I |
TTD
-
NASDAQ
The Trade Desk Inc Cl A
Comml Svcs-Advertising
|
$245.77
|
-4.30
-1.72% |
$252.46
|
795,368
54.97% of 50 DAV
50 DAV is 1,447,000
|
$289.51
-15.11%
|
7/18/2019
|
$240.61
|
PP = $258.10
|
|
MB = $271.01
|
Most Recent Note - 8/29/2019 6:00:03 PM
G - Quietly consolidating near its 50 DMA line ($248). The recent low ($239.01 on 8/21/19) defines important near-term support to watch. Violations would raise concerns and trigger technical sell signals. Reported Jun '19 quarterly earnings +58% on +42% sales revenues.
>>> FEATURED STOCK ARTICLE : Consolidating Near 50-Day Moving Average Line - 8/16/2019 |
View all notes |
Set NEW NOTE alert |
Company Profile |
SEC
News |
Chart |
Request a new note
C
A
S
I |
PAGS
-
NYSE
Pagseguro Digital Cl A
Finance-CrdtCard/PmtPr
|
$49.96
|
-0.32
-0.64% |
$50.42
|
967,292
42.84% of 50 DAV
50 DAV is 2,258,000
|
$53.43
-6.49%
|
6/25/2019
|
$37.69
|
PP = $40.07
|
|
MB = $42.07
|
Most Recent Note - 8/29/2019 5:57:16 PM
G - Volume totals have been cooling while hovering near its all-time high. Its 50 DMA line ($44.73) and the recent low ($42.00 on 8/05/19) define important levels to watch on pullbacks. Reported earnings +35% on +39% sales revenues for the quarter ended June 30,2019 versus the year ago period.
>>> FEATURED STOCK ARTICLE : Brazil-Based Digital Payments Firm Perched at All-Time High - 8/22/2019 |
View all notes |
Set NEW NOTE alert |
Company Profile |
SEC
News |
Chart |
Request a new note
C
A
S
I |
|
|
|
THESE ARE NOT BUY RECOMMENDATIONS!
Comments contained in the body of this report are technical
opinions only. The material herein has been obtained
from sources believed to be reliable and accurate, however,
its accuracy and completeness cannot be guaranteed.
This site is not an investment advisor, hence it does
not endorse or recommend any securities or other investments.
Any recommendation contained in this report may not
be suitable for all investors and it is not to be deemed
an offer or solicitation on our part with respect to
the purchase or sale of any securities. All trademarks,
service marks and trade names appearing in this report
are the property of their respective owners, and are
likewise used for identification purposes only.
This report is a service available
only to active Paid Premium Members.
You may opt-out of receiving report notifications
at any time. Questions or comments may be submitted
by writing to Premium Membership Services 665 S.E. 10 Street, Suite 201 Deerfield Beach, FL 33441-5634 or by calling 1-800-965-8307
or 954-785-1121.
|
|
|

