You are not logged in.
This means you
CAN ONLY VIEW reports that were published prior to Monday, February 19, 2024.
You
MUST UPGRADE YOUR MEMBERSHIP if you want to see any current reports.
AFTER MARKET UPDATE - THURSDAY, AUGUST 27TH, 2020
Previous After Market Report Next After Market Report >>>
|
|
|
|
DOW |
+160.35 |
28,492.27 |
+0.57% |
|
Volume |
777,885,589 |
+4% |
|
Volume |
3,520,488,800 |
+3% |
|
NASDAQ |
-39.72 |
11,625.34 |
-0.34% |
|
Advancers |
1,648 |
56% |
|
Advancers |
1,557 |
47% |
|
S&P 500 |
+5.82 |
3,484.55 |
+0.17% |
|
Decliners |
1,287 |
44% |
|
Decliners |
1,761 |
53% |
|
Russell 2000 |
+4.37 |
1,564.56 |
+0.28% |
|
52 Wk Highs |
101 |
|
|
52 Wk Highs |
142 |
|
|
S&P 600 |
+3.08 |
905.46 |
+0.34% |
|
52 Wk Lows |
12 |
|
|
52 Wk Lows |
31 |
|
|
 |
Major Indices Were Mixed With Less Leadership
Kenneth J. Gruneisen - Passed the CAN SLIM® Master's Exam
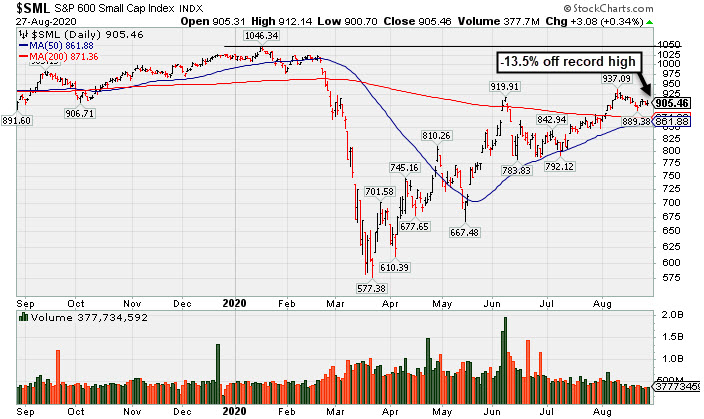
The Dow advanced 160 points, and now sits within 0.2% from erasing its year-to-date losses. The S&P 500 gained 0.2%, while the Nasdaq Composite reversed early session gains to end 0.3% lower. The reported volume totals were higher than the prior session totals on the NYSE and on the Nasdaq exchange. Breadth was mixed as advancers led decliners by a 4-3 margin on the NYSE but decliners led advancers by a narrow 9-8 margin on the Nasdaq exchange. Leadership contracted as there were 45 high-ranked companies from the Leaders List that hit new 52-week highs and were listed on the BreakOuts Page, versus the total of 62 on the prior session. New 52-week highs totals still easily outnumbered new 52-week lows totals on both the NYSE and Nasdaq exchange. The major indices are in a confirmed uptrend (M criteria). Any sustainable rally requires a healthy crop of new leaders, so it remains ever-important to see substantial new highs totals.
Charts used courtesy of www.stockcharts.com
PICTURED: The S&P 600 Small Cap Index is consolidating -13.5% off its record high hit in January.
The Stocks finished mixed on Thursday, with the S&P 500 notching its fifth consecutive record level. Federal Reserve Chair Jerome Powell’s perceived dovish remarks during the virtual Jackson Hole symposium was in focus. His speech shed light on the central bank’s policy framework review, with the Fed chief explaining that policymakers would tolerate higher inflation to support the labor market, potentially resulting in a “lower-for-longer” rate environment.
On the data front, initial jobless claims tallied 1 million in the week ended August 22. The revised print of second-quarter GDP showed the contraction in the U.S. economy eased modestly to a 31.7% annualized pace in the April-June period from the originally-reported 32.9% decline. Separately, pending home sales rose 5.9% in July to the highest level since 2005. The Treasury yield curve steepened, with the yield on the 10-year note up five basis points to 0.74% and the 30-year bond rate jumping nine basis points to 1.50%. In commodities, WTI crude slipped 0.9% to $43.00/barrel, while COMEX gold lost 1% to $1,921.60/ounce.
Eight of 11 S&P 500 sectors finished in positive territory. The Financials group paced the gains with JP Morgan Chase & Co (JPM +3.29%) rising. In earnings, Dollar Tree (DLTR -7.21%) slid despite delivering a top and bottom line beat. In other corporate news, Abbott Laboratories (ABT +7.85%) rallied after gaining the Food and Drug Administration’s (FDA) approval for a portable 15-minute coronavirus test.
|
 Kenneth J. Gruneisen started out as a licensed stockbroker in August 1987, a couple of months prior to the historic stock market crash that took the Dow Jones Industrial Average down -22.6% in a single day. He has published daily fact-based fundamental and technical analysis on high-ranked stocks online for two decades. Through FACTBASEDINVESTING.COM, Kenneth provides educational articles, news, market commentary, and other information regarding proven investment systems that work in good times and bad.
Comments contained in the body of this report are technical opinions only and are not necessarily those of Gruneisen Growth Corp. The material herein has been obtained from sources believed to be reliable and accurate, however, its accuracy and completeness cannot be guaranteed. Our firm, employees, and customers may effect transactions, including transactions contrary to any recommendation herein, or have positions in the securities mentioned herein or options with respect thereto. Any recommendation contained in this report may not be suitable for all investors and it is not to be deemed an offer or solicitation on our part with respect to the purchase or sale of any securities. |
|
 |
Financial Indexes Posted Influential Gains
Kenneth J. Gruneisen - Passed the CAN SLIM® Master's Exam
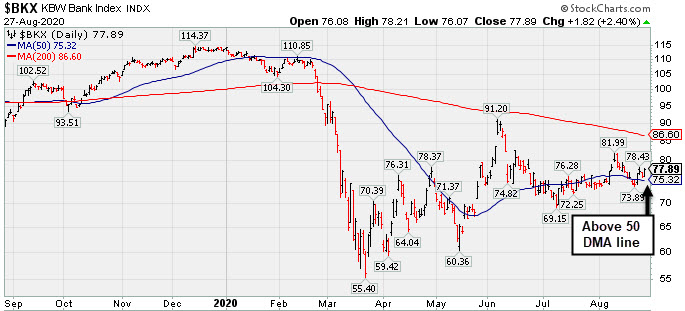
Gains from the financial indexes helped to underpin the major averages as the Broker/Dealer Index ($XBD +1.02%) and Bank Index ($BKX +2.39%) both rose, but the Retail Index ($RLX -1.13%) pulled back and created a drag. The tech sector also had a negative bias as the Semiconductor Index ($SOX -1.34%) and Networking Index ($NWX -1.09%) both lost ground while the Biotech Index ($BTK +0.16%) eked out a tiny gain. The Gold & Silver Index ($XAU -2.00%) lagged as it suffered a larger loss, meanwhile the Oil Services Index ($OSX -0.20%) and Integrated Oil Index ($XOI +0.16%) were mixed and little changed.
PICTURED: The Bank Index ($BKX +2.39%) is consolidating above its 50-day moving average (DMA) line.
| Oil Services |
$OSX |
35.58 |
-0.07 |
-0.20% |
-54.55% |
| Integrated Oil |
$XOI |
725.60 |
+1.15 |
+0.16% |
-42.89% |
| Semiconductor |
$SOX |
2,220.15 |
-30.08 |
-1.34% |
+20.03% |
| Networking |
$NWX |
589.14 |
-6.46 |
-1.09% |
+0.98% |
| Broker/Dealer |
$XBD |
297.05 |
+3.01 |
+1.02% |
+2.30% |
| Retail |
$RLX |
3,588.24 |
-41.09 |
-1.13% |
+46.50% |
| Gold & Silver |
$XAU |
147.49 |
-3.01 |
-2.00% |
+37.94% |
| Bank |
$BKX |
77.89 |
+1.82 |
+2.39% |
-31.29% |
| Biotech |
$BTK |
5,360.78 |
+8.39 |
+0.16% |
+5.79% |
|
|
|
 |
Volume Totals Cooling While Still Hovering Near Record High
Kenneth J. Gruneisen - Passed the CAN SLIM® Master's Exam
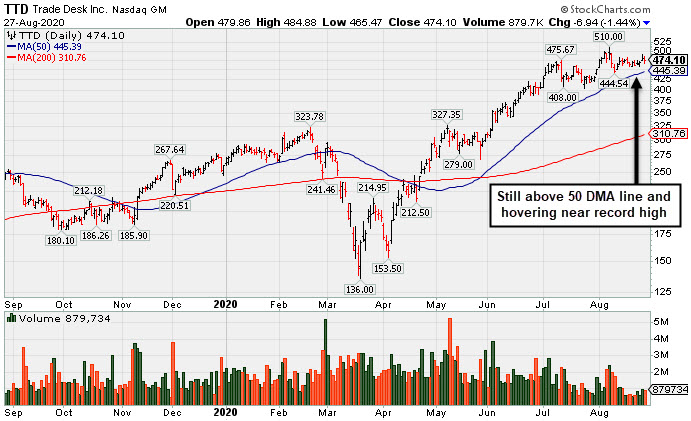
The Trade Desk Inc Cl A (TTD -$6.94 or -1.44% to $474.10) has seen its volume totals cooling in recent weeks while still stubbornly holding its ground perched near its all-time high. Recently it reported Jun '20 quarterly earnings -3% on -13% sales revenues versus the year ago period, below the +25% minimum earnings guideline (C criteria) raising fundamental concerns. It is extended from any sound base of sufficient length. Its 50-day moving average (DMA) line ($445.39) defines near-term support above the prior low ($404 on 7/24/20) where violations may trigger technical sell signals.
TTD traded up as much as +50% since highlighted in yellow with new pivot point cited based on its 5/07/20 high in the 6/03/20 mid-day report (read here). The Comml Svcs-Advertising firm was last shown in this FSU section on 8/12/20 with an annotated graph under the headline, "Hovering Near High After Latest Quarterly Report Raised Concerns".
Its annual earnings (A criteria) history has been strong, and it has a 97 Earnings Per Share Rating. The number of top-rated funds owning its shares rose from 280 in Mar '18 to 749 in Jun '20, a reassuring sign concerning the I criteria. Its current Up/Down Volume Ratio of 1.9 is an unbiased indication its shares have been under accumulation over the past 50 days. It has a Timeliness Rating of B and a Sponsorship Rating of B. There are only 46.7 million shares outstanding (S criteria) which can contribute to greater volatility in the event of institutional buying or selling. |
|
|
Color Codes Explained :
Y - Better candidates highlighted by our
staff of experts.
G - Previously featured
in past reports as yellow but may no longer be buyable under the
guidelines.
***Last / Change / Volume data in this table is the closing quote data***
Symbol/Exchange
Company Name
Industry Group |
PRICE |
CHANGE
(%Change) |
Day High |
Volume
(% DAV)
(% 50 day avg vol) |
52 Wk Hi
% From Hi |
Featured
Date |
Price
Featured |
Pivot Featured |
|
Max Buy |
 CRL
-
NYSE
CRL
-
NYSE
Charles River Labs Intl
DRUGS - Biotechnology
|
$217.15
|
-1.45
-0.66% |
$218.39
|
210,697
59.86% of 50 DAV
50 DAV is 352,000
|
$221.97
-2.17%
|
7/15/2020
|
$192.66
|
PP = $189.95
|
|
MB = $199.45
|
 Most Recent Note - 8/27/2020 5:44:35 PM
G - Volume totals have been cooling while still hovering in a very tight range near its all-time high. The 50 DMA line ($197.21) defines initial support to watch above the prior high ($189.85 on 6/03/20). Recently reported Jun '20 quarterly earnings -3% on +4% sales revenues, below the +25% minimum guideline (C criteria), but better than expected while the company also raised its guidance. See the latest FSU analysis for more details and an annotated graph.
>>> FEATURED STOCK ARTICLE : Volume Totals Cooling While Hovering in Tight Range Near Record High - 8/25/2020 |
View all notes |
Set NEW NOTE alert |
Company Profile |
SEC
News |
Chart |
Request a new note
C
A
S
I |
EBS
-
NYSE
Emergent Biosolutions
DRUGS - Biotechnology
|
$118.37
|
-5.36
-4.33% |
$124.00
|
865,678
88.61% of 50 DAV
50 DAV is 977,000
|
$137.61
-13.98%
|
7/7/2020
|
$89.47
|
PP = $93.68
|
|
MB = $98.36
|
Most Recent Note - 8/27/2020 12:37:02 PM
G - Retreating from its all-time high after getting very extended from any sound base. Bullish action came after it reported Jun '20 quarterly earnings +890% on +62% sales revenue for the Jun '20 quarter versus the year ago period. Its prior high $107.16 on 7/20/20) and its 50 DMA line ($103.36 ) define near-term support to watch.
>>> FEATURED STOCK ARTICLE : High Ranked Biomed Leader is Extended From Prior Base - 8/21/2020 |
View all notes |
Set NEW NOTE alert |
Company Profile |
SEC
News |
Chart |
Request a new note
C
A
S
I |
AMD
-
NASDAQ
Advanced Micro Devices
ELECTRONICS - Semiconductor - Broad Line
|
$83.80
|
-2.22
-2.58% |
$86.58
|
42,048,404
67.73% of 50 DAV
50 DAV is 62,084,000
|
$87.72
-4.47%
|
7/22/2020
|
$61.73
|
PP = $59.10
|
|
MB = $62.06
|
Most Recent Note - 8/27/2020 5:41:29 PM
G - Pulled back for a 2nd consecutive loss on lighter volume, still perched near its all-time high. It has not formed a new base of sufficient length. The recent low ($76.10 on 8/11/20) defines near-term support above its 50 DMA line ($67.50). Fundamentals remain strong.
>>> FEATURED STOCK ARTICLE : AMD Rose +46% Since First Featured on June 9th - 8/14/2020 |
View all notes |
Set NEW NOTE alert |
Company Profile |
SEC
News |
Chart |
Request a new note
C
A
S
I |
TREX
-
NYSE
Trex Company Inc
MATERIALS and CONSTRUCTION - General Building Materials
|
$146.81
|
-1.30
-0.88% |
$151.77
|
328,084
41.01% of 50 DAV
50 DAV is 800,000
|
$153.16
-4.15%
|
6/26/2020
|
$109.05
|
PP = $132.94
|
|
MB = $139.59
|
Most Recent Note - 8/25/2020 6:44:45 PM
G - Pulled back from its all-time high with today's loss backed by higher (but still below average) volume. It is extended from any sound base. Reported Jun '20 quarterly earnings +27% on +7% sales revenues versus the year ago period. Important near-term support is at its 50 DMA line ($133.80).
>>> FEATURED STOCK ARTICLE : Wedging Into New High Territory After Latest Earnings Report - 8/19/2020 |
View all notes |
Set NEW NOTE alert |
Company Profile |
SEC
News |
Chart |
Request a new note
C
A
S
I |
NFLX
-
NASDAQ
Netflix Inc
SPECIALTY RETAIL - Music and Video Stores
|
$526.27
|
-21.26
-3.88% |
$541.00
|
8,940,562
116.47% of 50 DAV
50 DAV is 7,676,000
|
$575.37
-8.53%
|
5/14/2020
|
$441.95
|
PP = $449.62
|
|
MB = $472.10
|
Most Recent Note - 8/27/2020 12:14:14 PM
G - Pulling back today after posting a big volume-driven gain on the prior session backed by +165% above average volume. Found support near its 50 DMA line ($490) on consolidations during its ongoing ascent. Noted with caution in the 8/26/20 mid-day report - "It did not form a sound base and some resistance remains due to overhead supply up to the $575 level. Fundamentals remain strong."
>>> FEATURED STOCK ARTICLE : 50-Day Moving Average Acted As Support Level - 8/18/2020 |
View all notes |
Set NEW NOTE alert |
Company Profile |
SEC
News |
Chart |
Request a new note
C
A
S
I |
Symbol/Exchange
Company Name
Industry Group |
PRICE |
CHANGE
(%Change) |
Day High |
Volume
(% DAV)
(% 50 day avg vol) |
52 Wk Hi
% From Hi |
Featured
Date |
Price
Featured |
Pivot Featured |
|
Max Buy |
CHGG
-
NYSE
Chegg Inc
Consumer Svcs-Education
|
$75.20
|
-1.14
-1.49% |
$76.14
|
2,108,127
55.77% of 50 DAV
50 DAV is 3,780,000
|
$89.82
-16.28%
|
6/17/2020
|
$63.71
|
PP = $68.08
|
|
MB = $71.48
|
Most Recent Note - 8/27/2020 5:43:33 PM
G - Still testing support near its 50 DMA line ($74.36). The recent low ($72.05 on 8/24/20) defines the next important support to watch. Damaging losses leading to violations would raise concerns and trigger technical sell signals. Reported Jun '20 quarterly earnings +61% on +63% sales revenues versus the year ago period.
>>> FEATURED STOCK ARTICLE : Volume-Driven Loss Tests Support at 50-Day Moving Average - 8/24/2020 |
View all notes |
Set NEW NOTE alert |
Company Profile |
SEC
News |
Chart |
Request a new note
C
A
S
I |
LGIH
-
NASDAQ
L G I Homes Inc
Bldg-Resident/Comml
|
$113.09
|
-1.77
-1.54% |
$116.93
|
215,670
68.25% of 50 DAV
50 DAV is 316,000
|
$123.94
-8.75%
|
7/7/2020
|
$99.19
|
PP = $95.82
|
|
MB = $100.61
|
Most Recent Note - 8/26/2020 7:03:50 PM
G - Volume totals have been cooling while still hovering near its 52-week high, showing resilience after its latest earnings report. It is extended from the previously noted base, meanwhile, its 50 DMA line ($105.28) defines near-term support to watch above the prior low ($104.24 on 8/11/20). Reported Jun '20 quarterly earnings +21% on +4% sales revenues, breaking a streak of 4 comparisons above the +25% minimum guideline (C criteria).
>>> FEATURED STOCK ARTICLE : Leadership in Building - Residential/Commercial Group Improving - 8/20/2020 |
View all notes |
Set NEW NOTE alert |
Company Profile |
SEC
News |
Chart |
Request a new note
C
A
S
I |
NOW
-
NYSE
Servicenow Inc
Computer Sftwr-Enterprse
|
$480.55
|
-7.15
-1.47% |
$485.10
|
1,519,886
87.60% of 50 DAV
50 DAV is 1,735,000
|
$488.58
-1.64%
|
8/20/2020
|
$453.34
|
PP = $454.79
|
|
MB = $477.53
|
Most Recent Note - 8/26/2020 12:26:12 PM
G - Hitting a new all-time high while rallying above its "max buy" level with today's big gain and its color code is changed to green. Its 50 DMA line ($426) defines important near-term support to watch. Reported Jun '20 quarterly earnings +73% on +28% sales revenues versus the year ago period.
>>> FEATURED STOCK ARTICLE : Consolidating Above 50-Day Average After Another Strong Quarter - 8/13/2020 |
View all notes |
Set NEW NOTE alert |
Company Profile |
SEC
News |
Chart |
Request a new note
C
A
S
I |
TTD
-
NASDAQ
The Trade Desk Inc Cl A
Comml Svcs-Advertising
|
$474.10
|
-6.94
-1.44% |
$484.88
|
879,529
64.96% of 50 DAV
50 DAV is 1,354,000
|
$510.00
-7.04%
|
6/3/2020
|
$340.61
|
PP = $327.35
|
|
MB = $343.72
|
Most Recent Note - 8/27/2020 5:38:20 PM
G - Volume totals have been cooling in recent weeks while holding its ground perched near its all-time high. Recently reported Jun '20 quarterly earnings -3% on -13% sales revenues versus the year ago period, raising fundamental concerns. It is extended from any sound base of sufficient length. Its 50 DMA line ($445.39) defines near-term support above the prior low ($404 on 7/24/20) where violations may trigger technical sell signals. See the latest FSU analysis for more details and a new annotated graph.
>>> FEATURED STOCK ARTICLE : Volume Totals Cooling While Still Hovering Near Record High - 8/27/2020 |
View all notes |
Set NEW NOTE alert |
Company Profile |
SEC
News |
Chart |
Request a new note
C
A
S
I |
DOCU
-
NASDAQ
Docusign Inc
Computer Sftwr-Enterprse
|
$214.77
|
+0.36
0.17% |
$217.90
|
2,413,230
50.43% of 50 DAV
50 DAV is 4,785,000
|
$229.83
-6.55%
|
6/10/2020
|
$149.73
|
PP = $152.10
|
|
MB = $159.71
|
Most Recent Note - 8/26/2020 7:05:23 PM
G - Posted a big gain today with higher (but below average) volume. It has not formed a sound base of sufficient length. Its 50 DMA line ($196) and prior low ($189.12 on 8/12/20) define important near-term support to watch.
>>> FEATURED STOCK ARTICLE : Consolidating Above 50-Day Moving Average Line and Recent Low - 8/17/2020 |
View all notes |
Set NEW NOTE alert |
Company Profile |
SEC
News |
Chart |
Request a new note
C
A
S
I |
Symbol/Exchange
Company Name
Industry Group |
PRICE |
CHANGE
(%Change) |
Day High |
Volume
(% DAV)
(% 50 day avg vol) |
52 Wk Hi
% From Hi |
Featured
Date |
Price
Featured |
Pivot Featured |
|
Max Buy |
PING
-
NYSE
Ping Identity Holdings Corp
Computer Sftwr-Security
|
$34.50
|
-0.58
-1.65% |
$35.18
|
592,528
45.38% of 50 DAV
50 DAV is 1,305,700
|
$37.80
-8.73%
|
6/1/2020
|
$29.24
|
PP = $29.90
|
|
MB = $31.40
|
Most Recent Note - 8/26/2020 7:01:15 PM
G - Posted a solid gain today with below average volume. Found prompt support near its 50 DMA line ($33.31) recently amid weakness after it reported Jun '20 quarterly earnings -27% on -6% sales revenues versus the year ago period, below the +25% minimum earnings guideline, raising fundamental concerns. The next important near-term support below the 50 DMA line is the prior highs in the $29 area. It completed Secondary Offerings on 7/09/20 and 5/15/20. See the latest FSU analysis for more details and a new annotated graph.
>>> FEATURED STOCK ARTICLE : Found Support Near 50 DMA Line But Latest Earnings Were Sub Par - 8/26/2020 |
View all notes |
Set NEW NOTE alert |
Company Profile |
SEC
News |
Chart |
Request a new note
C
A
S
I |
|
|
|
THESE ARE NOT BUY RECOMMENDATIONS!
Comments contained in the body of this report are technical
opinions only. The material herein has been obtained
from sources believed to be reliable and accurate, however,
its accuracy and completeness cannot be guaranteed.
This site is not an investment advisor, hence it does
not endorse or recommend any securities or other investments.
Any recommendation contained in this report may not
be suitable for all investors and it is not to be deemed
an offer or solicitation on our part with respect to
the purchase or sale of any securities. All trademarks,
service marks and trade names appearing in this report
are the property of their respective owners, and are
likewise used for identification purposes only.
This report is a service available
only to active Paid Premium Members.
You may opt-out of receiving report notifications
at any time. Questions or comments may be submitted
by writing to Premium Membership Services 665 S.E. 10 Street, Suite 201 Deerfield Beach, FL 33441-5634 or by calling 1-800-965-8307
or 954-785-1121.
|
|
|