You are not logged in.
This means you
CAN ONLY VIEW reports that were published prior to Monday, February 19, 2024.
You
MUST UPGRADE YOUR MEMBERSHIP if you want to see any current reports.
AFTER MARKET UPDATE - FRIDAY, AUGUST 26TH, 2022
Previous After Market Report Next After Market Report >>>
|
|
|
|
DOW |
-1,008.38 |
32,283.40 |
-3.03% |
|
Volume |
801,131,268 |
+10% |
|
Volume |
4,515,231,800 |
+6% |
|
NASDAQ |
-497.56 |
12,141.71 |
-3.94% |
|
Advancers |
376 |
12% |
|
Advancers |
815 |
19% |
|
S&P 500 |
-141.46 |
4,057.66 |
-3.37% |
|
Decliners |
2,689 |
88% |
|
Decliners |
3,370 |
81% |
|
Russell 2000 |
-64.81 |
1,899.83 |
-3.30% |
|
52 Wk Highs |
28 |
|
|
52 Wk Highs |
37 |
|
|
S&P 600 |
-40.50 |
1,225.50 |
-3.20% |
|
52 Wk Lows |
97 |
|
|
52 Wk Lows |
174 |
|
|
 |
Market Uptrend Comes Under Pressure
Kenneth J. Gruneisen - Passed the CAN SLIM® Master's Exam
The S&P 500 slid 3.4%, dipping below its 100-day moving average (a closely watched technical level), and closing the week 4% lower. The Nasdaq Composite fell 3.9%, retreating 4.4% for the week. Both benchmarks saw their worst single-session declines since mid-June. The Dow lost 1,008 points, its steepest daily drop since May 18. All three benchmarks weathered their first two-week losing streak since mid-June and are now in negative territory for the month of August. The volume totals reported were higher than the prior session on the NYSE and on the Nasdaq exchange, indicative of an increase in institutional selling. Breadth was clearly negative as decliners led advancers by a 7-1 margin on the NYSE and 4-1 on the Nasdaq exchange. There were 11 high-ranked companies from the Leaders List that hit new 52-week highs and were listed on the BreakOuts Page, versus the total of 20 on the prior session. New 52-week lows totals expanded and outnumbered shrinking new 52-week highs on the NYSE and on the Nasdaq exchange. The market uptrend is now under pressure (M criteria). Any sustainable rally requires a healthy crop of leading stocks hitting new highs.
Chart courtesy of www.stockcharts.com%20on%20Tuesday.%20Yesterday,%20the%20broad%20benchmark%20eclipsed%20the%204,300%20level%20for%20the%20first%20time%20since%20late%20April.%20The%20Nasdaq%20Composite%20fell%201.3%%20amid%20weakness%20in%20mega-cap%20tech%20shares.%20The%20volume%20totals%20reported%20were%20mixed,%20lighter%20than%20the%20prior%20session%20on%20the%20NYSE%20and%20higher%20on%20the%20Nasdaq%20exchange.%20Decliners%20led%20advancers%20by%20a%204-1%20margin%20on%20the%20NYSE%20ad%20by%20a%203-1%20margin%20on%20the%20Nasdaq%20exchange.%20There%20were%2017%20high-ranked%20companies%20from%20the%20Leaders%20List%20that%20hit%20new%2052-week%20highs%20and%20were%20listed%20on%20the%20BreakOuts%20Page,%20down%20from%20the%20total%20of%2045%20on%20the%20prior%20session.%20New%2052-week%20highs%20outnumbered%20new%2052-week%20lows%20on%20the%20NYSE,%20but%20new%20lows%20outnumbered%20new%20highs%20on%20the%20Nasdaq%20exchange.%20The%20market%20is%20in%20a%20confirmed%20uptrend%20(M%20criteria).%20Any%20sustainable%20rally%20requires%20a%20healthy%20crop%20of%20leading%20stocks%20hitting%20new%20highs,%20so%20the%20recent%20improvement%20in%20leadership%20was%20a%20reassuring%20sign.) 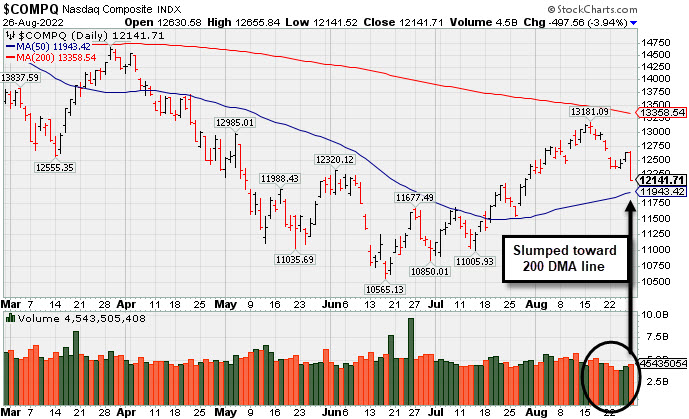 PICTURED: The Nasdaq Composite Index slumped toward its 50-day moving average (DMA) line with a big loss marked by an increase in volume.
U.S. stocks finished at session lows on Friday after Federal Reserve (Fed) Chair Jerome Powell said that the central bank would continue to fight inflation “until the job is done.” During the annual economic symposium, the Fed chief reiterated the hawkish statements made by other Fed leaders in the past week, stating that officials would maintain restrictive policy for “some time.” He confirmed that the size of September’s rate hike would remain data dependent, but hinted that another “unusually large” rate hike could be appropriate, fanning expectations for a third-straight 0.75% increase.
On the data front, the core PCE deflator (the Fed’s preferred proxy for inflation) climbed 4.6% year-over-year in July, easing from June’s 4.8% annual increase. Separately, personal spending rose a smaller-than-forecasted 0.1% in July, while personal income advanced 0.2%. Additionally, a final August update from the University of Michigan showed consumer sentiment hit a three-month high, while the measure of inflation expectations eased. Treasuries recouped earlier losses, finishing the session little changed. The yield on the benchmark 10-year note held steady at 3.03%, while the yield on the two-year note settled at 3.38%, still 0.50% higher month-to-date. |
 Kenneth J. Gruneisen started out as a licensed stockbroker in August 1987, a couple of months prior to the historic stock market crash that took the Dow Jones Industrial Average down -22.6% in a single day. He has published daily fact-based fundamental and technical analysis on high-ranked stocks online for two decades. Through FACTBASEDINVESTING.COM, Kenneth provides educational articles, news, market commentary, and other information regarding proven investment systems that work in good times and bad.
Comments contained in the body of this report are technical opinions only and are not necessarily those of Gruneisen Growth Corp. The material herein has been obtained from sources believed to be reliable and accurate, however, its accuracy and completeness cannot be guaranteed. Our firm, employees, and customers may effect transactions, including transactions contrary to any recommendation herein, or have positions in the securities mentioned herein or options with respect thereto. Any recommendation contained in this report may not be suitable for all investors and it is not to be deemed an offer or solicitation on our part with respect to the purchase or sale of any securities. |
|
 |
Tech, Retail, Commodity-Linked, and Financial Indexes Sank
Kenneth J. Gruneisen - Passed the CAN SLIM® Master's Exam
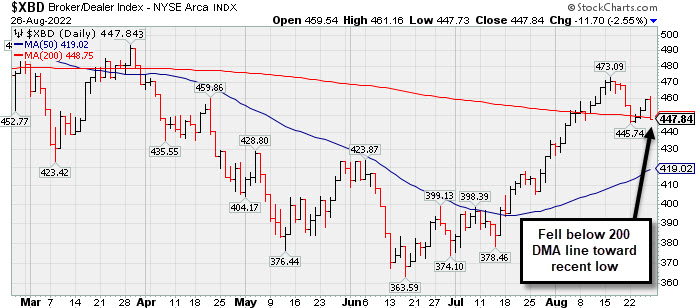
The tech sector slumped badly as the Semiconductor Index ($SOX -5.81%) outpaced the Networking Index ($NWX -3.18%) and Biotech Index ($BTK -3.33%) to the downside on Friday. The Retail Index ($RLX -4.35%) suffered a big loss as it and the Broker/Dealer Index ($XBD -2.55%) and Bank Index ($BKX -3.35%) had a negative influence on the major averages. The Gold & Silver Index ($XAU -4.53%) also suffered a large loss while the Oil Services Index ($OSX -2.54%) and Integrated Oil Index ($XOI -0.87%) also lost ground.
PICTURED: The Broker/Dealer Index ($XBD -2.55%) fell below its 200-day moving average (DMA) line toward the recent low.
| Oil Services |
$OSX |
71.93 |
-1.88 |
-2.54% |
+36.44% |
| Integrated Oil |
$XOI |
1,702.64 |
-14.90 |
-0.87% |
+44.51% |
| Semiconductor |
$SOX |
2,798.44 |
-172.62 |
-5.81% |
-29.08% |
| Networking |
$NWX |
821.09 |
-26.95 |
-3.18% |
-15.45% |
| Broker/Dealer |
$XBD |
447.84 |
-11.70 |
-2.55% |
-8.02% |
| Retail |
$RLX |
3,300.86 |
-150.20 |
-4.35% |
-21.90% |
| Gold & Silver |
$XAU |
103.84 |
-4.93 |
-4.53% |
-21.60% |
| Bank |
$BKX |
107.65 |
-3.73 |
-3.35% |
-18.59% |
| Biotech |
$BTK |
4,726.84 |
-162.62 |
-3.33% |
-14.34% |
|
|
|
 |
Cigna Hovering Near High Despite Earnings Under +25% Minimum
Kenneth J. Gruneisen - Passed the CAN SLIM® Master's Exam
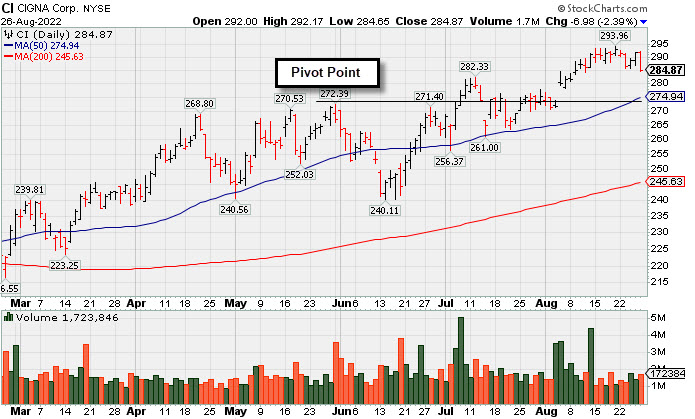
Cigna Corp (CI -$6.98 or -2.39% to $284.87) pulled back with below average volume. Volume totals have been cooling while hovering near its all-time high. Recently it reported earnings for the Jun '22 quarter rose +19% on +5% sales revenues versus the year ago period, breaking a streak of 3 quarterly earnings increases above the +25% minimum guideline (C criteria), raising concerns. Near-term support to watch is at its 50-day moving average (DMA) line ($275).
CI has a 94 Earnings Per Share Rating. Annual earnings growth (A criteria) has been strong. It was highlighted in yellow with new pivot point based on its 5/31/22 high plus 10 cents in the 7/07/22 mid-day report (read here). It was last shown in greater on 8/9/22 with an annotated graph under the headline, "Wedging Higher With Lighter Volume Behind Gain for New High".
The number of top-rated funds owning its shares rose from 2,628 in Dec '21 to 2,851 in Jun '22, a reassuring sign concerning the I criteria. The Medical - Managed Care group is currently ranked 16th on the 197 Industry Groups list and has a Group Relative Strength Rating of 92 (A), a reassuring sign concerning the L criteria. Its current Up/Down Volume Ratio of 1.8 is an unbiased indication its shares have been under accumulation over the past 50 days.
|
|
|
Color Codes Explained :
Y - Better candidates highlighted by our
staff of experts.
G - Previously featured
in past reports as yellow but may no longer be buyable under the
guidelines.
***Last / Change / Volume data in this table is the closing quote data***
Symbol/Exchange
Company Name
Industry Group |
PRICE |
CHANGE
(%Change) |
Day High |
Volume
(% DAV)
(% 50 day avg vol) |
52 Wk Hi
% From Hi |
Featured
Date |
Price
Featured |
Pivot Featured |
|
Max Buy |
 IMXI
-
NASDAQ
IMXI
-
NASDAQ
International Money Exp
Financial Svcs-Specialty
|
$24.11
|
-0.68
-2.74% |
$24.88
|
265,956
50.75% of 50 DAV
50 DAV is 524,000
|
$26.23
-8.08%
|
7/1/2022
|
$21.27
|
PP = $21.38
|
|
MB = $22.45
|
Most Recent Note - 8/23/2022 5:25:29 PM
G - Down today for 3rd consecutive small loss on lighter volume, retreating from its all-time high. Prior highs in the $22 area and its 50 DMA line ($22.44) define important near-term support to watch. Reported Jun '22 quarterly earnings +21% on +17% sales revenues versus the year ago period, below the +25% minimum earnings guideline (C criteria), raising fundamental concerns. See the latest FSU analysis for more details and a new annotated graph.
>>> FEATURED STOCK ARTICLE : June Quarter Was Below +25% Minimum Earnings Guideline - 8/23/2022 |
View all notes |
Set NEW NOTE alert |
Company Profile |
SEC
News |
Chart |
Request a new note
C
A
S
I |
CI
-
NYSE
Cigna Corp
Medical-Managed Care
|
$284.87
|
-6.98
-2.39% |
$292.17
|
1,723,846
86.32% of 50 DAV
50 DAV is 1,997,000
|
$293.96
-3.09%
|
7/7/2022
|
$276.55
|
PP = $273.68
|
|
MB = $287.36
|
 Most Recent Note - 8/26/2022 6:35:32 PM
G - Pulled back today with below average volume. Volume totals have been cooling while hovering near its all-time high. Reported earnings for the Jun '22 quarter rose +19% on +5% sales revenues versus the year ago period, breaking a streak of 3 quarterly earnings increases above the +25% minimum guideline (C criteria), raising fundamental concerns. Near-term support to watch is at its 50 DMA line ($275). See the latest FSU analysis for more details and a new annotated graph.
>>> FEATURED STOCK ARTICLE : Cigna Hovering Near High Despite Earnings Under +25% Minimum - 8/26/2022 |
View all notes |
Set NEW NOTE alert |
Company Profile |
SEC
News |
Chart |
Request a new note
C
A
S
I |
AN
-
NYSE
Autonation Inc
SPECIALTY RETAIL - Auto Dealerships
|
$126.35
|
-2.79
-2.16% |
$130.24
|
600,058
85.85% of 50 DAV
50 DAV is 699,000
|
$135.57
-6.80%
|
7/20/2022
|
$122.03
|
PP = $126.49
|
|
MB = $132.81
|
Most Recent Note - 8/25/2022 5:52:00 PM
Y - Posted a 3rd consecutive gain today and rose back above prior highs in the $126 area which were noted as initial support to watch. Faces no resistance due to overhead supply. Reported Jun '22 quarterly earnings +34% on -2% sales revenues versus the year ago period.
>>> FEATURED STOCK ARTICLE : Autonation Hovering Near Stubborn Resistance - 8/11/2022 |
View all notes |
Set NEW NOTE alert |
Company Profile |
SEC
News |
Chart |
Request a new note
C
A
S
I |
ESQ
-
NASDAQ
Esquire Financial Hldgs
Finance-Commercial Loans
|
$38.30
|
-0.73
-1.87% |
$39.31
|
25,726
44.36% of 50 DAV
50 DAV is 58,000
|
$41.68
-8.11%
|
7/26/2022
|
$37.74
|
PP = $39.19
|
|
MB = $41.15
|
Most Recent Note - 8/26/2022 1:14:16 PM
Y - Volume totals have remained lighter than average volume while sputtering back and testing support near prior resistance in the $39 area. Confirming gains above the pivot point backed by at least +40% above average volume would be a reassuring sign of fresh institutional buying. Its 50 DMA line ($36.13) defines important near-term support.
>>> FEATURED STOCK ARTICLE : Closed at Session High With Gain for New All-Time High - 8/12/2022 |
View all notes |
Set NEW NOTE alert |
Company Profile |
SEC
News |
Chart |
Request a new note
C
A
S
I |
GPK
-
NYSE
Graphic Packaging Hldg
CONSUMER NON-DURABLES - Packaging and Containers
|
$22.92
|
-0.51
-2.18% |
$23.53
|
1,607,323
53.26% of 50 DAV
50 DAV is 3,018,000
|
$23.71
-3.33%
|
7/26/2022
|
$22.63
|
PP = $23.09
|
|
MB = $24.24
|
Most Recent Note - 8/23/2022 5:28:38 PM
Y - Posted a small gain today with light volume. Churned heavy volume but made limited progress since its 8/10/22 breakout, action indicative of distributional pressure.
>>> FEATURED STOCK ARTICLE : Churned Heavy Volume Perched at High After 6 Straight Gains - 8/15/2022 |
View all notes |
Set NEW NOTE alert |
Company Profile |
SEC
News |
Chart |
Request a new note
C
A
S
I |
Symbol/Exchange
Company Name
Industry Group |
PRICE |
CHANGE
(%Change) |
Day High |
Volume
(% DAV)
(% 50 day avg vol) |
52 Wk Hi
% From Hi |
Featured
Date |
Price
Featured |
Pivot Featured |
|
Max Buy |
CSL
-
NYSE
Carlisle Cos Inc
Diversified Operations
|
$304.95
|
-10.29
-3.26% |
$315.42
|
371,531
90.40% of 50 DAV
50 DAV is 411,000
|
$318.71
-4.32%
|
7/28/2022
|
$282.31
|
PP = $275.23
|
|
MB = $288.99
|
Most Recent Note - 8/25/2022 5:56:16 PM
G - Posted a 3rd consecutive small gain, perched near its all-time high, stubbornly holding its ground. Prior highs in the $275 area define initial support to watch along with its 50 DMA line ($272.70).
>>> FEATURED STOCK ARTICLE : Pulling Back From All-Time High After Volume-Driven Gains - 8/22/2022 |
View all notes |
Set NEW NOTE alert |
Company Profile |
SEC
News |
Chart |
Request a new note
C
A
S
I |
ENPH
-
NASDAQ
Enphase Energy Inc
Energy-Solar
|
$288.59
|
-11.22
-3.74% |
$305.66
|
2,457,822
73.94% of 50 DAV
50 DAV is 3,324,000
|
$308.88
-6.57%
|
7/28/2022
|
$276.66
|
PP = $282.55
|
|
MB = $296.68
|
Most Recent Note - 8/26/2022 1:09:36 PM
Y - Pulling back today with light volume. Volume totals cooled while hovering near its all-time high in recent weeks. The prior high in the $282 area has been noted as initial support to watch above its 50 DMA line ($241). Fundamentals remain strong.
>>> FEATURED STOCK ARTICLE : Enphase Energy Consolidating After Rallying to New Highs - 8/19/2022 |
View all notes |
Set NEW NOTE alert |
Company Profile |
SEC
News |
Chart |
Request a new note
C
A
S
I |
PWR
-
NYSE
Quanta Services Inc
MATERIALS and CONSTRUCTION - General Contractors
|
$144.63
|
-3.12
-2.11% |
$148.21
|
982,832
83.93% of 50 DAV
50 DAV is 1,171,000
|
$149.33
-3.15%
|
7/28/2022
|
$141.83
|
PP = $140.14
|
|
MB = $147.15
|
Most Recent Note - 8/24/2022 5:12:25 PM
Y - Posted a small gain today with light volume for its 2nd best ever close. Volume totals have been below average while recently wedging back above its pivot point since encountering some distributional pressure. Confirming volume-driven gains for new highs would be a reassuring sign of serious institutional buying demand. Its 50 DMA line ($132.22) defines important near-term support to watch. Fundamentals remain strong.
>>> FEATURED STOCK ARTICLE : Stalled After Breakout But Still Quietly Hovering Near High - 8/16/2022 |
View all notes |
Set NEW NOTE alert |
Company Profile |
SEC
News |
Chart |
Request a new note
C
A
S
I |
CLFD
-
NASDAQ
Clearfield Inc
TELECOMMUNICATIONS - Cables / Satalite Equipment
|
$122.54
|
-4.02
-3.18% |
$128.71
|
179,743
52.56% of 50 DAV
50 DAV is 342,000
|
$130.01
-5.75%
|
7/29/2022
|
$94.10
|
PP = $86.81
|
|
MB = $91.15
|
Most Recent Note - 8/23/2022 5:27:41 PM
G - Posted a gain today with average volume for a new all-time high, getting very extended from any sound base. Prior high in the $86 area defines initial support to watch above its 50 DMA line. Fundamentals remain strong.
>>> FEATURED STOCK ARTICLE : Clearfield Showed Resilience After Considerable Rally - 8/17/2022 |
View all notes |
Set NEW NOTE alert |
Company Profile |
SEC
News |
Chart |
Request a new note
C
A
S
I |
GFF
-
NYSE
Griffon Corporation
MATERIALS and CONSTRUCTION - General Building Materials
|
$32.44
|
-1.56
-4.59% |
$34.00
|
358,757
77.99% of 50 DAV
50 DAV is 460,000
|
$34.35
-5.56%
|
8/8/2022
|
$32.46
|
PP = $31.12
|
|
MB = $32.68
|
Most Recent Note - 8/26/2022 1:07:27 PM
G - Pulling back near its "max buy" level with light volume behind today's loss. Prior highs in the $31 area define initial support to watch above its 50 DMA line ($28.70). See the latest FSU analysis for more details and an annotated graph.
>>> FEATURED STOCK ARTICLE : Best Ever Close With Gain on Lighter Volume - 8/25/2022 |
View all notes |
Set NEW NOTE alert |
Company Profile |
SEC
News |
Chart |
Request a new note
C
A
S
I |
Symbol/Exchange
Company Name
Industry Group |
PRICE |
CHANGE
(%Change) |
Day High |
Volume
(% DAV)
(% 50 day avg vol) |
52 Wk Hi
% From Hi |
Featured
Date |
Price
Featured |
Pivot Featured |
|
Max Buy |
CLH
-
NYSE
Clean Harbors Inc
Pollution Control
|
$118.95
|
-3.39
-2.77% |
$122.57
|
293,978
90.73% of 50 DAV
50 DAV is 324,000
|
$124.33
-4.33%
|
8/10/2022
|
$111.78
|
PP = $115.10
|
|
MB = $120.86
|
Most Recent Note - 8/24/2022 12:23:36 PM
G - Hitting a new all-time high with today's gain, rising above its "max buy" level and its color code is changed to green. Posted a solid gain on the prior session backed by +20% above average volume. Previously noted gain and strong close above the pivot point backed by +116% above average volume on 8/12/22 triggered a technical buy signal. No resistance remains due to overhead supply. Fundamentals remain strong. Prior high in the $115 area defines important near-term support to watch on pullbacks.
>>> FEATURED STOCK ARTICLE : Pollution Control Firm Perched Near Prior High - 8/10/2022 |
View all notes |
Set NEW NOTE alert |
Company Profile |
SEC
News |
Chart |
Request a new note
C
A
S
I |
SNPS
-
NASDAQ
Synopsys Inc
COMPUTER SOFTWARE and SERVICES - Technical and System Software
|
$355.00
|
-8.26
-2.27% |
$363.54
|
1,219,553
128.10% of 50 DAV
50 DAV is 952,000
|
$391.17
-9.25%
|
8/17/2022
|
$381.37
|
PP = $377.70
|
|
MB = $396.59
|
Most Recent Note - 8/24/2022 5:13:55 PM
G - Halted its slide this week after encountering distributional pressure since reaching a new all-time high. Reported Jul '22 quarterly earnings +16% on +18% sales revenues versus the year ago period, below the +25% minimum earnings guideline (C criteria), raising fundamental concerns. Renewed strength and subsequent gains above the pivot point backed by at least +40% above average volume are needed to clinch a technical buy signal.
>>> FEATURED STOCK ARTICLE : Earnings Report Below +25% Minimum and Encountering Distributional Pressure - 8/18/2022 |
View all notes |
Set NEW NOTE alert |
Company Profile |
SEC
News |
Chart |
Request a new note
C
A
S
I |
|
|
|
THESE ARE NOT BUY RECOMMENDATIONS!
Comments contained in the body of this report are technical
opinions only. The material herein has been obtained
from sources believed to be reliable and accurate, however,
its accuracy and completeness cannot be guaranteed.
This site is not an investment advisor, hence it does
not endorse or recommend any securities or other investments.
Any recommendation contained in this report may not
be suitable for all investors and it is not to be deemed
an offer or solicitation on our part with respect to
the purchase or sale of any securities. All trademarks,
service marks and trade names appearing in this report
are the property of their respective owners, and are
likewise used for identification purposes only.
This report is a service available
only to active Paid Premium Members.
You may opt-out of receiving report notifications
at any time. Questions or comments may be submitted
by writing to Premium Membership Services 665 S.E. 10 Street, Suite 201 Deerfield Beach, FL 33441-5634 or by calling 1-800-965-8307
or 954-785-1121.
|
|
|