You are not logged in.
This means you
CAN ONLY VIEW reports that were published prior to Friday, February 23, 2024.
You
MUST UPGRADE YOUR MEMBERSHIP if you want to see any current reports.
AFTER MARKET UPDATE - WEDNESDAY, AUGUST 26TH, 2020
Previous After Market Report Next After Market Report >>>
|
|
|
|
DOW |
+83.48 |
28,331.92 |
+0.30% |
|
Volume |
745,400,928 |
+4% |
|
Volume |
3,413,843,800 |
-1% |
|
NASDAQ |
+199.00 |
11,665.47 |
+1.74% |
|
Advancers |
1,158 |
39% |
|
Advancers |
1,429 |
43% |
|
S&P 500 |
+35.11 |
3,478.73 |
+1.02% |
|
Decliners |
1,809 |
61% |
|
Decliners |
1,912 |
57% |
|
Russell 2000 |
-11.02 |
1,560.19 |
-0.70% |
|
52 Wk Highs |
89 |
|
|
52 Wk Highs |
184 |
|
|
S&P 600 |
-7.97 |
902.38 |
-0.88% |
|
52 Wk Lows |
11 |
|
|
52 Wk Lows |
10 |
|
|
 |
Leadership Improved but Breadth was Negative as Major Indices Rose
Kenneth J. Gruneisen - Passed the CAN SLIM® Master's Exam
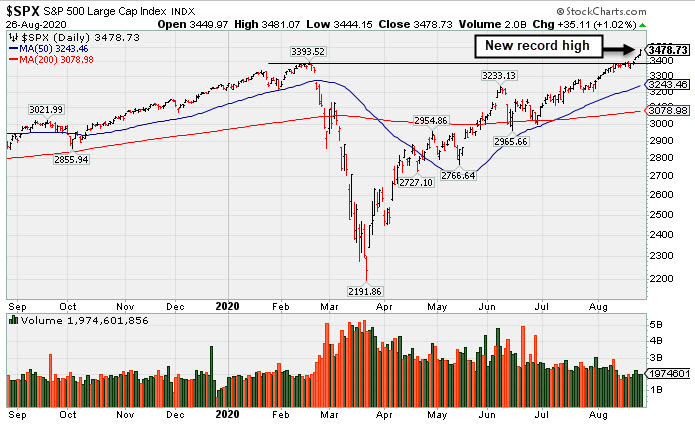
Stocks finished higher on Wednesday, with the S&P 500 climbing 1% to a new record close for the fourth-straight session. The Nasdaq Composite rallied 1.7%, also notching another fresh all-time high. The Dow added 83 points, trimming its year-to-date decline to -0.7%. The reported volume totals were mixed, higher than the prior session total on the NYSE and slightly lower on the Nasdaq exchange. Breadth was negative as decliners led advancers by a 3-2 margin on the NYSE and about a 9-7 margin on the Nasdaq exchange. There were 62 high-ranked companies from the Leaders List that hit new 52-week highs and were listed on the BreakOuts Page, versus the total of 43 on the prior session. New 52-week highs totals expanded and outnumbered new 52-week lows totals on both the NYSE and Nasdaq exchange. The major indices are in a confirmed uptrend (M criteria). Any sustainable rally requires a healthy crop of new leaders, so it remains ever-important to see substantial new highs totals.
Charts used courtesy of www.stockcharts.com
PICTURED: The S&P 500 Index had lighter volume behind its 5th consecutive gain for a new record high.
The MSCI All-Country World Index also advanced, surpassing its pre-pandemic record level. Investors are anxiously awaiting tomorrow’s remarks from Federal Reserve Chair Jerome Powell during the virtual Jackson Hole symposium. The speech is anticipated to shed light on the central bank’s policy framework review.
Six of 11 S&P 500 sectors closed in positive territory, with the Communication Services group pacing gains, up 3.7%. Netflix (NFLX +11.61%) and Roku (ROKU +11.17%) each posted double-digit gains on positive Wall Street analyst commentary. Technology shares also outperformed, with soon-to-be Dow constituent Salesforce.com (CRM +26.04%) rallying considerably after raising its annual revenue forecast. In other earnings, Nordstrom (JWN -5.47%) fell following a wider-than-anticipated quarterly loss.
On the data front, a preliminary reading showed durable goods orders surged 11.2% in July, more than double expectations, largely due to strong demand for motor vehicles. Additional reports showed non-defense capital goods orders and shipments both increased more than forecasted last month but slowed from June’s rebound. Treasuries pared their decline, with the yield on the 10-year note up one basis point to 0.69%.
In commodities, WTI crude ended little changed despite storm-related supply disruptions in the Gulf Coast region and official government data indicating a larger-than-anticipated drawdown in U.S. crude stockpiles. Market participants are keeping an eye on Hurricane Laura, which strengthened to a category 4 storm.
|
 Kenneth J. Gruneisen started out as a licensed stockbroker in August 1987, a couple of months prior to the historic stock market crash that took the Dow Jones Industrial Average down -22.6% in a single day. He has published daily fact-based fundamental and technical analysis on high-ranked stocks online for two decades. Through FACTBASEDINVESTING.COM, Kenneth provides educational articles, news, market commentary, and other information regarding proven investment systems that work in good times and bad.
Comments contained in the body of this report are technical opinions only and are not necessarily those of Gruneisen Growth Corp. The material herein has been obtained from sources believed to be reliable and accurate, however, its accuracy and completeness cannot be guaranteed. Our firm, employees, and customers may effect transactions, including transactions contrary to any recommendation herein, or have positions in the securities mentioned herein or options with respect thereto. Any recommendation contained in this report may not be suitable for all investors and it is not to be deemed an offer or solicitation on our part with respect to the purchase or sale of any securities. |
|
 |
Retail Index and Gold & Silver Index Posted Standout Gains
Kenneth J. Gruneisen - Passed the CAN SLIM® Master's Exam
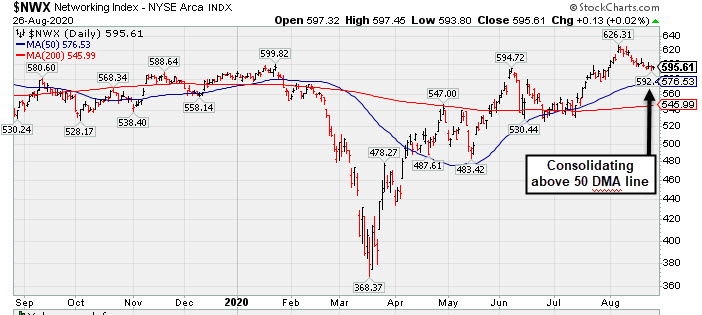
The Retail Index ($RLX +2.14%) posted a solid gain that helped boost the major indices, but the Bank Index ($BKX -1.65%) outpaced the Broker/Dealer Index ($XBD -0.27%) to the downside as both financial indexes ended the session in the red. Commodity-linked groups were mixed as the Oil Services Index ($OSX -3.10%) and Integrated Oil Index ($XOI -2.12%) both slumped, meanwhile, the Gold & Silver Index ($XAU +3.11%) posted a standout gain. The tech sector was mixed as the Semiconductor Index ($SOX +0.28%) inched higher and Networking Index ($NWX +0.02%) finished flat but the Biotech Index ($BTK -0.64%) edged lower.
PICTURED: The Networking Index ($NWX +0.02%) is consolidating well above its 50-day moving average (DMA) line where it found prompt support on recent pullbacks.
| Oil Services |
$OSX |
35.62 |
-1.14 |
-3.10% |
-54.50% |
| Integrated Oil |
$XOI |
724.45 |
-15.68 |
-2.12% |
-42.98% |
| Semiconductor |
$SOX |
2,249.34 |
+6.28 |
+0.28% |
+21.61% |
| Networking |
$NWX |
595.61 |
+0.13 |
+0.02% |
+2.09% |
| Broker/Dealer |
$XBD |
294.04 |
-0.81 |
-0.27% |
+1.26% |
| Retail |
$RLX |
3,629.33 |
+75.96 |
+2.14% |
+48.18% |
| Gold & Silver |
$XAU |
150.50 |
+4.54 |
+3.11% |
+40.76% |
| Bank |
$BKX |
76.07 |
-1.28 |
-1.65% |
-32.90% |
| Biotech |
$BTK |
5,352.39 |
-34.68 |
-0.64% |
+5.62% |
|
|
|
 |
Found Support Near 50 DMA Line But Latest Earnings Were Sub Par
Kenneth J. Gruneisen - Passed the CAN SLIM® Master's Exam
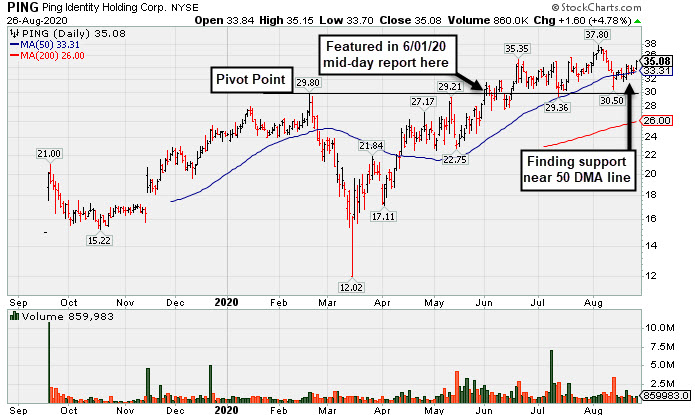
Ping Identity Hldg Corp (PING +$1.60 or +4.78% to $35.08) rebound further above its 50-day moving average (DMA) line ($33.31) with today's gain backed by higher (but still below average) volume. Its prompt repair of the recent 50 DMA line breach helped its technical stance improve. However, it recently reported Jun '20 quarterly earnings -27% on -6% sales revenues versus the year ago period, below the +25% minimum earnings guideline, raising fundamental concerns. The next important near-term support below the 50 DMA line is the prior highs in the $29 area. It completed Secondary Offerings on 7/09/20 and 5/15/20.
PING was last shown in this FSU section on 8/10/20 with an annotated graph under the headline, "Perched Near High With Earnings News Due Wednesday Evening". It was highlighted in yellow with new pivot point cited based on its 2/20/20 high plus 10 cents in the 6/01/20 mid-day report (read here). The gain above the pivot point on 6/18/20 was backed by +127% above average volume triggering a technical buy signal as it hit a new 52-week high (N criteria).
Its $15 IPO was completed on 9/19/19. The number of top-rated funds owning its shares rose from 83 in Sep '19 to 192 in Jun '20, a reassuring sign concerning the I criteria. Its current Up/Down Volume Ratio of 1.5 is an unbiased indication its shares have been under accumulation over the past 50 days.
Limited earnings history was previously noted as a concern. The Computer Software-Security firm had reported strong earnings results well above the +25% minimum guideline (C criteria) in the 4 latest quarterly comparisons through Mar '20 versus the year ago periods. Leadership in the Computer Software - Security industry group (L criteria) is a reassuring sign. The group is currently ranked 36th of the 197 industry groups.
|
|
|
Color Codes Explained :
Y - Better candidates highlighted by our
staff of experts.
G - Previously featured
in past reports as yellow but may no longer be buyable under the
guidelines.
***Last / Change / Volume data in this table is the closing quote data***
Symbol/Exchange
Company Name
Industry Group |
PRICE |
CHANGE
(%Change) |
Day High |
Volume
(% DAV)
(% 50 day avg vol) |
52 Wk Hi
% From Hi |
Featured
Date |
Price
Featured |
Pivot Featured |
|
Max Buy |
 CRL
-
NYSE
CRL
-
NYSE
Charles River Labs Intl
DRUGS - Biotechnology
|
$218.60
|
+1.54
0.71% |
$218.98
|
225,354
63.12% of 50 DAV
50 DAV is 357,000
|
$221.97
-1.52%
|
7/15/2020
|
$192.66
|
PP = $189.95
|
|
MB = $199.45
|
Most Recent Note - 8/25/2020 6:20:19 PM
G - Volume totals have been cooling while still hovering near its all-time high. The 50 DMA line ($195.66) defines initial support to watch above the prior high ($189.85 on 6/03/20). Recently reported Jun '20 quarterly earnings -3% on +4% sales revenues, below the +25% minimum guideline (C criteria), but better than expected while the company also raised its guidance. See the latest FSU analysis for more details and a new annotated graph.
>>> FEATURED STOCK ARTICLE : Volume Totals Cooling While Hovering in Tight Range Near Record High - 8/25/2020 |
View all notes |
Set NEW NOTE alert |
Company Profile |
SEC
News |
Chart |
Request a new note
C
A
S
I |
EBS
-
NYSE
Emergent Biosolutions
DRUGS - Biotechnology
|
$123.73
|
+0.14
0.11% |
$124.60
|
416,232
42.47% of 50 DAV
50 DAV is 980,000
|
$137.61
-10.09%
|
7/7/2020
|
$89.47
|
PP = $93.68
|
|
MB = $98.36
|
 Most Recent Note - 8/26/2020 7:06:58 PM
G - Volume totals have still been cooling while it remains perched near its all-time high, very extended from any sound base. Bullish action came after it reported Jun '20 quarterly earnings +890% on +62% sales revenue for the Jun '20 quarter versus the year ago period. Its 50 DMA line ($102.43) defines support to watch above prior highs in the $93 area.
>>> FEATURED STOCK ARTICLE : High Ranked Biomed Leader is Extended From Prior Base - 8/21/2020 |
View all notes |
Set NEW NOTE alert |
Company Profile |
SEC
News |
Chart |
Request a new note
C
A
S
I |
AMD
-
NASDAQ
Advanced Micro Devices
ELECTRONICS - Semiconductor - Broad Line
|
$86.02
|
-0.33
-0.38% |
$87.72
|
46,862,290
75.39% of 50 DAV
50 DAV is 62,159,000
|
$87.29
-1.45%
|
7/22/2020
|
$61.73
|
PP = $59.10
|
|
MB = $62.06
|
Most Recent Note - 8/25/2020 6:31:21 PM
G - Posted a solid gain today with light volume for its 2nd best ever close. Volume totals have been cooling while stubbornly holding its ground perched near its all-time high, very extended from the previously noted base. The recent low ($76.10 on 8/11/20) defines near-term support above its 50 DMA line ($66.28). Fundamentals remain strong.
>>> FEATURED STOCK ARTICLE : AMD Rose +46% Since First Featured on June 9th - 8/14/2020 |
View all notes |
Set NEW NOTE alert |
Company Profile |
SEC
News |
Chart |
Request a new note
C
A
S
I |
TREX
-
NYSE
Trex Company Inc
MATERIALS and CONSTRUCTION - General Building Materials
|
$148.11
|
+0.90
0.61% |
$148.96
|
345,063
42.81% of 50 DAV
50 DAV is 806,000
|
$153.16
-3.30%
|
6/26/2020
|
$109.05
|
PP = $132.94
|
|
MB = $139.59
|
Most Recent Note - 8/25/2020 6:44:45 PM
G - Pulled back from its all-time high with today's loss backed by higher (but still below average) volume. It is extended from any sound base. Reported Jun '20 quarterly earnings +27% on +7% sales revenues versus the year ago period. Important near-term support is at its 50 DMA line ($133.80).
>>> FEATURED STOCK ARTICLE : Wedging Into New High Territory After Latest Earnings Report - 8/19/2020 |
View all notes |
Set NEW NOTE alert |
Company Profile |
SEC
News |
Chart |
Request a new note
C
A
S
I |
NFLX
-
NASDAQ
Netflix Inc
SPECIALTY RETAIL - Music and Video Stores
|
$547.53
|
+56.95
11.61% |
$549.04
|
20,126,679
272.76% of 50 DAV
50 DAV is 7,379,000
|
$575.37
-4.84%
|
5/14/2020
|
$441.95
|
PP = $449.62
|
|
MB = $472.10
|
Most Recent Note - 8/26/2020 12:23:41 PM
G - Posting a solid volume-driven gain today with volume running at an above average pace. Found support near its 50 DMA line ($488) on consolidations during its ongoing ascent. It did not form a sound base and some resistance remains due to overhead supply up to the $575 level. Fundamentals remain strong.
>>> FEATURED STOCK ARTICLE : 50-Day Moving Average Acted As Support Level - 8/18/2020 |
View all notes |
Set NEW NOTE alert |
Company Profile |
SEC
News |
Chart |
Request a new note
C
A
S
I |
Symbol/Exchange
Company Name
Industry Group |
PRICE |
CHANGE
(%Change) |
Day High |
Volume
(% DAV)
(% 50 day avg vol) |
52 Wk Hi
% From Hi |
Featured
Date |
Price
Featured |
Pivot Featured |
|
Max Buy |
CHGG
-
NYSE
Chegg Inc
Consumer Svcs-Education
|
$76.34
|
+0.86
1.14% |
$76.98
|
2,712,729
71.71% of 50 DAV
50 DAV is 3,783,000
|
$89.82
-15.01%
|
6/17/2020
|
$63.71
|
PP = $68.08
|
|
MB = $71.48
|
Most Recent Note - 8/25/2020 6:42:49 PM
G - Suffered a big loss on the prior session with volume +42% above average, testing support near its 50 DMA line ($73.81). Its 50 DMA line defines important support to watch above its prior high in the $68 area. More damaging losses leading to violations would raise concerns and trigger technical sell signals. Reported Jun '20 quarterly earnings +61% on +63% sales revenues versus the year ago period. See the latest FSU analysis for more details and an annotated graph.
>>> FEATURED STOCK ARTICLE : Volume-Driven Loss Tests Support at 50-Day Moving Average - 8/24/2020 |
View all notes |
Set NEW NOTE alert |
Company Profile |
SEC
News |
Chart |
Request a new note
C
A
S
I |
LGIH
-
NASDAQ
L G I Homes Inc
Bldg-Resident/Comml
|
$114.86
|
-2.67
-2.27% |
$118.67
|
171,360
53.38% of 50 DAV
50 DAV is 321,000
|
$123.94
-7.33%
|
7/7/2020
|
$99.19
|
PP = $95.82
|
|
MB = $100.61
|
Most Recent Note - 8/26/2020 7:03:50 PM
G - Volume totals have been cooling while still hovering near its 52-week high, showing resilience after its latest earnings report. It is extended from the previously noted base, meanwhile, its 50 DMA line ($105.28) defines near-term support to watch above the prior low ($104.24 on 8/11/20). Reported Jun '20 quarterly earnings +21% on +4% sales revenues, breaking a streak of 4 comparisons above the +25% minimum guideline (C criteria).
>>> FEATURED STOCK ARTICLE : Leadership in Building - Residential/Commercial Group Improving - 8/20/2020 |
View all notes |
Set NEW NOTE alert |
Company Profile |
SEC
News |
Chart |
Request a new note
C
A
S
I |
NOW
-
NYSE
Servicenow Inc
Computer Sftwr-Enterprse
|
$487.70
|
+29.77
6.50% |
$488.58
|
2,156,116
124.92% of 50 DAV
50 DAV is 1,726,000
|
$458.88
6.28%
|
8/20/2020
|
$453.34
|
PP = $454.79
|
|
MB = $477.53
|
Most Recent Note - 8/26/2020 12:26:12 PM
G - Hitting a new all-time high while rallying above its "max buy" level with today's big gain and its color code is changed to green. Its 50 DMA line ($426) defines important near-term support to watch. Reported Jun '20 quarterly earnings +73% on +28% sales revenues versus the year ago period.
>>> FEATURED STOCK ARTICLE : Consolidating Above 50-Day Average After Another Strong Quarter - 8/13/2020 |
View all notes |
Set NEW NOTE alert |
Company Profile |
SEC
News |
Chart |
Request a new note
C
A
S
I |
TTD
-
NASDAQ
The Trade Desk Inc Cl A
Comml Svcs-Advertising
|
$481.04
|
+11.14
2.37% |
$491.00
|
936,083
68.28% of 50 DAV
50 DAV is 1,371,000
|
$510.00
-5.68%
|
6/3/2020
|
$340.61
|
PP = $327.35
|
|
MB = $343.72
|
Most Recent Note - 8/26/2020 7:08:41 PM
G - Volume totals have been cooling in recent weeks while holding its ground perched near its all-time high. Recently reported Jun '20 quarterly earnings -3% on -13% sales revenues versus the year ago period, raising fundamental concerns. It is extended from any sound base of sufficient length. Its 50 DMA line ($443) defines near-term support above the prior low ($404 on 7/24/20) where violations may trigger technical sell signals.
>>> FEATURED STOCK ARTICLE : Hovering Near High After Latest Quarterly Report Raised Concerns - 8/12/2020 |
View all notes |
Set NEW NOTE alert |
Company Profile |
SEC
News |
Chart |
Request a new note
C
A
S
I |
DOCU
-
NASDAQ
Docusign Inc
Computer Sftwr-Enterprse
|
$214.41
|
+9.32
4.54% |
$218.42
|
3,551,742
73.61% of 50 DAV
50 DAV is 4,825,000
|
$229.83
-6.71%
|
6/10/2020
|
$149.73
|
PP = $152.10
|
|
MB = $159.71
|
Most Recent Note - 8/26/2020 7:05:23 PM
G - Posted a big gain today with higher (but below average) volume. It has not formed a sound base of sufficient length. Its 50 DMA line ($196) and prior low ($189.12 on 8/12/20) define important near-term support to watch.
>>> FEATURED STOCK ARTICLE : Consolidating Above 50-Day Moving Average Line and Recent Low - 8/17/2020 |
View all notes |
Set NEW NOTE alert |
Company Profile |
SEC
News |
Chart |
Request a new note
C
A
S
I |
Symbol/Exchange
Company Name
Industry Group |
PRICE |
CHANGE
(%Change) |
Day High |
Volume
(% DAV)
(% 50 day avg vol) |
52 Wk Hi
% From Hi |
Featured
Date |
Price
Featured |
Pivot Featured |
|
Max Buy |
PING
-
NYSE
Ping Identity Holdings Corp
Computer Sftwr-Security
|
$35.08
|
+1.60
4.78% |
$35.15
|
859,421
65.17% of 50 DAV
50 DAV is 1,318,700
|
$37.80
-7.20%
|
6/1/2020
|
$29.24
|
PP = $29.90
|
|
MB = $31.40
|
Most Recent Note - 8/26/2020 7:01:15 PM
G - Posted a solid gain today with below average volume. Found prompt support near its 50 DMA line ($33.31) recently amid weakness after it reported Jun '20 quarterly earnings -27% on -6% sales revenues versus the year ago period, below the +25% minimum earnings guideline, raising fundamental concerns. The next important near-term support below the 50 DMA line is the prior highs in the $29 area. It completed Secondary Offerings on 7/09/20 and 5/15/20. See the latest FSU analysis for more details and a new annotated graph.
>>> FEATURED STOCK ARTICLE : Found Support Near 50 DMA Line But Latest Earnings Were Sub Par - 8/26/2020 |
View all notes |
Set NEW NOTE alert |
Company Profile |
SEC
News |
Chart |
Request a new note
C
A
S
I |
|
|
|
THESE ARE NOT BUY RECOMMENDATIONS!
Comments contained in the body of this report are technical
opinions only. The material herein has been obtained
from sources believed to be reliable and accurate, however,
its accuracy and completeness cannot be guaranteed.
This site is not an investment advisor, hence it does
not endorse or recommend any securities or other investments.
Any recommendation contained in this report may not
be suitable for all investors and it is not to be deemed
an offer or solicitation on our part with respect to
the purchase or sale of any securities. All trademarks,
service marks and trade names appearing in this report
are the property of their respective owners, and are
likewise used for identification purposes only.
This report is a service available
only to active Paid Premium Members.
You may opt-out of receiving report notifications
at any time. Questions or comments may be submitted
by writing to Premium Membership Services 665 S.E. 10 Street, Suite 201 Deerfield Beach, FL 33441-5634 or by calling 1-800-965-8307
or 954-785-1121.
|
|
|