You are not logged in.
This means you
CAN ONLY VIEW reports that were published prior to Saturday, February 24, 2024.
You
MUST UPGRADE YOUR MEMBERSHIP if you want to see any current reports.
AFTER MARKET UPDATE - MONDAY, AUGUST 26TH, 2019
Previous After Market Report Next After Market Report >>>
|
|
|
|
DOW |
+269.93 |
25,898.83 |
+1.05% |
|
Volume |
706,351,590 |
-27% |
|
Volume |
1,680,085,131 |
-24% |
|
NASDAQ |
+101.97 |
7,853.74 |
+1.32% |
|
Advancers |
1,892 |
66% |
|
Advancers |
2,017 |
66% |
|
S&P 500 |
+31.27 |
2,878.38 |
+1.10% |
|
Decliners |
970 |
34% |
|
Decliners |
1,051 |
34% |
|
Russell 2000 |
+16.52 |
1,476.00 |
+1.13% |
|
52 Wk Highs |
61 |
|
|
52 Wk Highs |
36 |
|
|
S&P 600 |
+9.41 |
905.91 |
+1.05% |
|
52 Wk Lows |
133 |
|
|
52 Wk Lows |
138 |
|
|
 |
Major Indices Rose With Less Leadership and Lighter Volume
Kenneth J. Gruneisen - Passed the CAN SLIM® Master's Exam
The Dow climbed 269 points, while the S&P 500 gained 1.1%. The Nasdaq Composite was up 1.3%. Volume totals reported were noticeably lighter than the prior session totals on the NYSE and on the Nasdaq exchange, revealing a lack of institutional buying demand. Breadth tilted to the positive side as advancers led decliners by near a 2-1 margin on the NYSE and on the Nasdaq exchange. Leadership thinned as only 5 high-ranked companies from the Leaders List hit new 52-week highs and were listed on the BreakOuts Page, versus the total of 35 on the prior session. New 52-week lows outnumbered shrinking new 52-week highs totals on both the NYSE and Nasdaq exchange. A follow-through day on 8/13/19 marked a bullish shift concerning the M criteria of the fact-based investment system, but the market faced immediate pressure. Investors have a green light to make carefully selected new buying efforts, however, subsequent losses below prior low for the Nasdaq Composite Index would technically kill the new rally. The Featured Stocks Page provides the most timely analysis on high-ranked leaders.Charts used courtesy of www.stockcharts.com
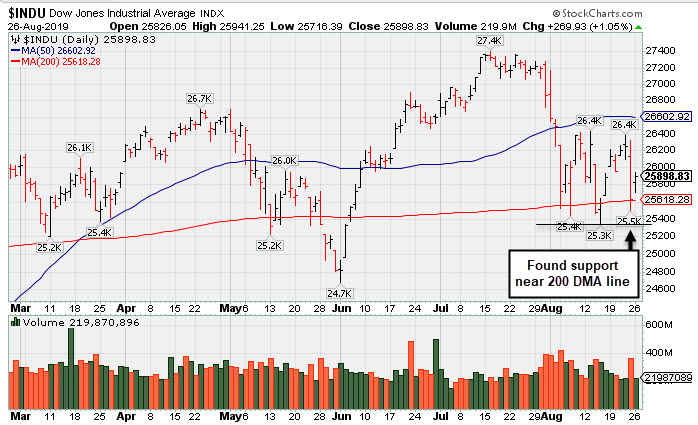
PICTURED: The Dow Jones Industrial Average has recently found support near its 200-day moving average (DMA) line. More damaging losses would raise concerns and prompt investors to reduce their exposure to stocks.
Stocks finished higher Monday as positive trade headlines lifted investor sentiment. President Trump reported that China asked to “get back to the table” and resume negotiations. This followed Friday’s downbeat session that capped a fourth consecutive weekly decline for stocks, the longest such streak for the S&P 500 since 2011. The major averages had been set for weekly gains of at least 1% until China announced retaliatory tariffs on another round of U.S. goods Friday, sending the Dow sliding more than 600 points.
Treasuries were slightly weaker Monday, with the yield on the 10-year note up two basis points to 1.54%. On the data front, a preliminary reading of durable goods orders jumped 2.1% in July, well above expectations of a 1.2% increase. Another report showed core capital goods shipments fell 0.7% last month, the largest decline since October 2016. A separate release from the Dallas Fed revealed manufacturing activity in the region improved in August, with the gauge rising into positive territory for the first time in four months. In commodities, WTI crude erased early session gains to fall 1% to $53.64/barrel, its fifth straight daily loss, and the longest such stretch since November 2018.
In corporate news, Celgene (CELG +3.20%) rose after agreeing to sell its psoriasis drug to Amgen (AMGN +3.18%) for $13.4 billion. This sent shares of Bristol-Myers Squibb (BMY +3.28%) as the antitrust sale should help secure regulatory approval for its proposed acquisition of Celgene.
|
 Kenneth J. Gruneisen started out as a licensed stockbroker in August 1987, a couple of months prior to the historic stock market crash that took the Dow Jones Industrial Average down -22.6% in a single day. He has published daily fact-based fundamental and technical analysis on high-ranked stocks online for two decades. Through FACTBASEDINVESTING.COM, Kenneth provides educational articles, news, market commentary, and other information regarding proven investment systems that work in good times and bad.
Comments contained in the body of this report are technical opinions only and are not necessarily those of Gruneisen Growth Corp. The material herein has been obtained from sources believed to be reliable and accurate, however, its accuracy and completeness cannot be guaranteed. Our firm, employees, and customers may effect transactions, including transactions contrary to any recommendation herein, or have positions in the securities mentioned herein or options with respect thereto. Any recommendation contained in this report may not be suitable for all investors and it is not to be deemed an offer or solicitation on our part with respect to the purchase or sale of any securities. |
|
 |
Financial, Retail, and Tech Indexes Rose
Kenneth J. Gruneisen - Passed the CAN SLIM® Master's Exam
The financial indexes both posted gains as the Bank Index ($BKX +0.94%) and Broker/Dealer Index ($XBD +0.55%) both were higher, and the Retail Index ($RLX +0.91%) also rose. The tech sector had a positive bias as the Semiconductor Index ($SOX +0.86%), Biotech Index ($BTK +0.31%) and the Networking Index ($NWX +0.59%) each posted gains. Commodity-linked groups indecisive as the Integrated Oil Index ($XOI +0.37%) inched higher and the Oil Services Index ($OSX -0.21%) and the Gold & Silver Index ($XAU -0.09%) both ended the session slightly lower.
Charts courtesy of www.stockcharts.com
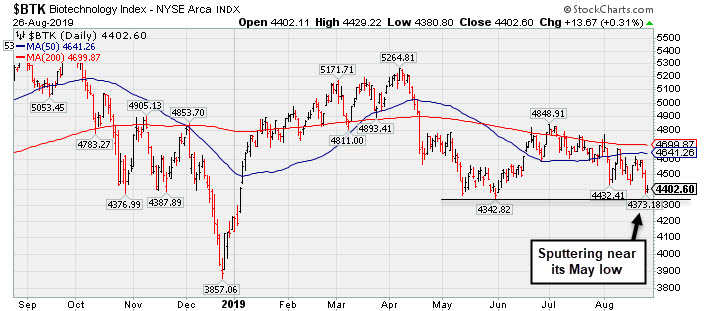
PICTURED: The Biotech Index ($BTK -2.59%) is sputtering near its May low.
| Oil Services |
$OSX |
60.24 |
-0.13 |
-0.22% |
-25.26% |
| Integrated Oil |
$XOI |
1,134.10 |
+4.17 |
+0.37% |
-2.16% |
| Semiconductor |
$SOX |
1,458.88 |
+12.50 |
+0.86% |
+26.29% |
| Networking |
$NWX |
539.61 |
+3.19 |
+0.59% |
+10.42% |
| Broker/Dealer |
$XBD |
248.97 |
+1.36 |
+0.55% |
+4.90% |
| Retail |
$RLX |
2,305.89 |
+20.77 |
+0.91% |
+18.17% |
| Gold & Silver |
$XAU |
97.70 |
-0.08 |
-0.08% |
+38.27% |
| Bank |
$BKX |
90.41 |
+0.84 |
+0.94% |
+5.39% |
| Biotech |
$BTK |
4,402.60 |
+13.67 |
+0.31% |
+4.31% |
|
|
|
 |
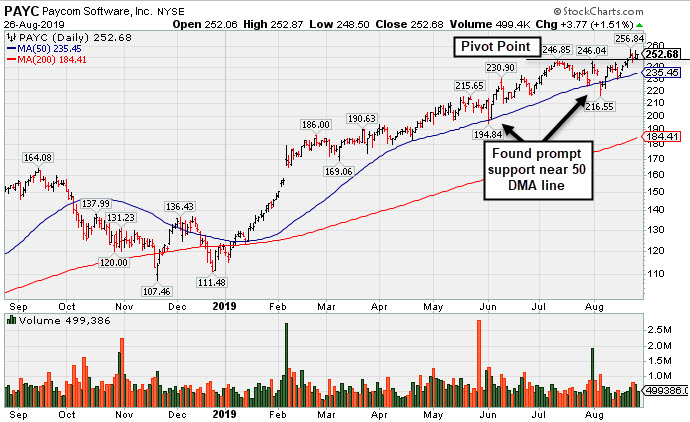
Recently Wedged Higher Without Great Volume Conviction
Kenneth J. Gruneisen - Passed the CAN SLIM® Master's Exam
Paycom Software Inc (PAYC $252.68 +$3.77 +1.51%) has recently wedged above the new pivot point cited based on its 7/11/19 high plus 10 cents. It quietly hit a new all-time high gains lacking great volume conviction. Gains above a stock's pivot must have at least +40% above average volume to trigger a proper new (or add-on) technical buy signal. Its 50-day moving average (DMA) line ($235) defines support above the recent low ($216.55 on 8/05/19). It found support near its 50 DMA line during consolidations throughout this year's ongoing ascent.
The Computer Software - Enterprise firm was last shown in this FSU section on 8/02/19 under the headline "Found Support and Gapped Up Following Earnings Report" It was highlighted in yellow with new pivot point cited based on its 9/14/18 high plus 10 cents in the 2/06/19 mid-day report (read here). A "breakaway gap" cleared all overhead supply and triggered a technical buy signal.
The current Up/Down Volume Ratio of 1.3 is an unbiased indication its shares have been under accumulation over the past 50 days. Its small supply of only 58.4 million shares outstanding (S criteria) can contribute to greater price volatility in the event of institutional buying or selling. The number of top-rated funds owning its shares rose from 384 in Jun '17 to 718 in Jun '19, a reassuring sign concerning the I criteria. It has a Timeliness rating of A and Sponsorship rating of B. It completed Secondary Offerings on 11/13/15, 9/16/15, 5/15/15 and 1/14/15 since its $15 IPO on 4/15/14.
|
|
|
Color Codes Explained :
Y - Better candidates highlighted by our
staff of experts.
G - Previously featured
in past reports as yellow but may no longer be buyable under the
guidelines.
***Last / Change / Volume data in this table is the closing quote data***
Symbol/Exchange
Company Name
Industry Group |
PRICE |
CHANGE
(%Change) |
Day High |
Volume
(% DAV)
(% 50 day avg vol) |
52 Wk Hi
% From Hi |
Featured
Date |
Price
Featured |
Pivot Featured |
|
Max Buy |
 EPAM
-
NYSE
EPAM
-
NYSE
Epam Systems Inc
COMPUTER SOFTWARE and SERVICES - Information Technology Service
|
$188.97
|
+0.73
0.39% |
$191.42
|
349,695
84.88% of 50 DAV
50 DAV is 412,000
|
$201.00
-5.99%
|
5/9/2019
|
$169.25
|
PP = $180.55
|
|
MB = $189.58
|
Most Recent Note - 8/23/2019 6:31:38 PM
G - Pulled back toward its 50 DMA line ($186). It has not formed a new base of sufficient length and faces some resistance due to overhead supply up to the $201 level. Reported earnings +27% on +24% sales revenues for the Jun '19 quarter.
>>> FEATURED STOCK ARTICLE : Rebounded Above 50-Day Average Following Earnings Report - 8/12/2019 |
View all notes |
Set NEW NOTE alert |
Company Profile |
SEC
News |
Chart |
Request a new note
C
A
S
I |
AUDC
-
NASDAQ
Audiocodes Ltd
ELECTRONICS - Scientific and Technical Instrum
|
$17.20
|
-0.09
-0.52% |
$17.44
|
54,207
30.63% of 50 DAV
50 DAV is 177,000
|
$19.74
-12.87%
|
7/15/2019
|
$17.10
|
PP = $17.54
|
|
MB = $18.42
|
Most Recent Note - 8/23/2019 6:28:54 PM
Y - Support is defined by prior highs in the $17 area and its 50 DMA line ($17.01). More damaging losses would raise concerns and trigger technical sell signals. Reported earnings +57% on +14% sales revenues for the Jun '19 quarter, continuing its strong earnings track record.
>>> FEATURED STOCK ARTICLE : Volume Totals Cooling as Bullish Action Continues - 8/13/2019 |
View all notes |
Set NEW NOTE alert |
Company Profile |
SEC
News |
Chart |
Request a new note
C
A
S
I |
LHCG
-
NASDAQ
L H C Group Inc
HEALTH SERVICES - Home Health Care
|
$119.33
|
+0.28
0.24% |
$120.71
|
140,173
62.02% of 50 DAV
50 DAV is 226,000
|
$129.37
-7.76%
|
7/1/2019
|
$110.94
|
PP = $122.20
|
|
MB = $128.31
|
 Most Recent Note - 8/26/2019 5:34:55 PM
G - Still quietly sputtering just below its 50 DMA line ($120.92) and below its pivot point. Any breach of recent low ($116.67 on 8/13/19) could raise more serious concerns.
>>> FEATURED STOCK ARTICLE : Sputtering Below 50-Day Average and Below Pivot Point - 8/20/2019 |
View all notes |
Set NEW NOTE alert |
Company Profile |
SEC
News |
Chart |
Request a new note
C
A
S
I |
CHDN
-
NASDAQ
Churchill Downs Inc
LEISURE - Gaming Activities
|
$123.80
|
+2.51
2.07% |
$124.29
|
299,404
129.61% of 50 DAV
50 DAV is 231,000
|
$132.73
-6.73%
|
7/22/2019
|
$118.45
|
PP = $118.89
|
|
MB = $124.83
|
Most Recent Note - 8/26/2019 5:32:08 PM
Y - Posted a gain today with above average volume. Found support near its 50 DMA line ($117). The prior low ($113.88 on 8/05/19) defines the next important near-term support to watch. Reported Jun '19 earnings rose +10% on +26% sales revenues versus the year ago period, below the +25% minimum earnings guideline (C criteria).
>>> FEATURED STOCK ARTICLE : Recently Found Support at 50-Day Moving Average - 8/14/2019 |
View all notes |
Set NEW NOTE alert |
Company Profile |
SEC
News |
Chart |
Request a new note
C
A
S
I |
LULU
-
NASDAQ
Lululemon Athletica
MANUFACTURING - Textile Manufacturing
|
$182.35
|
+2.32
1.29% |
$182.98
|
796,039
47.27% of 50 DAV
50 DAV is 1,684,000
|
$194.25
-6.13%
|
6/13/2019
|
$174.48
|
PP = $179.60
|
|
MB = $188.58
|
Most Recent Note - 8/26/2019 5:51:19 PM
G - Met resistance, but a convincing rebound above the 50 DMA line ($184) is needed to help its technical stance improve, and it faces near-term resistance up to the $194 level. Reported Apr '19 quarterly earnings +35% on +20% sales revenues versus the year ago period.
>>> FEATURED STOCK ARTICLE : Sputtering After Slump Below 50-Day Moving Average - 8/15/2019 |
View all notes |
Set NEW NOTE alert |
Company Profile |
SEC
News |
Chart |
Request a new note
C
A
S
I |
Symbol/Exchange
Company Name
Industry Group |
PRICE |
CHANGE
(%Change) |
Day High |
Volume
(% DAV)
(% 50 day avg vol) |
52 Wk Hi
% From Hi |
Featured
Date |
Price
Featured |
Pivot Featured |
|
Max Buy |
ULTA
-
NASDAQ
Ulta Beauty Inc
SPECIALTY RETAIL - Specialty Retail, Other
|
$330.22
|
+8.12
2.52% |
$331.99
|
997,997
142.77% of 50 DAV
50 DAV is 699,000
|
$368.83
-10.47%
|
3/15/2019
|
$341.27
|
PP = $322.59
|
|
MB = $338.72
|
Most Recent Note - 8/26/2019 5:53:36 PM
G - A rebound above its 50 DMA line ($345) is needed for its outlook to improve. Recently found support above its 200 DMA line ($319) following volume-driven losses, but more damaging losses would raise serious concerns. Due to report earnings on 8/29/19. Volume and volatility often increase near earnings news. The Apr '19 quarter was below the +25% minimum earnings guideline (C criteria) which already raised fundamental concerns.
>>> FEATURED STOCK ARTICLE : Ulta Beauty Sputtering Below 50-Day Moving Average - 8/7/2019 |
View all notes |
Set NEW NOTE alert |
Company Profile |
SEC
News |
Chart |
Request a new note
C
A
S
I |
CHGG
-
NYSE
Chegg Inc
Consumer Svcs-Education
|
$40.42
|
+0.37
0.92% |
$40.67
|
980,989
63.54% of 50 DAV
50 DAV is 1,544,000
|
$48.22
-16.18%
|
7/8/2019
|
$44.11
|
PP = $41.79
|
|
MB = $43.88
|
Most Recent Note - 8/26/2019 5:33:01 PM
G - Remains below its 50 DMA line ($41.79) which acted as resistance after recent losses on higher volume. A rebound above the 50 DMA line is needed for its outlook to improve. Reported earnings +92% on +26% sales revenues for the Jun '19 quarter.
>>> FEATURED STOCK ARTICLE : Consolidating Above Prior Highs and 50-Day Average - 8/6/2019 |
View all notes |
Set NEW NOTE alert |
Company Profile |
SEC
News |
Chart |
Request a new note
C
A
S
I |
VEEV
-
NYSE
Veeva Systems Inc Cl A
Computer Sftwr-Medical
|
$162.67
|
+4.54
2.87% |
$163.18
|
1,255,372
95.76% of 50 DAV
50 DAV is 1,311,000
|
$176.90
-8.04%
|
5/30/2019
|
$154.32
|
PP = $145.80
|
|
MB = $153.09
|
Most Recent Note - 8/26/2019 5:52:23 PM
G - Its 50 DMA line ($165) acted as resistance after volume-driven losses. A rebound above the 50 DMA line is needed for its outlook to improve. Fundamentals remain strong.
>>> FEATURED STOCK ARTICLE : Met Resistance After Slumping Below 50-Day Moving Average - 8/23/2019 |
View all notes |
Set NEW NOTE alert |
Company Profile |
SEC
News |
Chart |
Request a new note
C
A
S
I |
PAYC
-
NYSE
Paycom Software Inc
COMPUTER SOFTWARE and SERVICES - Application Software
|
$252.68
|
+3.77
1.51% |
$252.87
|
499,380
80.94% of 50 DAV
50 DAV is 617,000
|
$256.84
-1.62%
|
8/20/2019
|
$246.97
|
PP = $246.95
|
|
MB = $259.30
|
Most Recent Note - 8/26/2019 5:29:04 PM
Y - Wedged higher with recent gains lacking volume. Color code was changed to yellow with new pivot point cited based on its 7/11/19 high plus 10 cents. Gains above a stock's pivot must have at least +40% above average volume to trigger a proper new (or add-on) technical buy signal. Its 50 DMA line ($235) defines support above the recent low ($216.55 on 8/05/19). Reported earnings +27% on +31% sales revenues for the Jun '19 quarter, continuing its strong earnings track record. See the latest FSU analysis for more details and a new annotated graph.
>>> FEATURED STOCK ARTICLE : Recently Wedged Higher Without Great Volume Conviction - 8/26/2019 |
View all notes |
Set NEW NOTE alert |
Company Profile |
SEC
News |
Chart |
Request a new note
C
A
S
I |
BLD
-
NYSE
Topbuild Corp
Bldg-Constr Prds/Misc
|
$89.55
|
+0.84
0.95% |
$90.05
|
292,566
94.68% of 50 DAV
50 DAV is 309,000
|
$93.59
-4.32%
|
5/17/2019
|
$82.19
|
PP = $87.31
|
|
MB = $91.68
|
Most Recent Note - 8/23/2019 6:30:20 PM
G - Pulled back from its all-time high. Stubbornly held its ground following bullish action after it reported earnings +39% on +9% sales revenues for the Jun '19 quarter versus the year ago period, continuing its strong earnings track record. Its prior highs in the $86 area define initial support to watch above 50 DMA line ($83.89) on pullbacks.
>>> FEATURED STOCK ARTICLE : Topbuild Has 4 Consecutive Weekly Gains and Stubbornly Held Ground - 8/19/2019 |
View all notes |
Set NEW NOTE alert |
Company Profile |
SEC
News |
Chart |
Request a new note
C
A
S
I |
Symbol/Exchange
Company Name
Industry Group |
PRICE |
CHANGE
(%Change) |
Day High |
Volume
(% DAV)
(% 50 day avg vol) |
52 Wk Hi
% From Hi |
Featured
Date |
Price
Featured |
Pivot Featured |
|
Max Buy |
TEAM
-
NASDAQ
Atlassian Corp Plc Cl A
Comp Sftwr-Spec Enterprs
|
$142.86
|
+1.81
1.28% |
$143.00
|
554,240
45.17% of 50 DAV
50 DAV is 1,227,000
|
$149.80
-4.63%
|
5/24/2019
|
$129.52
|
PP = $132.09
|
|
MB = $138.69
|
Most Recent Note - 8/21/2019 6:07:59 PM
G - Found support above its pivot point and at its 50 DMA line ($136.79) in recent weeks but did not form a sound base. Prior low ($130.78 on 7/23/19) defines the next important near-term support to watch where a violation would raise serious concerns and trigger a more worrisome technical sell signal. Reported earnings +43% on +36% sales revenues for the Jun '19 quarter, continuing its strong earnings track record. See the latest FSU analysis for more details and a new annotated graph.
>>> FEATURED STOCK ARTICLE : Consolidating Near High After Recently Finding Support - 8/21/2019 |
View all notes |
Set NEW NOTE alert |
Company Profile |
SEC
News |
Chart |
Request a new note
C
A
S
I |
TTD
-
NASDAQ
The Trade Desk Inc Cl A
Comml Svcs-Advertising
|
$250.86
|
+4.43
1.80% |
$251.98
|
1,203,207
82.87% of 50 DAV
50 DAV is 1,452,000
|
$289.51
-13.35%
|
7/18/2019
|
$240.61
|
PP = $258.10
|
|
MB = $271.01
|
Most Recent Note - 8/23/2019 6:34:19 PM
G - Undercut its 50 DMA line ($248) with a loss raising concerns and its color code is changed to green. The recent low ($239.01 on 8/21/19) defines important near-term support to watch. Violations would raise concerns and trigger technical sell signals. Reported Jun '19 quarterly earnings +58% on +42% sales revenues.
>>> FEATURED STOCK ARTICLE : Consolidating Near 50-Day Moving Average Line - 8/16/2019 |
View all notes |
Set NEW NOTE alert |
Company Profile |
SEC
News |
Chart |
Request a new note
C
A
S
I |
PAGS
-
NYSE
Pagseguro Digital Cl A
Finance-CrdtCard/PmtPr
|
$50.30
|
-0.66
-1.30% |
$51.52
|
1,637,719
70.53% of 50 DAV
50 DAV is 2,322,000
|
$53.43
-5.86%
|
6/25/2019
|
$37.69
|
PP = $40.07
|
|
MB = $42.07
|
Most Recent Note - 8/21/2019 6:25:06 PM
G - Posted a gain today with light volume for its 2nd best close. Noted in prior mid-day reports - "Reported earnings +35% on +39% sales revenues for the quarter ended June 30,2019 versus the year ago period. Recent low and 50 DMA line coincide in the $42 area defining important near-term support to watch on pullbacks."
>>> FEATURED STOCK ARTICLE : Brazil-Based Digital Payments Firm Perched at All-Time High - 8/22/2019 |
View all notes |
Set NEW NOTE alert |
Company Profile |
SEC
News |
Chart |
Request a new note
C
A
S
I |
|
|
|
THESE ARE NOT BUY RECOMMENDATIONS!
Comments contained in the body of this report are technical
opinions only. The material herein has been obtained
from sources believed to be reliable and accurate, however,
its accuracy and completeness cannot be guaranteed.
This site is not an investment advisor, hence it does
not endorse or recommend any securities or other investments.
Any recommendation contained in this report may not
be suitable for all investors and it is not to be deemed
an offer or solicitation on our part with respect to
the purchase or sale of any securities. All trademarks,
service marks and trade names appearing in this report
are the property of their respective owners, and are
likewise used for identification purposes only.
This report is a service available
only to active Paid Premium Members.
You may opt-out of receiving report notifications
at any time. Questions or comments may be submitted
by writing to Premium Membership Services 665 S.E. 10 Street, Suite 201 Deerfield Beach, FL 33441-5634 or by calling 1-800-965-8307
or 954-785-1121.
|
|
|