You are not logged in.
This means you
CAN ONLY VIEW reports that were published prior to Monday, February 19, 2024.
You
MUST UPGRADE YOUR MEMBERSHIP if you want to see any current reports.
AFTER MARKET UPDATE - WEDNESDAY, AUGUST 21ST, 2019
Previous After Market Report Next After Market Report >>>
|
|
|
|
DOW |
+240.29 |
26,202.73 |
+0.93% |
|
Volume |
669,384,060 |
-5% |
|
Volume |
1,691,280,950 |
-0% |
|
NASDAQ |
+71.65 |
8,020.21 |
+0.90% |
|
Advancers |
2,017 |
70% |
|
Advancers |
2,108 |
69% |
|
S&P 500 |
+23.92 |
2,924.43 |
+0.82% |
|
Decliners |
845 |
30% |
|
Decliners |
968 |
31% |
|
Russell 2000 |
+11.84 |
1,509.85 |
+0.79% |
|
52 Wk Highs |
176 |
|
|
52 Wk Highs |
76 |
|
|
S&P 600 |
+7.25 |
928.11 |
+0.79% |
|
52 Wk Lows |
40 |
|
|
52 Wk Lows |
68 |
|
|
 |
Indices Post Gains Backed by Lighter Volume
Kenneth J. Gruneisen - Passed the CAN SLIM® Master's Exam
The Dow added 240 points, while the S&P 500 gained 0.8%. The Nasdaq Composite advanced 0.9%. Volume totals reported were lighter than the prior session totals on the NYSE and on the Nasdaq exchange, indicative of lackluster conviction on the buy side from the institutional crowd. Breadth was positive as advancers led decliners by more than a 2-1 margin on the NYSE and on the Nasdaq exchange. There were 48 high-ranked companies from the Leaders List hit new 52-week highs and were listed on the BreakOuts Page, versus the total of 38 on the prior session. New 52-week highs outnumbered new 52-week lows on the NYSE and on the Nasdaq exchange. A follow-through day on 8/13/19 marked a bullish shift concerning the M criteria of the fact-based investment system. Investors have a green light to make carefully selected new buying efforts, however, subsequent losses below prior low for the Nasdaq Composite Index would technically kill the new rally. The Featured Stocks Page provides the most timely analysis on high-ranked leaders.Charts used courtesy of www.stockcharts.com
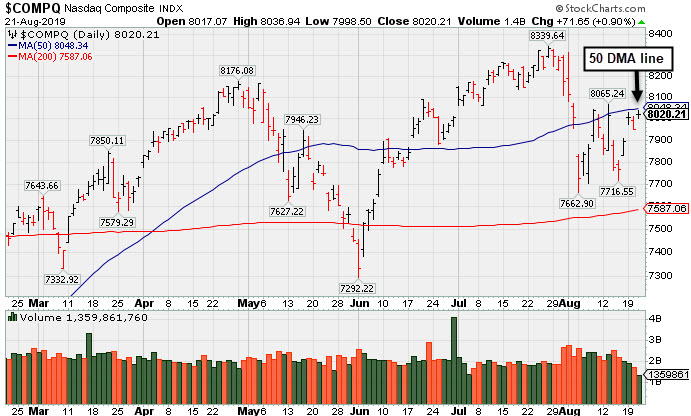
PICTURED: The Nasdaq Composite Index posted a gain with less volume conviction. Action has been indicative of lackluster institutional buying demand since the new rally encountered immediate pressure.
U.S. equities finished higher Wednesday as investors digested upbeat earnings results and the release of the minutes from the Federal Reserve’s July meeting. All 11 S&P 500 sectors finished in positive territory with Consumer Discretionary stocks pacing the gains. Target (TGT +20.43%) gapped up for a fresh record high as a spike in digital sales helped the company exceed Wall Street profit and revenue estimates. Lowe’s (LOW +10.35%) was another standout, jumping after the home improvement retailer posted robust same-store-sales growth. Toll Brothers (TOL -4.47%) topped consensus earnings estimates, but shares slid after the luxury homebuilder revealed tepid demand for high-end homes.
Treasuries moved lower to send the yield on the benchmark 10-year note up four basis points to 1.59% following the publication of the FOMC minutes. The minutes showed that Fed members viewed July’s interest rate cut as part of an "ongoing reassessment" of monetary policy in the wake of slowing global growth, risk management concerns, and persistently low inflation. Prior to market close, the spread between the two-year Treasury note and ten-year Treasury note briefly inverted for the second time in two weeks.
On a the data front, a report this morning showed mortgage applications dipped 0.9% in the most recent week after jumping 21.7% in the prior period. A separate update revealed existing home sales rebounded 2.5% in July to a five-month high. In commodities, WTI crude dropped 0.5% to $55.85/barrel, following an uptick in U.S. inventories. COMEX gold finished flat at $1,504.60/ounce.
|
 Kenneth J. Gruneisen started out as a licensed stockbroker in August 1987, a couple of months prior to the historic stock market crash that took the Dow Jones Industrial Average down -22.6% in a single day. He has published daily fact-based fundamental and technical analysis on high-ranked stocks online for two decades. Through FACTBASEDINVESTING.COM, Kenneth provides educational articles, news, market commentary, and other information regarding proven investment systems that work in good times and bad.
Comments contained in the body of this report are technical opinions only and are not necessarily those of Gruneisen Growth Corp. The material herein has been obtained from sources believed to be reliable and accurate, however, its accuracy and completeness cannot be guaranteed. Our firm, employees, and customers may effect transactions, including transactions contrary to any recommendation herein, or have positions in the securities mentioned herein or options with respect thereto. Any recommendation contained in this report may not be suitable for all investors and it is not to be deemed an offer or solicitation on our part with respect to the purchase or sale of any securities. |
|
 |
Retail, Tech, and Finanical Groups Rose
Kenneth J. Gruneisen - Passed the CAN SLIM® Master's Exam
The Retail Index ($RLX +2.33%) outpaced the financial indexes as the Bank Index ($BKX +0.45%) and Broker/Dealer Index ($XBD +0.77%) each notched a modest gain. The tech sector had a positive bias as the Semiconductor Index ($SOX +0.92%), Networking Index ($NWX +1.25%) and the Biotech Index ($BTK +1.06%) unanimously gained ground. The Integrated Oil Index ($XOI +1.00%) notched a gain while the Oil Services Index ($OSX -0.33%) and the Gold & Silver Index ($XAU -0.22%) both edged lower.
Charts courtesy of www.stockcharts.com
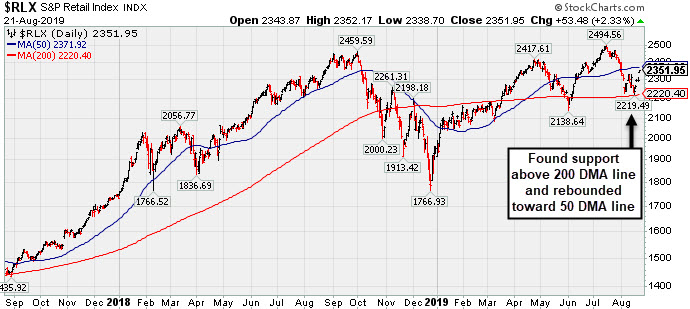
PICTURED: The 2-year graph of the Retail Index ($RLX +2.33%) shows how it recently found support above its 200-day moving average (DMA) line and rebounded toward its 50 DMA line.
| Oil Services |
$OSX |
64.31 |
-0.21 |
-0.33% |
-20.21% |
| Integrated Oil |
$XOI |
1,179.95 |
+11.64 |
+1.00% |
+1.80% |
| Semiconductor |
$SOX |
1,512.72 |
+13.82 |
+0.92% |
+30.95% |
| Networking |
$NWX |
554.07 |
+6.85 |
+1.25% |
+13.38% |
| Broker/Dealer |
$XBD |
252.99 |
+1.93 |
+0.77% |
+6.59% |
| Retail |
$RLX |
2,351.95 |
+53.48 |
+2.33% |
+20.53% |
| Gold & Silver |
$XAU |
94.53 |
-0.21 |
-0.22% |
+33.78% |
| Bank |
$BKX |
91.47 |
+0.41 |
+0.45% |
+6.62% |
| Biotech |
$BTK |
4,584.62 |
+49.18 |
+1.08% |
+8.62% |
|
|
|
 |
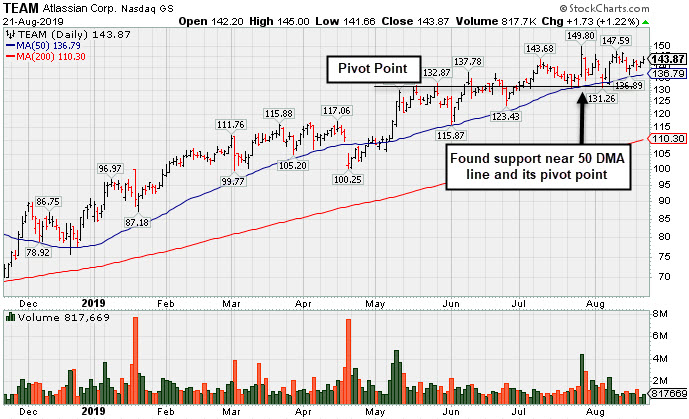
Consolidating Near High After Recently Finding Support
Kenneth J. Gruneisen - Passed the CAN SLIM® Master's Exam
Atlassian Corp (TEAM +$1.73 or +1.22% to $143.87) found support at its 50-day moving average (DMA) line ($136.49) in recent weeks but did not form a sound base. Its prior low ($130.78 on 7/23/19) defines the next important near-term support to watch where a violation would raise serious concerns and trigger a more worrisome technical sell signal.
Fundamentals remain strong. This Australia - based software developer recently reported earnings +43% on +36% sales revenues for the Jun '19 quarter versus the year ago period, continuing its strong earnings track record. It has shown 7 consecutive quarterly comparisons above the +25% minimum guideline (C criteria). Its annual earnings (A criteria) history has been strong since its $21 IPO on 12/10/15.
TEAM was last shown in the FSU section on 7/29/19 with an annotated graph under the headline, "Abrupt Retreat After Getting Very Extended From Prior Base". The number of top-rated funds owning its shares rose from 266 in Sep '17 to 612 in Jun '19, a reassuring sign concerning the I criteria. It has a Timeliness Rating of A and Sponsorship Rating of A. Its current Up/Down Volume Ratio of 1.2 is an unbiased indication its shares have been under accumulation over the past 50 days.
|
|
|
Color Codes Explained :
Y - Better candidates highlighted by our
staff of experts.
G - Previously featured
in past reports as yellow but may no longer be buyable under the
guidelines.
***Last / Change / Volume data in this table is the closing quote data***
Symbol/Exchange
Company Name
Industry Group |
PRICE |
CHANGE
(%Change) |
Day High |
Volume
(% DAV)
(% 50 day avg vol) |
52 Wk Hi
% From Hi |
Featured
Date |
Price
Featured |
Pivot Featured |
|
Max Buy |
 SPSC
-
NASDAQ
SPSC
-
NASDAQ
S P S Commerce Inc
COMPUTER SOFTWARE and SERVICES - Application Software
|
$104.83
|
+1.03
0.99% |
$107.00
|
75,678
62.08% of 50 DAV
50 DAV is 121,900
|
$118.28
-11.37%
|
6/7/2019
|
$107.72
|
PP = $115.10
|
|
MB = $120.86
|
Most Recent Note - 8/20/2019 5:34:20 PM
G - Still sputtering below its 50 DMA line ($105.13). Its Relative Strength Rating is 75, below the 80+ minimum guideline for buy candidates. Reported earnings +22% on +12% sales revenues for the Jun '19 quarter, slightly under the +25% minimum earnings guideline (C criteria), raising fundamental concerns.
>>> FEATURED STOCK ARTICLE : Found Support at 50-Day Average - 8/8/2019 |
View all notes |
Set NEW NOTE alert |
Company Profile |
SEC
News |
Chart |
Request a new note
C
A
S
I |
EPAM
-
NYSE
Epam Systems Inc
COMPUTER SOFTWARE and SERVICES - Information Technology Service
|
$196.97
|
+3.70
1.91% |
$198.11
|
343,604
82.60% of 50 DAV
50 DAV is 416,000
|
$201.00
-2.00%
|
5/9/2019
|
$169.25
|
PP = $180.55
|
|
MB = $189.58
|
Most Recent Note - 8/19/2019 5:32:54 PM
G - Consolidating above its 50 DMA line ($184.73) but it has not formed a new base of sufficient length and faces some resistance due to overhead supply up to the $201 level. Reported earnings +27% on +24% sales revenues for the Jun '19 quarter.
>>> FEATURED STOCK ARTICLE : Rebounded Above 50-Day Average Following Earnings Report - 8/12/2019 |
View all notes |
Set NEW NOTE alert |
Company Profile |
SEC
News |
Chart |
Request a new note
C
A
S
I |
AUDC
-
NASDAQ
Audiocodes Ltd
ELECTRONICS - Scientific and Technical Instrum
|
$17.58
|
-0.12
-0.68% |
$17.77
|
144,045
80.92% of 50 DAV
50 DAV is 178,000
|
$19.74
-10.94%
|
7/15/2019
|
$17.10
|
PP = $17.54
|
|
MB = $18.42
|
Most Recent Note - 8/19/2019 5:30:14 PM
Y - Found support last week while testing prior highs in the $17 area and its 50 DMA line ($16.83). More damaging losses would raise concerns and trigger technical sell signals. Reported earnings +57% on +14% sales revenues for the Jun '19 quarter, continuing its strong earnings track record.
>>> FEATURED STOCK ARTICLE : Volume Totals Cooling as Bullish Action Continues - 8/13/2019 |
View all notes |
Set NEW NOTE alert |
Company Profile |
SEC
News |
Chart |
Request a new note
C
A
S
I |
LHCG
-
NASDAQ
L H C Group Inc
HEALTH SERVICES - Home Health Care
|
$119.81
|
+0.35
0.29% |
$120.50
|
117,893
52.40% of 50 DAV
50 DAV is 225,000
|
$129.37
-7.39%
|
7/1/2019
|
$110.94
|
PP = $122.20
|
|
MB = $128.31
|
Most Recent Note - 8/20/2019 5:23:38 PM
G - Quietly sputtering below its 50 DMA line ($120.59) and below its pivot point. Any breach of recent low ($116.67 on 8/13/19) would raise more serious concerns. See the latest FSU analysis for more details and a new annotated graph.
>>> FEATURED STOCK ARTICLE : Sputtering Below 50-Day Average and Below Pivot Point - 8/20/2019 |
View all notes |
Set NEW NOTE alert |
Company Profile |
SEC
News |
Chart |
Request a new note
C
A
S
I |
CHDN
-
NASDAQ
Churchill Downs Inc
LEISURE - Gaming Activities
|
$121.45
|
+0.58
0.48% |
$122.60
|
185,867
79.43% of 50 DAV
50 DAV is 234,000
|
$132.73
-8.50%
|
7/22/2019
|
$118.45
|
PP = $118.89
|
|
MB = $124.83
|
Most Recent Note - 8/20/2019 5:25:36 PM
Y - Found support near its 50 DMA line ($111.17). Weak action came after it reported Jun '19 earnings rose +10% on +26% sales revenues versus the year ago period, below the +25% minimum earnings guideline (C criteria). The prior low ($113.88 on 8/05/19) defines the next important near-term support to watch.
>>> FEATURED STOCK ARTICLE : Recently Found Support at 50-Day Moving Average - 8/14/2019 |
View all notes |
Set NEW NOTE alert |
Company Profile |
SEC
News |
Chart |
Request a new note
C
A
S
I |
Symbol/Exchange
Company Name
Industry Group |
PRICE |
CHANGE
(%Change) |
Day High |
Volume
(% DAV)
(% 50 day avg vol) |
52 Wk Hi
% From Hi |
Featured
Date |
Price
Featured |
Pivot Featured |
|
Max Buy |
LULU
-
NASDAQ
Lululemon Athletica
MANUFACTURING - Textile Manufacturing
|
$183.33
|
+3.66
2.04% |
$183.53
|
964,901
48.73% of 50 DAV
50 DAV is 1,980,000
|
$194.25
-5.62%
|
6/13/2019
|
$174.48
|
PP = $179.60
|
|
MB = $188.58
|
 Most Recent Note - 8/21/2019 6:28:11 PM
G - Rebounded near its 50 DMA line ($183.47) with today's 5th consecutive small gain backed by light volume. A convincing rebound above the 50 DMA line can help its technical stance improve, but it faces near-term resistance up to the $194 level. Reported Apr '19 quarterly earnings +35% on +20% sales revenues versus the year ago period.
>>> FEATURED STOCK ARTICLE : Sputtering After Slump Below 50-Day Moving Average - 8/15/2019 |
View all notes |
Set NEW NOTE alert |
Company Profile |
SEC
News |
Chart |
Request a new note
C
A
S
I |
ULTA
-
NASDAQ
Ulta Salon Cosm & Frag
SPECIALTY RETAIL - Specialty Retail, Other
|
$328.12
|
+5.04
1.56% |
$331.49
|
516,212
75.38% of 50 DAV
50 DAV is 684,800
|
$368.83
-11.04%
|
3/15/2019
|
$341.27
|
PP = $322.59
|
|
MB = $338.72
|
Most Recent Note - 8/15/2019 1:26:59 PM
G - Testing its 200 DMA line ($317) today. Technical weakness raised concerns, and a rebound above its 50 DMA line ($347) is needed for its outlook to improve. Reported earnings +17% on +13% sales revenues for the Apr '19 quarter, below the +25% minimum earnings guideline (C criteria), raising fundamental concerns.
>>> FEATURED STOCK ARTICLE : Ulta Beauty Sputtering Below 50-Day Moving Average - 8/7/2019 |
View all notes |
Set NEW NOTE alert |
Company Profile |
SEC
News |
Chart |
Request a new note
C
A
S
I |
CHGG
-
NYSE
Chegg Inc
Consumer Svcs-Education
|
$40.97
|
+0.55
1.36% |
$41.23
|
1,083,102
70.74% of 50 DAV
50 DAV is 1,531,000
|
$48.22
-15.04%
|
7/8/2019
|
$44.11
|
PP = $41.79
|
|
MB = $43.88
|
Most Recent Note - 8/20/2019 5:26:54 PM
G - Remains below its 50 DMA line ($41.65) which acted as resistance after recent losses on higher volume. A prompt rebound above the 50 DMA line is needed for its outlook to improve. Reported earnings +92% on +26% sales revenues for the Jun '19 quarter.
>>> FEATURED STOCK ARTICLE : Consolidating Above Prior Highs and 50-Day Average - 8/6/2019 |
View all notes |
Set NEW NOTE alert |
Company Profile |
SEC
News |
Chart |
Request a new note
C
A
S
I |
VEEV
-
NYSE
Veeva Systems Inc Cl A
Computer Sftwr-Medical
|
$161.98
|
+4.31
2.73% |
$162.20
|
751,316
56.45% of 50 DAV
50 DAV is 1,331,000
|
$176.90
-8.43%
|
5/30/2019
|
$154.32
|
PP = $145.80
|
|
MB = $153.09
|
Most Recent Note - 8/21/2019 6:29:12 PM
G - Its 50 DMA line ($165) acted as resistance after volume-driven losses. A rebound above the 50 DMA line is needed for its outlook to improve. Fundamentals remain strong.
>>> FEATURED STOCK ARTICLE : Recently Found Support Near 50-Day Moving Average - 8/1/2019 |
View all notes |
Set NEW NOTE alert |
Company Profile |
SEC
News |
Chart |
Request a new note
C
A
S
I |
PAYC
-
NYSE
Paycom Software Inc
COMPUTER SOFTWARE and SERVICES - Application Software
|
$251.90
|
+4.93
2.00% |
$256.84
|
634,265
102.97% of 50 DAV
50 DAV is 616,000
|
$248.44
1.39%
|
8/20/2019
|
$246.97
|
PP = $246.95
|
|
MB = $259.30
|
Most Recent Note - 8/20/2019 5:32:35 PM
Y - Color code is changed to yellow with new pivot point cited based on its 7/11/19 high plus 10 cents. Quietly hit a new all-time high with today's 4th consecutive gain with below average volume. Gains above a stock's pivot must have at least +40% above average volume to trigger a proper new (or add-on) technical buy signal. Its 50 DMA line ($232.63) defines support above the recent low ($216.55 on 8/05/19). Reported earnings +27% on +31% sales revenues for the Jun '19 quarter, continuing its strong earnings track record.
>>> FEATURED STOCK ARTICLE : Found Support and Gapped Up Following Earnings Report - 8/2/2019 |
View all notes |
Set NEW NOTE alert |
Company Profile |
SEC
News |
Chart |
Request a new note
C
A
S
I |
Symbol/Exchange
Company Name
Industry Group |
PRICE |
CHANGE
(%Change) |
Day High |
Volume
(% DAV)
(% 50 day avg vol) |
52 Wk Hi
% From Hi |
Featured
Date |
Price
Featured |
Pivot Featured |
|
Max Buy |
BLD
-
NYSE
Topbuild Corp
Bldg-Constr Prds/Misc
|
$92.71
|
+0.79
0.86% |
$93.44
|
200,144
63.34% of 50 DAV
50 DAV is 316,000
|
$93.59
-0.94%
|
5/17/2019
|
$82.19
|
PP = $87.31
|
|
MB = $91.68
|
Most Recent Note - 8/19/2019 5:25:37 PM
G - Hit a new all-time high with today's 3rd consecutive gain backed by light volume. Stubbornly held its ground following bullish action after it reported earnings +39% on +9% sales revenues for the Jun '19 quarter versus the year ago period, continuing its strong earnings track record. Its prior highs in the $86 area define initial support to watch above 50 DMA line ($83.09) on pullbacks. See the latest FSU analysis for more details and a new annotated graph.
>>> FEATURED STOCK ARTICLE : Topbuild Has 4 Consecutive Weekly Gains and Stubbornly Held Ground - 8/19/2019 |
View all notes |
Set NEW NOTE alert |
Company Profile |
SEC
News |
Chart |
Request a new note
C
A
S
I |
TEAM
-
NASDAQ
Atlassian Corp Plc Cl A
Comp Sftwr-Spec Enterprs
|
$143.87
|
+1.73
1.22% |
$145.00
|
815,372
64.87% of 50 DAV
50 DAV is 1,257,000
|
$149.80
-3.96%
|
5/24/2019
|
$129.52
|
PP = $132.09
|
|
MB = $138.69
|
Most Recent Note - 8/21/2019 6:07:59 PM
G - Found support above its pivot point and at its 50 DMA line ($136.79) in recent weeks but did not form a sound base. Prior low ($130.78 on 7/23/19) defines the next important near-term support to watch where a violation would raise serious concerns and trigger a more worrisome technical sell signal. Reported earnings +43% on +36% sales revenues for the Jun '19 quarter, continuing its strong earnings track record. See the latest FSU analysis for more details and a new annotated graph.
>>> FEATURED STOCK ARTICLE : Consolidating Near High After Recently Finding Support - 8/21/2019 |
View all notes |
Set NEW NOTE alert |
Company Profile |
SEC
News |
Chart |
Request a new note
C
A
S
I |
TTD
-
NASDAQ
The Trade Desk Inc Cl A
Comml Svcs-Advertising
|
$260.11
|
+9.99
3.99% |
$264.58
|
1,654,942
113.82% of 50 DAV
50 DAV is 1,454,000
|
$289.51
-10.16%
|
7/18/2019
|
$240.61
|
PP = $258.10
|
|
MB = $271.01
|
Most Recent Note - 8/21/2019 6:23:16 PM
Y - Posted a gain today with higher volume. Its 50 DMA line ($247) and recent low ($239.01 on 8/21/19) define important near-term support to watch. Reported Jun '19 quarterly earnings +58% on +42% sales revenues.
>>> FEATURED STOCK ARTICLE : Consolidating Near 50-Day Moving Average Line - 8/16/2019 |
View all notes |
Set NEW NOTE alert |
Company Profile |
SEC
News |
Chart |
Request a new note
C
A
S
I |
PAGS
-
NYSE
Pagseguro Digital Cl A
Finance-CrdtCard/PmtPr
|
$51.31
|
+2.42
4.95% |
$51.40
|
1,448,606
62.39% of 50 DAV
50 DAV is 2,322,000
|
$53.43
-3.97%
|
6/25/2019
|
$37.69
|
PP = $40.07
|
|
MB = $42.07
|
Most Recent Note - 8/21/2019 6:25:06 PM
G - Posted a gain today with light volume for its 2nd best close. Noted in prior mid-day reports - "Reported earnings +35% on +39% sales revenues for the quarter ended June 30,2019 versus the year ago period. Recent low and 50 DMA line coincide in the $42 area defining important near-term support to watch on pullbacks."
>>> FEATURED STOCK ARTICLE : Encountering Distributional Pressure After Impressive Sprint - 7/30/2019 |
View all notes |
Set NEW NOTE alert |
Company Profile |
SEC
News |
Chart |
Request a new note
C
A
S
I |
|
|
|
THESE ARE NOT BUY RECOMMENDATIONS!
Comments contained in the body of this report are technical
opinions only. The material herein has been obtained
from sources believed to be reliable and accurate, however,
its accuracy and completeness cannot be guaranteed.
This site is not an investment advisor, hence it does
not endorse or recommend any securities or other investments.
Any recommendation contained in this report may not
be suitable for all investors and it is not to be deemed
an offer or solicitation on our part with respect to
the purchase or sale of any securities. All trademarks,
service marks and trade names appearing in this report
are the property of their respective owners, and are
likewise used for identification purposes only.
This report is a service available
only to active Paid Premium Members.
You may opt-out of receiving report notifications
at any time. Questions or comments may be submitted
by writing to Premium Membership Services 665 S.E. 10 Street, Suite 201 Deerfield Beach, FL 33441-5634 or by calling 1-800-965-8307
or 954-785-1121.
|
|
|