You are not logged in.
This means you
CAN ONLY VIEW reports that were published prior to Sunday, February 18, 2024.
You
MUST UPGRADE YOUR MEMBERSHIP if you want to see any current reports.
AFTER MARKET UPDATE - MONDAY, AUGUST 19TH, 2019
Previous After Market Report Next After Market Report >>>
|
|
|
|
DOW |
+249.78 |
26,135.79 |
+0.96% |
|
Volume |
768,618,700 |
-11% |
|
Volume |
1,915,033,257 |
-2% |
|
NASDAQ |
+106.82 |
8,002.81 |
+1.35% |
|
Advancers |
2,156 |
76% |
|
Advancers |
2,227 |
72% |
|
S&P 500 |
+34.97 |
2,923.65 |
+1.21% |
|
Decliners |
698 |
24% |
|
Decliners |
870 |
28% |
|
Russell 2000 |
+15.21 |
1,508.85 |
+1.02% |
|
52 Wk Highs |
187 |
|
|
52 Wk Highs |
83 |
|
|
S&P 600 |
+9.74 |
929.36 |
+1.06% |
|
52 Wk Lows |
21 |
|
|
52 Wk Lows |
65 |
|
|
 |
Breadth Positive But Major Indices Rose With Less Volume Conviction
Kenneth J. Gruneisen - Passed the CAN SLIM® Master's Exam
The Dow gained 249 points, while the S&P 500 advanced 1.2%. The Nasdaq Composite was up 1.4%. Volume totals reported were lighter than the prior session totals on the NYSE and on the Nasdaq exchange, indicative of lackluster buying conviction from the institutional crowd. Advancers decisively led decliners by a 3-1 margin on the NYSE and 11-4 on the Nasdaq exchange. Leadership improved as there were 65 high-ranked companies from the Leaders List hit new 52-week highs and were listed on the BreakOuts Page, versus the total of 38 on the prior session. New 52-week highs totals outnumbered new 52-week lows on the NYSE and on the Nasdaq exchange. The Featured Stocks Page provides the most timely analysis on high-ranked leaders.Charts used courtesy of www.stockcharts.com
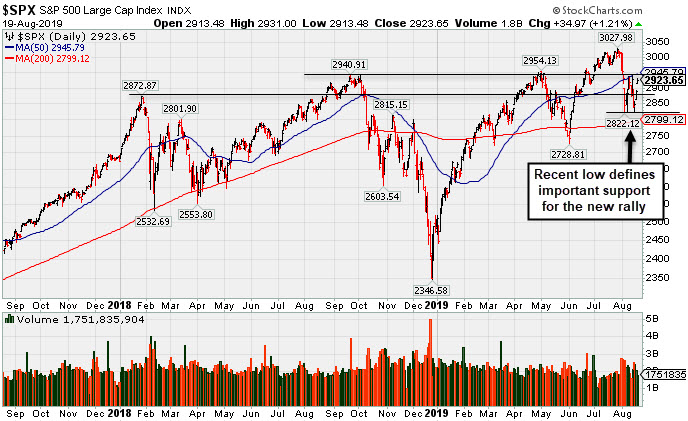
PICTURED: The S&P 500 Index posted a solid gain on Monday. It slumped below its 50-day moving average from its record high, and now the recent low defines important near-term support. A follow-through day on 8/13/19 marked a bullish shift concerning the M criteria of the fact-based investment system. Investors have a green light to make carefully selected new buying efforts, however, subsequent losses below prior low would technically kill the new rally.
Stocks finished higher Monday. Positive trade developments helped fuel investor confidence. The Trump Administration extended a reprieve to Chinese telecom giant Huawei Technologies, enabling the company to purchase from U.S. suppliers for an additional 90 days. Global stimulus support also provided a tailwind to equities, as China’s central bank reduced borrowing costs for corporations overnight. Further, market participants widely anticipate the European Central Bank to ease monetary policy in the near future, while recent reports set the stage for German fiscal stimulus.
Today’s action follows a volatile week, in which stocks pared a third straight weekly decline. Two-year Treasury note yields briefly traded above 10-year yields last week, heightening investor concern of a looming recession, as this inversion has historically preceded such periods. Treasuries declined Monday, sending yields back above multi-year lows. The yield on the 10-year note was up five basis points to 1.60%. In commodities, WTI crude rose 2.4% to $56.21/barrel, while COMEX gold slipped 1.3% to $1,493.00/ounce.
All 11 S&P 500 sectors closed in positive territory, with Energy and Technology shares pacing gains. In earnings, Estee Lauder (EL +12.5%) rose after exceeding analyst profit and revenue forecasts and offering positive full-year guidance.
On the data front, there were no notable economic releases Monday. Market participants will look ahead to Wednesday’s release of the Federal Reserve’s July meeting minutes, as well as a speech Friday from Fed Chair Jerome Powell at the annual central bank summit in Jackson Hole, Wyoming.
|
 Kenneth J. Gruneisen started out as a licensed stockbroker in August 1987, a couple of months prior to the historic stock market crash that took the Dow Jones Industrial Average down -22.6% in a single day. He has published daily fact-based fundamental and technical analysis on high-ranked stocks online for two decades. Through FACTBASEDINVESTING.COM, Kenneth provides educational articles, news, market commentary, and other information regarding proven investment systems that work in good times and bad.
Comments contained in the body of this report are technical opinions only and are not necessarily those of Gruneisen Growth Corp. The material herein has been obtained from sources believed to be reliable and accurate, however, its accuracy and completeness cannot be guaranteed. Our firm, employees, and customers may effect transactions, including transactions contrary to any recommendation herein, or have positions in the securities mentioned herein or options with respect thereto. Any recommendation contained in this report may not be suitable for all investors and it is not to be deemed an offer or solicitation on our part with respect to the purchase or sale of any securities. |
|
 |
Retail, Financial, Tech, and Enery-Linked Groups Rose
Kenneth J. Gruneisen - Passed the CAN SLIM® Master's Exam
The Broker/Dealer Index ($XBD +1.03%), Bank Index ($BKX +1.41%), and the Retail Index ($RLX +1.41%) posted unanimous gains which underpinned the major indices' rally. The tech sector had a positive bias as the Semiconductor Index ($SOX +1.87%) and the Networking Index ($NWX +1.57%) both outpaced the Biotech Index ($BTK +0.95%). The Integrated Oil Index ($XOI +2.11%) rose and the Oil Services Index ($OSX +4.42%) posted a standout gain.
Charts courtesy of www.stockcharts.com
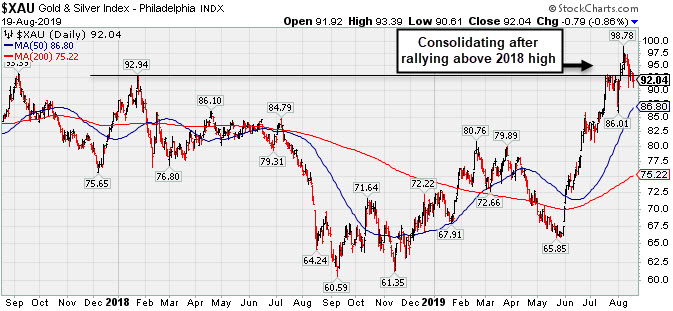
PICTURED: The Gold & Silver Index ($XAU -0.86%) was a standout decliner on Monday's widely positive session. It is consolidating after recently rallying to multi-year lows.
| Oil Services |
$OSX |
65.35 |
+2.77 |
+4.43% |
-18.92% |
| Integrated Oil |
$XOI |
1,180.10 |
+24.38 |
+2.11% |
+1.81% |
| Semiconductor |
$SOX |
1,506.99 |
+27.74 |
+1.88% |
+30.46% |
| Networking |
$NWX |
553.70 |
+8.57 |
+1.57% |
+13.31% |
| Broker/Dealer |
$XBD |
252.50 |
+2.58 |
+1.03% |
+6.39% |
| Retail |
$RLX |
2,295.79 |
+31.98 |
+1.41% |
+17.65% |
| Gold & Silver |
$XAU |
92.04 |
-0.80 |
-0.86% |
+30.26% |
| Bank |
$BKX |
92.64 |
+1.07 |
+1.17% |
+7.98% |
| Biotech |
$BTK |
4,602.83 |
+43.35 |
+0.95% |
+9.05% |
|
|
|
 |
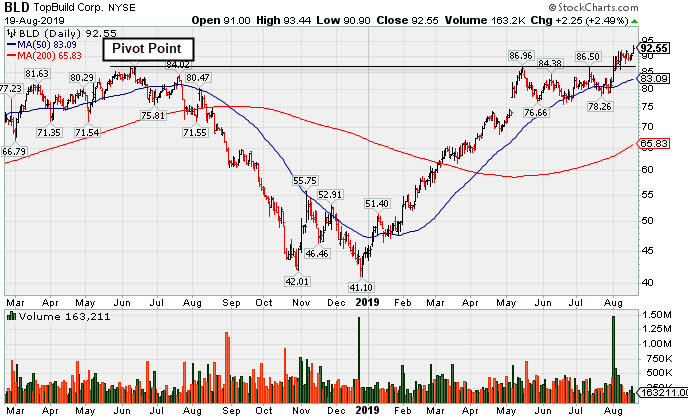
Topbuild Has 4 Consecutive Weekly Gains and Stubbornly Held Ground
Kenneth J. Gruneisen - Passed the CAN SLIM® Master's Exam
Topbuild Corp (BLD +$2.25 or +2.49% to $92.55) hit a new all-time high with below average volume behind today's 3rd consecutive gain. It has been stubbornly holding its ground after bullish action, tallying 4 consecutive weekly gains. Prior highs in the $86 area define initial support to watch above its 50 DMA line ($83.09) on pullbacks.
It reported earnings +39% on +9% sales revenues for the Jun '19 quarter versus the year ago period, continuing its strong earnings track record of quarterly earnings increases above the +25% minimum guideline (C criteria). It has a 99 Earnings Per Share Rating, as its annual earnings (A criteria) history has also been strong and steady since turning profitable in FY '14.
BLD was last shown in this FSU section on 7/25/19 with an annotated graph under the headline, "Perched Near 52-Week High Finding Support". It was highlighted in yellow with new pivot point cited based on its 8/12/18 high plus 10 cents in the 5/17/19 mid-day report (read here).
The number of top-rated funds owning its shares rose from 383 in Dec '18 to 423 in Jun '19. Its current Up/Down Volume Ration of 1.1 is an unbiased indication its shares have been under slight distributional pressure over the past 50 days. It has a Timeliness Rating of A and a Sponsorship Rating of C.
|
|
|
Color Codes Explained :
Y - Better candidates highlighted by our
staff of experts.
G - Previously featured
in past reports as yellow but may no longer be buyable under the
guidelines.
***Last / Change / Volume data in this table is the closing quote data***
Symbol/Exchange
Company Name
Industry Group |
PRICE |
CHANGE
(%Change) |
Day High |
Volume
(% DAV)
(% 50 day avg vol) |
52 Wk Hi
% From Hi |
Featured
Date |
Price
Featured |
Pivot Featured |
|
Max Buy |
 SPSC
-
NASDAQ
SPSC
-
NASDAQ
S P S Commerce Inc
COMPUTER SOFTWARE and SERVICES - Application Software
|
$105.01
|
+1.25
1.20% |
$105.31
|
90,768
73.62% of 50 DAV
50 DAV is 123,300
|
$118.28
-11.22%
|
6/7/2019
|
$107.72
|
PP = $115.10
|
|
MB = $120.86
|
Most Recent Note - 8/16/2019 4:50:10 PM
G - Color code is changed to green after slumping below its 50 DMA line ($105.26), meanwhile its Relative Strength Rating has fallen to 70, below the 80+ minimum guideline for buy candidates. Stalled after a gap up and big volume-driven gain noted on 7/26/19. Subsequent gains and a strong close above the pivot point may clinch a convincing new (or add-on) technical buy signal. Reported earnings +22% on +12% sales revenues for the Jun '19 quarter, slightly under the +25% minimum earnings guideline (C criteria), raising fundamental concerns.
>>> FEATURED STOCK ARTICLE : Found Support at 50-Day Average - 8/8/2019 |
View all notes |
Set NEW NOTE alert |
Company Profile |
SEC
News |
Chart |
Request a new note
C
A
S
I |
EPAM
-
NYSE
Epam Systems Inc
COMPUTER SOFTWARE and SERVICES - Information Technology Service
|
$190.64
|
+2.62
1.39% |
$192.14
|
385,484
92.44% of 50 DAV
50 DAV is 417,000
|
$201.00
-5.15%
|
5/9/2019
|
$169.25
|
PP = $180.55
|
|
MB = $189.58
|
 Most Recent Note - 8/19/2019 5:32:54 PM
G - Consolidating above its 50 DMA line ($184.73) but it has not formed a new base of sufficient length and faces some resistance due to overhead supply up to the $201 level. Reported earnings +27% on +24% sales revenues for the Jun '19 quarter.
>>> FEATURED STOCK ARTICLE : Rebounded Above 50-Day Average Following Earnings Report - 8/12/2019 |
View all notes |
Set NEW NOTE alert |
Company Profile |
SEC
News |
Chart |
Request a new note
C
A
S
I |
AUDC
-
NASDAQ
Audiocodes Ltd
ELECTRONICS - Scientific and Technical Instrum
|
$17.79
|
+0.40
2.30% |
$17.95
|
87,245
49.29% of 50 DAV
50 DAV is 177,000
|
$19.74
-9.88%
|
7/15/2019
|
$17.10
|
PP = $17.54
|
|
MB = $18.42
|
Most Recent Note - 8/19/2019 5:30:14 PM
Y - Found support last week while testing prior highs in the $17 area and its 50 DMA line ($16.83). More damaging losses would raise concerns and trigger technical sell signals. Reported earnings +57% on +14% sales revenues for the Jun '19 quarter, continuing its strong earnings track record.
>>> FEATURED STOCK ARTICLE : Volume Totals Cooling as Bullish Action Continues - 8/13/2019 |
View all notes |
Set NEW NOTE alert |
Company Profile |
SEC
News |
Chart |
Request a new note
C
A
S
I |
LHCG
-
NASDAQ
L H C Group Inc
HEALTH SERVICES - Home Health Care
|
$120.01
|
-1.61
-1.32% |
$123.00
|
215,731
96.74% of 50 DAV
50 DAV is 223,000
|
$129.37
-7.24%
|
7/1/2019
|
$110.94
|
PP = $122.20
|
|
MB = $128.31
|
Most Recent Note - 8/15/2019 4:16:53 PM
G - Still sputtering near its 50 DMA line ($120). Any breach of recent low ($116.67 on 8/13/19) would raise more serious concerns. Reported earnings +27% on +3% sales revenues for the Jun '19 quarter. Prior quarterly comparisons showed much stronger sales revenues growth. Recent gains above its pivot point were not backed by the +40% above average volume needed to trigger a proper new (or add-on) technical buy signal.
>>> FEATURED STOCK ARTICLE : Consolidating Following a Negative Reversal at High - 7/22/2019 |
View all notes |
Set NEW NOTE alert |
Company Profile |
SEC
News |
Chart |
Request a new note
C
A
S
I |
CHDN
-
NASDAQ
Churchill Downs Inc
LEISURE - Gaming Activities
|
$120.44
|
+1.64
1.38% |
$122.86
|
192,916
80.72% of 50 DAV
50 DAV is 239,000
|
$132.73
-9.26%
|
7/22/2019
|
$118.45
|
PP = $118.89
|
|
MB = $124.83
|
Most Recent Note - 8/14/2019 5:50:05 PM
Y - Found support recently above its 50 DMA line ($116.55). Reported Jun '19 earnings rose +10% on +26% sales revenues versus the year ago period, below the +25% minimum earnings guideline (C criteria). The prior low ($113.88 on 8/05/19) defines the next important near-term support to watch below its 50 DMA line. See the latest FSU analysis for more details and a new annotated graph.
>>> FEATURED STOCK ARTICLE : Recently Found Support at 50-Day Moving Average - 8/14/2019 |
View all notes |
Set NEW NOTE alert |
Company Profile |
SEC
News |
Chart |
Request a new note
C
A
S
I |
Symbol/Exchange
Company Name
Industry Group |
PRICE |
CHANGE
(%Change) |
Day High |
Volume
(% DAV)
(% 50 day avg vol) |
52 Wk Hi
% From Hi |
Featured
Date |
Price
Featured |
Pivot Featured |
|
Max Buy |
LULU
-
NASDAQ
Lululemon Athletica
MANUFACTURING - Textile Manufacturing
|
$178.67
|
+0.84
0.47% |
$181.03
|
1,163,834
57.87% of 50 DAV
50 DAV is 2,011,000
|
$194.25
-8.02%
|
6/13/2019
|
$174.48
|
PP = $179.60
|
|
MB = $188.58
|
Most Recent Note - 8/15/2019 4:14:45 PM
G - Still sputtering below its 50 DMA line ($182.81) which may act as resistance. A rebound above the 50 DMA line is needed to help its technical stance improve. Reported Apr '19 quarterly earnings +35% on +20% sales revenues versus the year ago period. See the latest FSU analysis for more details and a new annotated graph.
>>> FEATURED STOCK ARTICLE : Sputtering After Slump Below 50-Day Moving Average - 8/15/2019 |
View all notes |
Set NEW NOTE alert |
Company Profile |
SEC
News |
Chart |
Request a new note
C
A
S
I |
ULTA
-
NASDAQ
Ulta Beauty Inc
SPECIALTY RETAIL - Specialty Retail, Other
|
$325.25
|
+3.22
1.00% |
$328.77
|
805,249
118.25% of 50 DAV
50 DAV is 681,000
|
$368.83
-11.82%
|
3/15/2019
|
$341.27
|
PP = $322.59
|
|
MB = $338.72
|
Most Recent Note - 8/15/2019 1:26:59 PM
G - Testing its 200 DMA line ($317) today. Technical weakness raised concerns, and a rebound above its 50 DMA line ($347) is needed for its outlook to improve. Reported earnings +17% on +13% sales revenues for the Apr '19 quarter, below the +25% minimum earnings guideline (C criteria), raising fundamental concerns.
>>> FEATURED STOCK ARTICLE : Ulta Beauty Sputtering Below 50-Day Moving Average - 8/7/2019 |
View all notes |
Set NEW NOTE alert |
Company Profile |
SEC
News |
Chart |
Request a new note
C
A
S
I |
CHGG
-
NYSE
Chegg Inc
Consumer Svcs-Education
|
$40.97
|
+0.51
1.26% |
$41.87
|
1,579,602
104.13% of 50 DAV
50 DAV is 1,517,000
|
$48.22
-15.04%
|
7/8/2019
|
$44.11
|
PP = $41.79
|
|
MB = $43.88
|
Most Recent Note - 8/14/2019 5:53:24 PM
G - Color code is changed to green after a more damaging loss raised concerns and triggered a technical sell signal. Slumped below prior highs in the $40-41 area and below its 50 DMA line ($41.53). A prompt rebound above the 50 DMA line is needed for its outlook to improve. Reported earnings +92% on +26% sales revenues for the Jun '19 quarter.
>>> FEATURED STOCK ARTICLE : Consolidating Above Prior Highs and 50-Day Average - 8/6/2019 |
View all notes |
Set NEW NOTE alert |
Company Profile |
SEC
News |
Chart |
Request a new note
C
A
S
I |
VEEV
-
NYSE
Veeva Systems Inc Cl A
Computer Sftwr-Medical
|
$158.10
|
-2.24
-1.40% |
$162.50
|
1,062,265
77.37% of 50 DAV
50 DAV is 1,373,000
|
$176.90
-10.63%
|
5/30/2019
|
$154.32
|
PP = $145.80
|
|
MB = $153.09
|
Most Recent Note - 8/15/2019 4:17:33 PM
G - Still sputtering below its 50 DMA line ($165.56) which acted as resistance after volume-driven losses. A rebound above the 50 DMA line is needed for its outlook to improve. Fundamentals remain strong.
>>> FEATURED STOCK ARTICLE : Recently Found Support Near 50-Day Moving Average - 8/1/2019 |
View all notes |
Set NEW NOTE alert |
Company Profile |
SEC
News |
Chart |
Request a new note
C
A
S
I |
PAYC
-
NYSE
Paycom Software Inc
COMPUTER SOFTWARE and SERVICES - Application Software
|
$243.66
|
+2.24
0.93% |
$246.34
|
470,141
74.51% of 50 DAV
50 DAV is 631,000
|
$246.85
-1.29%
|
2/6/2019
|
$171.66
|
PP = $164.18
|
|
MB = $172.39
|
Most Recent Note - 8/14/2019 5:57:58 PM
G - Fell near its 50 DMA line ($230.89) today while still building on a new flat base. Reported earnings +27% on +31% sales revenues for the Jun '19 quarter, continuing its strong earnings track record.
>>> FEATURED STOCK ARTICLE : Found Support and Gapped Up Following Earnings Report - 8/2/2019 |
View all notes |
Set NEW NOTE alert |
Company Profile |
SEC
News |
Chart |
Request a new note
C
A
S
I |
Symbol/Exchange
Company Name
Industry Group |
PRICE |
CHANGE
(%Change) |
Day High |
Volume
(% DAV)
(% 50 day avg vol) |
52 Wk Hi
% From Hi |
Featured
Date |
Price
Featured |
Pivot Featured |
|
Max Buy |
BLD
-
NYSE
Topbuild Corp
Bldg-Constr Prds/Misc
|
$92.55
|
+2.25
2.49% |
$93.45
|
201,971
64.12% of 50 DAV
50 DAV is 315,000
|
$92.07
0.52%
|
5/17/2019
|
$82.19
|
PP = $87.31
|
|
MB = $91.68
|
Most Recent Note - 8/19/2019 5:25:37 PM
G - Hit a new all-time high with today's 3rd consecutive gain backed by light volume. Stubbornly held its ground following bullish action after it reported earnings +39% on +9% sales revenues for the Jun '19 quarter versus the year ago period, continuing its strong earnings track record. Its prior highs in the $86 area define initial support to watch above 50 DMA line ($83.09) on pullbacks. See the latest FSU analysis for more details and a new annotated graph.
>>> FEATURED STOCK ARTICLE : Topbuild Has 4 Consecutive Weekly Gains and Stubbornly Held Ground - 8/19/2019 |
View all notes |
Set NEW NOTE alert |
Company Profile |
SEC
News |
Chart |
Request a new note
C
A
S
I |
TEAM
-
NASDAQ
Atlassian Corp Plc Cl A
Comp Sftwr-Spec Enterprs
|
$141.27
|
-1.30
-0.91% |
$143.39
|
1,323,291
103.54% of 50 DAV
50 DAV is 1,278,000
|
$149.80
-5.69%
|
5/24/2019
|
$129.52
|
PP = $132.09
|
|
MB = $138.69
|
Most Recent Note - 8/14/2019 5:59:55 PM
G - Pulled back toward support at its 50 DMA line ($135.56). Its prior low ($130.78 on 7/23/19) defines the next important near-term support to watch where a violation would raise serious concerns and trigger a more worrisome technical sell signal. Reported earnings +43% on +36% sales revenues for the Jun '19 quarter, continuing its strong earnings track record.
>>> FEATURED STOCK ARTICLE : Abrupt Retreat After Getting Very Extended From Prior Base - 7/29/2019 |
View all notes |
Set NEW NOTE alert |
Company Profile |
SEC
News |
Chart |
Request a new note
C
A
S
I |
GLOB
-
NYSE
Globant SA
Computer-Tech Services
|
$91.64
|
-7.10
-7.19% |
$99.94
|
846,176
260.36% of 50 DAV
50 DAV is 325,000
|
$112.33
-18.42%
|
2/15/2019
|
$69.35
|
PP = $70.00
|
|
MB = $73.50
|
Most Recent Note - 8/19/2019 5:35:40 PM
Suffered another big volume-driven loss today and it will be dropped from the Featured Stocks list. A rebound above the 50 DMA line($103.87) is needed for its outlook to improve. Reported earnings +33% on +23% sales revenues for the Jun '19 quarter continuing its strong earning track record
>>> FEATURED STOCK ARTICLE : Consolidating Above 50-Day Average With Earnings News Soon - 8/9/2019 |
View all notes |
Set NEW NOTE alert |
Company Profile |
SEC
News |
Chart |
Request a new note
C
A
S
I |
TTD
-
NASDAQ
The Trade Desk Inc Cl A
Comml Svcs-Advertising
|
$242.92
|
-5.70
-2.29% |
$255.38
|
1,373,089
93.15% of 50 DAV
50 DAV is 1,474,000
|
$289.51
-16.09%
|
7/18/2019
|
$240.61
|
PP = $258.10
|
|
MB = $271.01
|
Most Recent Note - 8/19/2019 12:38:08 PM
G - Color code is changed to green while sputtering below its 50 DMA line ($247.56) which defines important support. On Friday it was noted - "More damaging losses would raise concerns and trigger a technical sell signal. Reported Jun '19 quarterly earnings +58% on +42% sales revenues. See the latest FSU analysis for more details and a new annotated graph."
>>> FEATURED STOCK ARTICLE : Consolidating Near 50-Day Moving Average Line - 8/16/2019 |
View all notes |
Set NEW NOTE alert |
Company Profile |
SEC
News |
Chart |
Request a new note
C
A
S
I |
PAGS
-
NYSE
Pagseguro Digital Cl A
Finance-CrdtCard/PmtPr
|
$49.83
|
-1.71
-3.32% |
$53.00
|
2,430,765
104.59% of 50 DAV
50 DAV is 2,324,000
|
$53.43
-6.74%
|
6/25/2019
|
$37.69
|
PP = $40.07
|
|
MB = $42.07
|
Most Recent Note - 8/19/2019 12:30:21 PM
G - Retreating today after gapping up and hitting a new all-time high with a considerable volume-driven gain when noted in prior mid-day report - "Reported earnings +35% on +39% sales revenues for the quarter ended June 30,2019 versus the year ago period. Recent low and 50 DMA line coincide in the $42 area defining important near-term support to watch on pullbacks."
>>> FEATURED STOCK ARTICLE : Encountering Distributional Pressure After Impressive Sprint - 7/30/2019 |
View all notes |
Set NEW NOTE alert |
Company Profile |
SEC
News |
Chart |
Request a new note
C
A
S
I |
Symbol/Exchange
Company Name
Industry Group |
PRICE |
CHANGE
(%Change) |
Day High |
Volume
(% DAV)
(% 50 day avg vol) |
52 Wk Hi
% From Hi |
Featured
Date |
Price
Featured |
Pivot Featured |
|
Max Buy |
|
|
|
THESE ARE NOT BUY RECOMMENDATIONS!
Comments contained in the body of this report are technical
opinions only. The material herein has been obtained
from sources believed to be reliable and accurate, however,
its accuracy and completeness cannot be guaranteed.
This site is not an investment advisor, hence it does
not endorse or recommend any securities or other investments.
Any recommendation contained in this report may not
be suitable for all investors and it is not to be deemed
an offer or solicitation on our part with respect to
the purchase or sale of any securities. All trademarks,
service marks and trade names appearing in this report
are the property of their respective owners, and are
likewise used for identification purposes only.
This report is a service available
only to active Paid Premium Members.
You may opt-out of receiving report notifications
at any time. Questions or comments may be submitted
by writing to Premium Membership Services 665 S.E. 10 Street, Suite 201 Deerfield Beach, FL 33441-5634 or by calling 1-800-965-8307
or 954-785-1121.
|
|
|