You are not logged in.
This means you
CAN ONLY VIEW reports that were published prior to Friday, February 23, 2024.
You
MUST UPGRADE YOUR MEMBERSHIP if you want to see any current reports.
AFTER MARKET UPDATE - TUESDAY, AUGUST 16TH, 2022
Previous After Market Report Next After Market Report >>>
|
|
|
|
DOW |
+239.57 |
34,152.01 |
+0.71% |
|
Volume |
799,564,180 |
+8% |
|
Volume |
4,973,508,500 |
+13% |
|
NASDAQ |
-25.50 |
13,102.55 |
-0.19% |
|
Advancers |
1,674 |
54% |
|
Advancers |
1,962 |
44% |
|
S&P 500 |
+8.06 |
4,305.20 |
+0.19% |
|
Decliners |
1,441 |
46% |
|
Decliners |
2,520 |
56% |
|
Russell 2000 |
-0.82 |
2,020.53 |
-0.04% |
|
52 Wk Highs |
64 |
|
|
52 Wk Highs |
92 |
|
|
S&P 600 |
+5.43 |
1,297.83 |
+0.42% |
|
52 Wk Lows |
21 |
|
|
52 Wk Lows |
62 |
|
|
 |
Major Averages Ended Mixed While Walmart Rallied
Kenneth J. Gruneisen - Passed the CAN SLIM® Master's Exam
The Dow rose 239 points, trimming an earlier advance of as much as 368 points. The S&P 500 gained 0.2% while the Nasdaq Composite dipped 0.2% amid weakness in tech shares. The volume totals reported were higher than the prior session on the NYSE and on the Nasdaq exchange. Advancers led decliners by a narrow margin on the NYSE while decliners led advancers by a 5-4 margin on the Nasdaq exchange. There were 45 high-ranked companies from the Leaders List that hit new 52-week highs and were listed on the BreakOuts Page, versus the total of 48 on the prior session. New 52-week highs outnumbered new 52-week lows on the NYSE and on the Nasdaq exchange. The market is in a confirmed uptrend (M criteria). Any sustainable rally requires a healthy crop of leading stocks hitting new highs, so the recent improvement in leadership was a reassuring sign.
Chart courtesy of www.stockcharts.com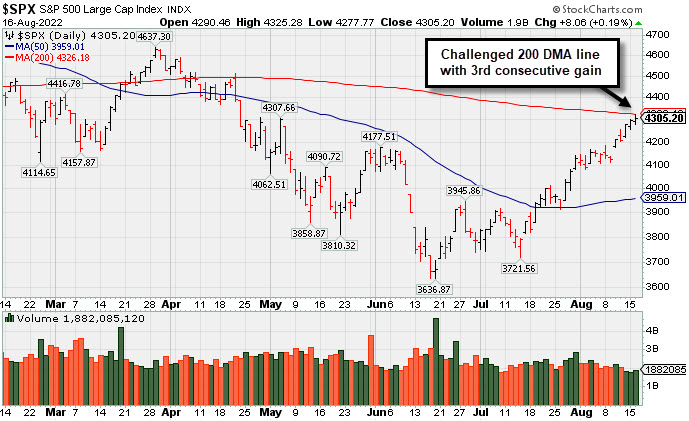 PICTURED: The S&P 500 Index posted a 3rd consecutive gain with lighter volume and closed just below its downward sloping 200-day moving average (DMA) line.
U.S. equities closed mixed after being whipsawed in volatile trading Tuesday as investors digested earnings from U.S. retailers and downbeat economic data. Walmart Inc. (WMT +5.11%) gapped up rebounding above its 200 DMA line in its best session since 2020 as its profit, revenue, and comparable store sales all exceeded analyst estimates. Additionally, the big-box retailer slightly increased its full-year guidance after cutting its outlook just three weeks ago due to inflation inciting a shift in consumer behavior. Meanwhile, home improvement company Home Depot Inc. (HD +4.06%) rose after posting better-than-expected results and maintaining its full-year guidance despite a housing market slowdown.
Another round of disappointing data dampened investor sentiment. Housing starts in July fell a worse-than-expected 9.6% from June to mark its worst reading since February 2021. Building permits declined 1.3% in the same period, its slowest pace since September 2021. Separately, industrial production increased a stronger-than-forecasted 0.6% in July, rising for the first time in three months.
Treasuries weakened with the yield on the 10-year note up one basis point (0.01%) to 2.81%. West Texas Intermediate crude slipped 3.3% to $86.45/barrel, its lowest point since mid-February. Downbeat economic data and uncertainty surrounding the revival of the 2015 Iran nuclear deal weighed on oil prices. Tomorrow, an update on retail sales for the month of July could provide insight into several macroeconomic trends. Also, investors will assess the Federal Open Market Committee’s (FOMC) meeting minutes from July for clues surrounding the future path of rate hikes. |
 Kenneth J. Gruneisen started out as a licensed stockbroker in August 1987, a couple of months prior to the historic stock market crash that took the Dow Jones Industrial Average down -22.6% in a single day. He has published daily fact-based fundamental and technical analysis on high-ranked stocks online for two decades. Through FACTBASEDINVESTING.COM, Kenneth provides educational articles, news, market commentary, and other information regarding proven investment systems that work in good times and bad.
Comments contained in the body of this report are technical opinions only and are not necessarily those of Gruneisen Growth Corp. The material herein has been obtained from sources believed to be reliable and accurate, however, its accuracy and completeness cannot be guaranteed. Our firm, employees, and customers may effect transactions, including transactions contrary to any recommendation herein, or have positions in the securities mentioned herein or options with respect thereto. Any recommendation contained in this report may not be suitable for all investors and it is not to be deemed an offer or solicitation on our part with respect to the purchase or sale of any securities. |
|
 |
Retail, Bank, and Gold & Silver Indexes Rose
Kenneth J. Gruneisen - Passed the CAN SLIM® Master's Exam
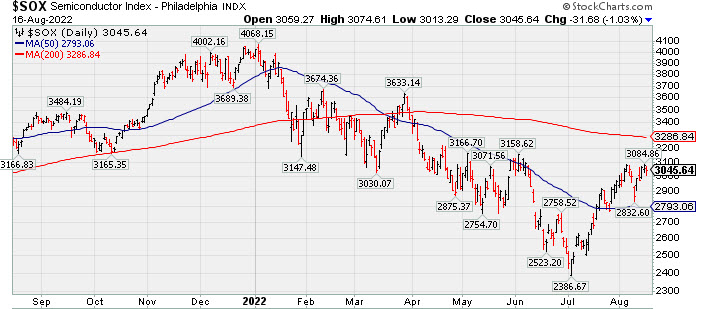
The Retail Index ($RLX +1.89%) posted an influential gain while the Bank Index ($BKX +0.80%) posted a smaller gain and the Broker/Dealer Index ($XBD +0.12%) inched higher. The Biotech Index ($BTK -1.23%) led the tech sector lower while the Semiconductor Index ($SOX -1.03%) followed, meanwhile the Networking Index ($NWX -0.07%) finished flat. Commodity-linked groups were mixed as the Oil Services Index ($OSX -1.01%) and Integrated Oil Index ($XOI -0.31%) both lost ground while the Gold & Silver Index ($XAU +0.51%) edged higher.
PICTURED: The Semiconductor Index ($SOX -1.03%) pulled back. It remains well below its downward sloping 200-day moving average (DMA) line.
| Oil Services |
$OSX |
66.53 |
-0.68 |
-1.01% |
+26.20% |
| Integrated Oil |
$XOI |
1,574.77 |
-4.85 |
-0.31% |
+33.66% |
| Semiconductor |
$SOX |
3,045.64 |
-31.68 |
-1.03% |
-22.82% |
| Networking |
$NWX |
845.15 |
-0.58 |
-0.07% |
-12.97% |
| Broker/Dealer |
$XBD |
470.46 |
+0.56 |
+0.12% |
-3.37% |
| Retail |
$RLX |
3,629.71 |
+67.21 |
+1.89% |
-14.12% |
| Gold & Silver |
$XAU |
110.10 |
+0.55 |
+0.51% |
-16.88% |
| Bank |
$BKX |
115.55 |
+0.92 |
+0.80% |
-12.61% |
| Biotech |
$BTK |
5,049.01 |
-62.94 |
-1.23% |
-8.51% |
|
|
|
 |
Stalled After Breakout But Still Quietly Hovering Near High
Kenneth J. Gruneisen - Passed the CAN SLIM® Master's Exam
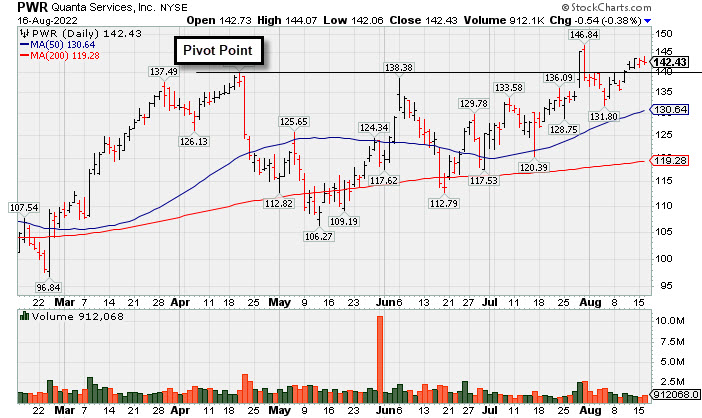
Quanta Services Inc (PWR -$0.54 or -0.38% to $142.43) has seen volume totals below average while recently wedging back above its pivot point since encountering some distributional pressure. Confirming volume-driven gains for new highs would be a reassuring sign of serious institutional buying demand that could lead to a sustained and meaningful advance. Fundamentals remain strong.
PWR was highlighted in yellow with pivot point cited based on its 4/20/22 high plus 10 cents in the 7/28/22 mid-day report (read here) and shown in greater detail that evening with an annotated graph under the headline, "Volume-Driven Breakout for Quanta Services". Since then, however, it stalled and has not made any headway.
It has a 98 Earnings Per Share Rating. Jun '22 quarterly earnings rose +45% on +41% sales revenues versus the year ago period, its 4th quarterly comparison above the +25% minimum earnings guideline (C criteria). Annual earnings (A criteria) growth has been strong and steady.
The company hails from the Building - Heavy Construction industry group which is currently ranked 71st on the 197 Industry Groups list with a Group Relative Strength Rating of B. The number of top-rated funds owning its shares rose from 1,202 in Sep '21 to 1,482 in Jun '22, a reassuring sign concerning the I criteria. It has 143.7 million shares outstanding (S criteria). |
|
|
Color Codes Explained :
Y - Better candidates highlighted by our
staff of experts.
G - Previously featured
in past reports as yellow but may no longer be buyable under the
guidelines.
***Last / Change / Volume data in this table is the closing quote data***
Symbol/Exchange
Company Name
Industry Group |
PRICE |
CHANGE
(%Change) |
Day High |
Volume
(% DAV)
(% 50 day avg vol) |
52 Wk Hi
% From Hi |
Featured
Date |
Price
Featured |
Pivot Featured |
|
Max Buy |
 IMXI
-
NASDAQ
IMXI
-
NASDAQ
International Money Exp
Financial Svcs-Specialty
|
$25.00
|
+0.10
0.40% |
$25.10
|
386,602
76.10% of 50 DAV
50 DAV is 508,000
|
$26.11
-4.25%
|
7/1/2022
|
$21.27
|
PP = $21.38
|
|
MB = $22.45
|
 Most Recent Note - 8/16/2022 6:13:52 PM
G - Perched near its all-time high, extended from the previously noted base. Prior highs in the $22 area and its 50 DMA line ($22.13) define important near-term support to watch. Reported Jun '22 quarterly earnings +21% on +17% sales revenues versus the year ago period, below the +25% minimum earnings guideline (C criteria).
>>> FEATURED STOCK ARTICLE : Finished Strong With Another Volume-Driven Gain After Earnings - 8/3/2022 |
View all notes |
Set NEW NOTE alert |
Company Profile |
SEC
News |
Chart |
Request a new note
C
A
S
I |
HRMY
-
NASDAQ
Harmony Biosciences Holdings
Medical-Biomed/Biotech
|
$50.11
|
-0.79
-1.55% |
$51.97
|
376,663
66.44% of 50 DAV
50 DAV is 566,900
|
$57.13
-12.29%
|
7/6/2022
|
$54.12
|
PP = $52.85
|
|
MB = $55.49
|
Most Recent Note - 8/15/2022 5:29:19 PM
Y - Pulled back today with near average volume. Recently finding support near its 50 DMA line ($50.40) and prior low ($48.85). More damaging losses would raise concerns and trigger technical sell signals. Challenged its all-time high but met stubborn resistance in the $57 area after reporting Jun '22 quarterly earnings +54% on +45% sales revenues versus the year ago period.
>>> FEATURED STOCK ARTICLE : Churning Higher Volume While Perched Near High After Earnings News - 8/4/2022 |
View all notes |
Set NEW NOTE alert |
Company Profile |
SEC
News |
Chart |
Request a new note
C
A
S
I |
CI
-
NYSE
Cigna Corp
Medical-Managed Care
|
$290.61
|
-0.26
-0.09% |
$293.20
|
1,491,667
72.91% of 50 DAV
50 DAV is 2,046,000
|
$293.50
-0.98%
|
7/7/2022
|
$276.55
|
PP = $273.68
|
|
MB = $287.36
|
Most Recent Note - 8/16/2022 6:19:29 PM
G - Hovering at its all-time high holding its ground after rising above its "max buy" level. Reported earnings for the Jun '22 quarter rose +19% on +5% sales revenues versus the year ago period, breaking a streak of 3 quarterly earnings increases above the +25% minimum guideline (C criteria), raising concerns. Near-term support to watch is at its 50 DMA line ($269.11).
>>> FEATURED STOCK ARTICLE : Wedging Higher With Lighter Volume Behind Gain for New High - 8/9/2022 |
View all notes |
Set NEW NOTE alert |
Company Profile |
SEC
News |
Chart |
Request a new note
C
A
S
I |
AN
-
NYSE
Autonation Inc
SPECIALTY RETAIL - Auto Dealerships
|
$132.49
|
+8.97
7.26% |
$135.57
|
1,021,111
145.81% of 50 DAV
50 DAV is 700,300
|
$133.48
-0.74%
|
7/20/2022
|
$122.03
|
PP = $126.49
|
|
MB = $132.81
|
Most Recent Note - 8/16/2022 6:08:14 PM
Y - Posted a big gain today backed by +46% above average volume clearing previously stubborn resistance in the $126 area and triggering a technical buy signal. Faces no resistance due to overhead supply. Reported Jun '22 quarterly earnings +34% on -2% sales revenues versus the year ago period.
>>> FEATURED STOCK ARTICLE : Autonation Hovering Near Stubborn Resistance - 8/11/2022 |
View all notes |
Set NEW NOTE alert |
Company Profile |
SEC
News |
Chart |
Request a new note
C
A
S
I |
ESQ
-
NASDAQ
Esquire Financial Hldgs
Finance-Commercial Loans
|
$40.18
|
-0.07
-0.17% |
$41.68
|
126,115
213.75% of 50 DAV
50 DAV is 59,000
|
$40.34
-0.40%
|
7/26/2022
|
$37.74
|
PP = $39.19
|
|
MB = $41.15
|
Most Recent Note - 8/16/2022 6:17:58 PM
Y - Encountered distributional pressure as there was a "negative reversal" today with +112% above average volume after hitting a new all-time high. It closed near the session low. Wedged above resistance in the $39 area with gains lacking volume conviction. Confirming gains above the pivot point backed by at least +40% above average volume may help clinch a proper technical buy signal. Its 50 DMA line ($35.51) defines important near-term support.
>>> FEATURED STOCK ARTICLE : Closed at Session High With Gain for New All-Time High - 8/12/2022 |
View all notes |
Set NEW NOTE alert |
Company Profile |
SEC
News |
Chart |
Request a new note
C
A
S
I |
Symbol/Exchange
Company Name
Industry Group |
PRICE |
CHANGE
(%Change) |
Day High |
Volume
(% DAV)
(% 50 day avg vol) |
52 Wk Hi
% From Hi |
Featured
Date |
Price
Featured |
Pivot Featured |
|
Max Buy |
GPK
-
NYSE
Graphic Packaging Hldg
CONSUMER NON-DURABLES - Packaging and Containers
|
$23.54
|
+0.26
1.12% |
$23.64
|
3,539,648
119.34% of 50 DAV
50 DAV is 2,966,000
|
$23.63
-0.38%
|
7/26/2022
|
$22.63
|
PP = $23.09
|
|
MB = $24.24
|
Most Recent Note - 8/15/2022 5:23:09 PM
Y - Churned heavy volume as it paused today after a streak of 6 consecutive gains for new 52-week highs triggered a technical buy signal. See the latest FSU analysis for more details and a new annotated graph.
>>> FEATURED STOCK ARTICLE : Churned Heavy Volume Perched at High After 6 Straight Gains - 8/15/2022 |
View all notes |
Set NEW NOTE alert |
Company Profile |
SEC
News |
Chart |
Request a new note
C
A
S
I |
CSL
-
NYSE
Carlisle Cos Inc
Diversified Operations
|
$315.59
|
-0.55
-0.17% |
$318.71
|
414,645
106.05% of 50 DAV
50 DAV is 391,000
|
$317.33
-0.55%
|
7/28/2022
|
$282.31
|
PP = $275.23
|
|
MB = $288.99
|
Most Recent Note - 8/15/2022 5:25:11 PM
G - Hit yet another new all-time high with today's 4th consecutive volume-driven gain, getting very extended from the previously noted base. Prior highs in the $275 area define initial support to watch on pullbacks.
>>> FEATURED STOCK ARTICLE : Carlisle Perched at All-Time High After Noted Breakout - 8/2/2022 |
View all notes |
Set NEW NOTE alert |
Company Profile |
SEC
News |
Chart |
Request a new note
C
A
S
I |
ENPH
-
NASDAQ
Enphase Energy Inc
Energy-Solar
|
$292.94
|
-8.19
-2.72% |
$299.58
|
3,546,422
106.02% of 50 DAV
50 DAV is 3,345,000
|
$308.88
-5.16%
|
7/28/2022
|
$276.66
|
PP = $282.55
|
|
MB = $296.68
|
Most Recent Note - 8/16/2022 6:09:58 PM
Y - Lost ground today with average volume, and its color code is changed to yellow after pulling back below its "max buy" level. The prior high in the $282 area has been noted as initial support to watch on pullbacks. Fundamentals remain strong.
>>> FEATURED STOCK ARTICLE : Pullback Following 3 Consecutive Gains With Heavier Volume - 8/1/2022 |
View all notes |
Set NEW NOTE alert |
Company Profile |
SEC
News |
Chart |
Request a new note
C
A
S
I |
PWR
-
NYSE
Quanta Services Inc
MATERIALS and CONSTRUCTION - General Contractors
|
$142.43
|
-0.54
-0.38% |
$144.07
|
911,463
69.74% of 50 DAV
50 DAV is 1,307,000
|
$146.84
-3.00%
|
7/28/2022
|
$141.83
|
PP = $140.14
|
|
MB = $147.15
|
Most Recent Note - 8/16/2022 6:06:01 PM
Y - Volume totals have been below average after recently wedging back above its pivot point since encountering some distributional pressure. Confirming volume-driven gains for new highs would be a reassuring sign of serious institutional buying demand. Fundamentals remain strong. See the latest FSU analysis for more details and a new annotated graph.
>>> FEATURED STOCK ARTICLE : Stalled After Breakout But Still Quietly Hovering Near High - 8/16/2022 |
View all notes |
Set NEW NOTE alert |
Company Profile |
SEC
News |
Chart |
Request a new note
C
A
S
I |
CLFD
-
NASDAQ
Clearfield Inc
TELECOMMUNICATIONS - Cables / Satalite Equipment
|
$118.99
|
-1.87
-1.55% |
$121.20
|
255,203
80.76% of 50 DAV
50 DAV is 316,000
|
$121.88
-2.37%
|
7/29/2022
|
$94.10
|
PP = $86.81
|
|
MB = $91.15
|
Most Recent Note - 8/15/2022 5:30:19 PM
G - Posted another gain today with slightly above average volume for a new all-time high. Prior high in the $86 area defines initial support to watch on pullbacks. Fundamentals remain strong.
>>> FEATURED STOCK ARTICLE : Volume Heavy Behind Technical Breakout - 7/29/2022 |
View all notes |
Set NEW NOTE alert |
Company Profile |
SEC
News |
Chart |
Request a new note
C
A
S
I |
Symbol/Exchange
Company Name
Industry Group |
PRICE |
CHANGE
(%Change) |
Day High |
Volume
(% DAV)
(% 50 day avg vol) |
52 Wk Hi
% From Hi |
Featured
Date |
Price
Featured |
Pivot Featured |
|
Max Buy |
GFF
-
NYSE
Griffon Corporation
MATERIALS and CONSTRUCTION - General Building Materials
|
$33.38
|
-0.03
-0.09% |
$33.49
|
253,177
55.64% of 50 DAV
50 DAV is 455,000
|
$34.35
-2.82%
|
8/8/2022
|
$32.46
|
PP = $31.12
|
|
MB = $32.68
|
Most Recent Note - 8/16/2022 6:12:21 PM
G - Pulled back today for a 3rd consecutive small loss with light volume, hovering near its 52-week high. Prior highs in the $31 area define initial support to watch on pullbacks.
>>> FEATURED STOCK ARTICLE : Breakout for New High Backed by +52% Above Average Volume - 8/8/2022 |
View all notes |
Set NEW NOTE alert |
Company Profile |
SEC
News |
Chart |
Request a new note
C
A
S
I |
CLH
-
NYSE
Clean Harbors Inc
Pollution Control
|
$118.13
|
+1.80
1.55% |
$118.16
|
275,591
86.39% of 50 DAV
50 DAV is 319,000
|
$118.92
-0.66%
|
8/10/2022
|
$111.78
|
PP = $115.10
|
|
MB = $120.86
|
Most Recent Note - 8/15/2022 5:33:20 PM
Y - Pulled back today with average volume. Prior gain and strong close above the pivot point backed by +116% above average volume triggered a technical buy signal. No resistance remains due to overhead supply. Fundamentals remain strong.
>>> FEATURED STOCK ARTICLE : Pollution Control Firm Perched Near Prior High - 8/10/2022 |
View all notes |
Set NEW NOTE alert |
Company Profile |
SEC
News |
Chart |
Request a new note
C
A
S
I |
|
|
|
THESE ARE NOT BUY RECOMMENDATIONS!
Comments contained in the body of this report are technical
opinions only. The material herein has been obtained
from sources believed to be reliable and accurate, however,
its accuracy and completeness cannot be guaranteed.
This site is not an investment advisor, hence it does
not endorse or recommend any securities or other investments.
Any recommendation contained in this report may not
be suitable for all investors and it is not to be deemed
an offer or solicitation on our part with respect to
the purchase or sale of any securities. All trademarks,
service marks and trade names appearing in this report
are the property of their respective owners, and are
likewise used for identification purposes only.
This report is a service available
only to active Paid Premium Members.
You may opt-out of receiving report notifications
at any time. Questions or comments may be submitted
by writing to Premium Membership Services 665 S.E. 10 Street, Suite 201 Deerfield Beach, FL 33441-5634 or by calling 1-800-965-8307
or 954-785-1121.
|
|
|