You are not logged in.
This means you
CAN ONLY VIEW reports that were published prior to Sunday, February 25, 2024.
You
MUST UPGRADE YOUR MEMBERSHIP if you want to see any current reports.
AFTER MARKET UPDATE - THURSDAY, AUGUST 15TH, 2019
Previous After Market Report Next After Market Report >>>
|
|
|
|
DOW |
+99.97 |
25,579.39 |
+0.39% |
|
Volume |
875,644,210 |
-11% |
|
Volume |
2,160,088,800 |
-14% |
|
NASDAQ |
-7.39 |
7,766.55 |
-0.10% |
|
Advancers |
1,485 |
53% |
|
Advancers |
1,280 |
42% |
|
S&P 500 |
+6.99 |
2,847.59 |
+0.25% |
|
Decliners |
1,335 |
47% |
|
Decliners |
1,788 |
58% |
|
Russell 2000 |
-5.87 |
1,461.65 |
-0.40% |
|
52 Wk Highs |
143 |
|
|
52 Wk Highs |
68 |
|
|
S&P 600 |
-3.27 |
899.48 |
-0.36% |
|
52 Wk Lows |
297 |
|
|
52 Wk Lows |
307 |
|
|
 |
Major Indices Make a Rebound With Lighter Volume
Kenneth J. Gruneisen - Passed the CAN SLIM® Master's Exam
The Dow gained 99 points, rebounding modestly from its worst session of the year. The S&P 500 rose 0.3%, while the Nasdaq Composite lost 0.1%. Volume totals reported were lighter than the prior session totals on the NYSE and on the Nasdaq exchange. Advancers led decliners by a narrow margin on the NYSE, but decliners led advancers by almost a 3-2 margin on the Nasdaq exchange. There were 18 high-ranked companies from the Leaders List hit new 52-week highs and were listed on the BreakOuts Page, versus the total of 8 on the prior session. New 52-week lows totals easily outnumbered new 52-week highs on the NYSE and on the Nasdaq exchange. The Featured Stocks Page provides the most timely analysis on high-ranked leaders.Charts used courtesy of www.stockcharts.com
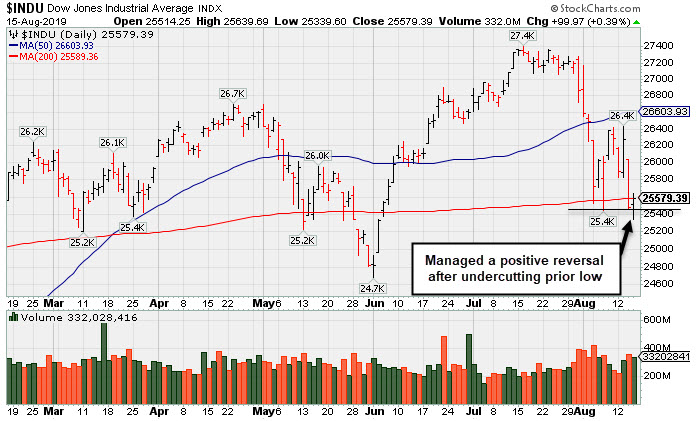
PICTURED: The Dow Jones Industrial Average suffered a big loss on heavier volume Wednesday, then managed a "positive reversal" today after undercutting the recent low. A follow-through day on 8/13/19 marked a bullish shift concerning the M criteria of the fact-based investment system, giving investors a green light to make carefully selected new buying efforts. But losses below prior lows have essentially killed the new rally.
Stocks were mixed on Thursday, as investors assessed positive economic data against a backdrop of recessionary fears. A report showed U.S. retail sales advanced 0.7% in July, the largest uptick since March and the fifth-straight monthly gain. Separately, the Empire State Manufacturing Survey and the Philadelphia Fed Business Outlook both indicated continued expansion in August. Gains in the equity market were capped however as Treasuries extended their recent rally. The yield on the 10-year note fell eight basis points to 1.50%. Notably, the yield on the two-year note remained just below this point at 1.47%, after this portion of the yield curve briefly inverted for the first time since 2007 on Wednesday.
Investors also assessed mixed trade headlines. Overnight, Beijing vowed to retaliate against the most recent tariffs proposed by Washington. In a later statement, a Chinese foreign ministry representative struck a more conciliatory tone, suggesting hopes that the U.S. can meet China halfway in negotiating a trade deal.
Six of 11 S&P 500 sectors ended in positive territory. The Consumer Staples group paced the gains with Walmart (WMT +6.11%) rose after lifting its full-year forecast and delivering a top and bottom line beat. Energy stocks lagged, as WTI crude slid 1.4% to $54.48/barrel. The Technology sector also missed out on the gains, with Cisco Systems (CSCO -8.61%) fell on disappointing forward guidance, citing pressure from lingering trade tensions.
|
 Kenneth J. Gruneisen started out as a licensed stockbroker in August 1987, a couple of months prior to the historic stock market crash that took the Dow Jones Industrial Average down -22.6% in a single day. He has published daily fact-based fundamental and technical analysis on high-ranked stocks online for two decades. Through FACTBASEDINVESTING.COM, Kenneth provides educational articles, news, market commentary, and other information regarding proven investment systems that work in good times and bad.
Comments contained in the body of this report are technical opinions only and are not necessarily those of Gruneisen Growth Corp. The material herein has been obtained from sources believed to be reliable and accurate, however, its accuracy and completeness cannot be guaranteed. Our firm, employees, and customers may effect transactions, including transactions contrary to any recommendation herein, or have positions in the securities mentioned herein or options with respect thereto. Any recommendation contained in this report may not be suitable for all investors and it is not to be deemed an offer or solicitation on our part with respect to the purchase or sale of any securities. |
|
 |
Gold & Silver, Retail, and Broker/Dealer Indexes Rose
Kenneth J. Gruneisen - Passed the CAN SLIM® Master's Exam
The Gold & Silver Index ($XAU +0.99%) was a standout gainer. The Retail Index ($RLX +0.24%) and Broker/Dealer Index ($XBD +0.57%) also posted small gains, meanwhile the Bank Index ($BKX -0.40%) suffered another loss. The tech sector had a negative bias as the Networking Index ($NWX -1.84%) outpaced both the Semiconductor Index ($SOX -0.23%) and the Biotech Index ($BTK -0.26%) to the downside. The Integrated Oil Index ($XOI -0.27%) and the Oil Services Index ($OSX -1.60%) also suffered losses.
Charts courtesy of www.stockcharts.com
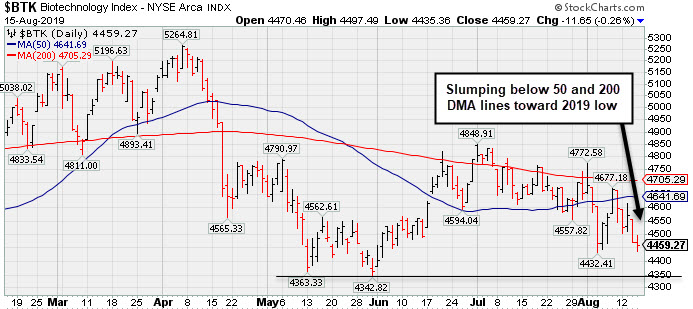
PICTURED: The Biotech Index ($BTK -0.26%) is slumping below its 50-day and 200-day moving average (DMA) lines, toward its 2019 low.
| Oil Services |
$OSX |
60.21 |
-0.98 |
-1.60% |
-25.30% |
| Integrated Oil |
$XOI |
1,144.78 |
-3.12 |
-0.27% |
-1.24% |
| Semiconductor |
$SOX |
1,439.29 |
-3.25 |
-0.23% |
+24.60% |
| Networking |
$NWX |
540.62 |
-10.14 |
-1.84% |
+10.63% |
| Broker/Dealer |
$XBD |
244.65 |
+1.38 |
+0.57% |
+3.08% |
| Retail |
$RLX |
2,239.59 |
+5.39 |
+0.24% |
+14.77% |
| Gold & Silver |
$XAU |
93.82 |
+0.91 |
+0.98% |
+32.78% |
| Bank |
$BKX |
89.30 |
-0.35 |
-0.39% |
+4.09% |
| Biotech |
$BTK |
4,459.27 |
-11.64 |
-0.26% |
+5.65% |
|
|
|
 |
Sputtering After Slump Below 50-Day Moving Average
Kenneth J. Gruneisen - Passed the CAN SLIM® Master's Exam
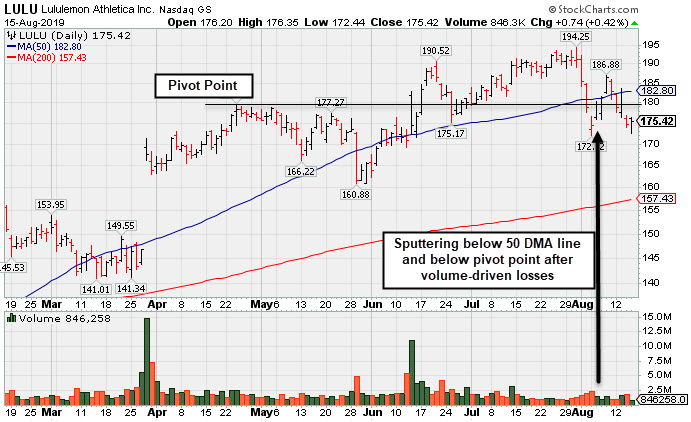
Lululemon Athletica (LULU ) has been sputtering below its 50-day moving average (DMA) line ($182.80). A rebound above the 50 DMA line is needed to help its technical stance improve. LULU reported Apr '19 quarterly earnings +35% on +20% sales revenues versus the ear ago period, marking its 6th consecutive quarterly comparison above the +25% minimum guideline (C criteria). Recent quarterly comparisons showed stronger sales revenues and earnings improvement helping it match with the fact-based investment system's fundamental guidelines. It has a new CEO as of 8/20/18. It currently has a 95 Earnings Per Share Rating. Its Timeliness rating is B and Sponsorship rating is C. Its last appearance in this FSU section was on 7/17/19 with an annotated graph under the headline, "Quietly Hovering at All-Time High". Following a "breakaway gap" it was highlighted in yellow with pivot point cited based on its 10/01/18 high plus 10 cents in the 3/28/19 mid-day report (read here). The number of top-rated funds owning its shares rose from 1,041 in Jun '18 to 1,406 in Jun '19, a good sign concerning the I criteria. LULU was first featured in yellow at $23.83 (split adjusted after 2:1 split effective 7/21/11) in the October 8, 2010 mid-day report (read here) and it traded up as much as +163.7% in a little more than 9 months. As previously noted - "In a bullish market, many high-ranked leaders offer multiple opportunities to accumulate their shares under the fact-based system's strict guidelines. Patience may often allow another ideal base or secondary buy point to possibly develop and be noted." Charts courtesy of www.stockcharts.com
|
|
|
Color Codes Explained :
Y - Better candidates highlighted by our
staff of experts.
G - Previously featured
in past reports as yellow but may no longer be buyable under the
guidelines.
***Last / Change / Volume data in this table is the closing quote data***
Symbol/Exchange
Company Name
Industry Group |
PRICE |
CHANGE
(%Change) |
Day High |
Volume
(% DAV)
(% 50 day avg vol) |
52 Wk Hi
% From Hi |
Featured
Date |
Price
Featured |
Pivot Featured |
|
Max Buy |
 SPSC
-
NASDAQ
SPSC
-
NASDAQ
S P S Commerce Inc
COMPUTER SOFTWARE and SERVICES - Application Software
|
$102.20
|
-0.58
-0.56% |
$103.07
|
101,813
81.00% of 50 DAV
50 DAV is 125,700
|
$118.28
-13.59%
|
6/7/2019
|
$107.72
|
PP = $115.10
|
|
MB = $120.86
|
Most Recent Note - 8/13/2019 6:36:10 PM
Y - Finding support recently at its 50 DMA line ($105.43). Stalled after a gap up and big volume-driven gain noted on 7/26/19. Subsequent gains and a strong close above the pivot point may clinch a convincing new (or add-on) technical buy signal. Reported earnings +22% on +12% sales revenues for the Jun '19 quarter, slightly under the +25% minimum earnings guideline (C criteria), raising fundamental concerns.
>>> FEATURED STOCK ARTICLE : Found Support at 50-Day Average - 8/8/2019 |
View all notes |
Set NEW NOTE alert |
Company Profile |
SEC
News |
Chart |
Request a new note
C
A
S
I |
EPAM
-
NYSE
Epam Systems Inc
COMPUTER SOFTWARE and SERVICES - Information Technology Service
|
$184.48
|
+2.14
1.17% |
$185.27
|
437,766
104.73% of 50 DAV
50 DAV is 418,000
|
$201.00
-8.22%
|
5/9/2019
|
$169.25
|
PP = $180.55
|
|
MB = $189.58
|
Most Recent Note - 8/14/2019 5:55:01 PM
G - Quietly slumped to a close below its 50 DMA line hurting its outlook and its color code is changed to green. Reported earnings +27% on +24% sales revenues for the Jun '19 quarter. See the latest FSU analysis for more details and an annotated graph.
>>> FEATURED STOCK ARTICLE : Rebounded Above 50-Day Average Following Earnings Report - 8/12/2019 |
View all notes |
Set NEW NOTE alert |
Company Profile |
SEC
News |
Chart |
Request a new note
C
A
S
I |
AUDC
-
NASDAQ
Audiocodes Ltd
ELECTRONICS - Scientific and Technical Instrum
|
$17.26
|
-0.13
-0.75% |
$17.44
|
130,914
73.96% of 50 DAV
50 DAV is 177,000
|
$19.74
-12.56%
|
7/15/2019
|
$17.10
|
PP = $17.54
|
|
MB = $18.42
|
Most Recent Note - 8/14/2019 12:09:28 PM
Y - Pulling back with higher volume today while testing prior highs in the $17 area and its 50 DMA line ($16.67) noted as important support. Reported earnings +57% on +14% sales revenues for the Jun '19 quarter, continuing its strong earnings track record. See the latest FSU analysis for more details and an annotated graph.
>>> FEATURED STOCK ARTICLE : Volume Totals Cooling as Bullish Action Continues - 8/13/2019 |
View all notes |
Set NEW NOTE alert |
Company Profile |
SEC
News |
Chart |
Request a new note
C
A
S
I |
LHCG
-
NASDAQ
L H C Group Inc
HEALTH SERVICES - Home Health Care
|
$119.62
|
-1.20
-0.99% |
$121.69
|
162,887
73.04% of 50 DAV
50 DAV is 223,000
|
$129.37
-7.54%
|
7/1/2019
|
$110.94
|
PP = $122.20
|
|
MB = $128.31
|
 Most Recent Note - 8/15/2019 4:16:53 PM
G - Still sputtering near its 50 DMA line ($120). Any breach of recent low ($116.67 on 8/13/19) would raise more serious concerns. Reported earnings +27% on +3% sales revenues for the Jun '19 quarter. Prior quarterly comparisons showed much stronger sales revenues growth. Recent gains above its pivot point were not backed by the +40% above average volume needed to trigger a proper new (or add-on) technical buy signal.
>>> FEATURED STOCK ARTICLE : Consolidating Following a Negative Reversal at High - 7/22/2019 |
View all notes |
Set NEW NOTE alert |
Company Profile |
SEC
News |
Chart |
Request a new note
C
A
S
I |
CHDN
-
NASDAQ
Churchill Downs Inc
LEISURE - Gaming Activities
|
$116.74
|
-0.30
-0.26% |
$117.48
|
126,515
49.04% of 50 DAV
50 DAV is 258,000
|
$132.73
-12.05%
|
7/22/2019
|
$118.45
|
PP = $118.89
|
|
MB = $124.83
|
Most Recent Note - 8/14/2019 5:50:05 PM
Y - Found support recently above its 50 DMA line ($116.55). Reported Jun '19 earnings rose +10% on +26% sales revenues versus the year ago period, below the +25% minimum earnings guideline (C criteria). The prior low ($113.88 on 8/05/19) defines the next important near-term support to watch below its 50 DMA line. See the latest FSU analysis for more details and a new annotated graph.
>>> FEATURED STOCK ARTICLE : Recently Found Support at 50-Day Moving Average - 8/14/2019 |
View all notes |
Set NEW NOTE alert |
Company Profile |
SEC
News |
Chart |
Request a new note
C
A
S
I |
Symbol/Exchange
Company Name
Industry Group |
PRICE |
CHANGE
(%Change) |
Day High |
Volume
(% DAV)
(% 50 day avg vol) |
52 Wk Hi
% From Hi |
Featured
Date |
Price
Featured |
Pivot Featured |
|
Max Buy |
LULU
-
NASDAQ
Lululemon Athletica
MANUFACTURING - Textile Manufacturing
|
$175.44
|
+0.76
0.44% |
$176.35
|
1,133,662
55.60% of 50 DAV
50 DAV is 2,039,000
|
$194.25
-9.68%
|
6/13/2019
|
$174.48
|
PP = $179.60
|
|
MB = $188.58
|
Most Recent Note - 8/15/2019 4:14:45 PM
G - Still sputtering below its 50 DMA line ($182.81) which may act as resistance. A rebound above the 50 DMA line is needed to help its technical stance improve. Reported Apr '19 quarterly earnings +35% on +20% sales revenues versus the year ago period. See the latest FSU analysis for more details and a new annotated graph.
>>> FEATURED STOCK ARTICLE : Sputtering After Slump Below 50-Day Moving Average - 8/15/2019 |
View all notes |
Set NEW NOTE alert |
Company Profile |
SEC
News |
Chart |
Request a new note
C
A
S
I |
ULTA
-
NASDAQ
Ulta Beauty Inc
SPECIALTY RETAIL - Specialty Retail, Other
|
$320.44
|
-0.56
-0.17% |
$324.87
|
980,912
145.75% of 50 DAV
50 DAV is 673,000
|
$368.83
-13.12%
|
3/15/2019
|
$341.27
|
PP = $322.59
|
|
MB = $338.72
|
Most Recent Note - 8/15/2019 1:26:59 PM
G - Testing its 200 DMA line ($317) today. Technical weakness raised concerns, and a rebound above its 50 DMA line ($347) is needed for its outlook to improve. Reported earnings +17% on +13% sales revenues for the Apr '19 quarter, below the +25% minimum earnings guideline (C criteria), raising fundamental concerns.
>>> FEATURED STOCK ARTICLE : Ulta Beauty Sputtering Below 50-Day Moving Average - 8/7/2019 |
View all notes |
Set NEW NOTE alert |
Company Profile |
SEC
News |
Chart |
Request a new note
C
A
S
I |
CHGG
-
NYSE
Chegg Inc
Consumer Svcs-Education
|
$39.54
|
-0.06
-0.15% |
$40.11
|
1,770,880
116.51% of 50 DAV
50 DAV is 1,520,000
|
$48.22
-18.00%
|
7/8/2019
|
$44.11
|
PP = $41.79
|
|
MB = $43.88
|
Most Recent Note - 8/14/2019 5:53:24 PM
G - Color code is changed to green after a more damaging loss raised concerns and triggered a technical sell signal. Slumped below prior highs in the $40-41 area and below its 50 DMA line ($41.53). A prompt rebound above the 50 DMA line is needed for its outlook to improve. Reported earnings +92% on +26% sales revenues for the Jun '19 quarter.
>>> FEATURED STOCK ARTICLE : Consolidating Above Prior Highs and 50-Day Average - 8/6/2019 |
View all notes |
Set NEW NOTE alert |
Company Profile |
SEC
News |
Chart |
Request a new note
C
A
S
I |
VEEV
-
NYSE
Veeva Systems Inc Cl A
Computer Sftwr-Medical
|
$158.60
|
+1.73
1.10% |
$159.39
|
820,151
57.72% of 50 DAV
50 DAV is 1,421,000
|
$176.90
-10.34%
|
5/30/2019
|
$154.32
|
PP = $145.80
|
|
MB = $153.09
|
Most Recent Note - 8/15/2019 4:17:33 PM
G - Still sputtering below its 50 DMA line ($165.56) which acted as resistance after volume-driven losses. A rebound above the 50 DMA line is needed for its outlook to improve. Fundamentals remain strong.
>>> FEATURED STOCK ARTICLE : Recently Found Support Near 50-Day Moving Average - 8/1/2019 |
View all notes |
Set NEW NOTE alert |
Company Profile |
SEC
News |
Chart |
Request a new note
C
A
S
I |
PAYC
-
NYSE
Paycom Software Inc
COMPUTER SOFTWARE and SERVICES - Application Software
|
$235.14
|
+2.84
1.22% |
$236.19
|
348,886
54.26% of 50 DAV
50 DAV is 643,000
|
$246.85
-4.74%
|
2/6/2019
|
$171.66
|
PP = $164.18
|
|
MB = $172.39
|
Most Recent Note - 8/14/2019 5:57:58 PM
G - Fell near its 50 DMA line ($230.89) today while still building on a new flat base. Reported earnings +27% on +31% sales revenues for the Jun '19 quarter, continuing its strong earnings track record.
>>> FEATURED STOCK ARTICLE : Found Support and Gapped Up Following Earnings Report - 8/2/2019 |
View all notes |
Set NEW NOTE alert |
Company Profile |
SEC
News |
Chart |
Request a new note
C
A
S
I |
Symbol/Exchange
Company Name
Industry Group |
PRICE |
CHANGE
(%Change) |
Day High |
Volume
(% DAV)
(% 50 day avg vol) |
52 Wk Hi
% From Hi |
Featured
Date |
Price
Featured |
Pivot Featured |
|
Max Buy |
BLD
-
NYSE
Topbuild Corp
Bldg-Constr Prds/Misc
|
$89.77
|
+0.38
0.43% |
$90.31
|
196,925
62.52% of 50 DAV
50 DAV is 315,000
|
$92.07
-2.50%
|
5/17/2019
|
$82.19
|
PP = $87.31
|
|
MB = $91.68
|
Most Recent Note - 8/13/2019 6:26:03 PM
G - Posted a gain with light volume today for a best-ever close and its color code is changed to green. Bullish action came after it reported earnings +39% on +9% sales revenues for the Jun '19 quarter versus the year ago period, continuing its strong earnings track record. Its 50 DMA line ($82.36) and recent lows define near-term support to watch on pullbacks.
>>> FEATURED STOCK ARTICLE : Perched Near 52-Week High Finding Support - 7/25/2019 |
View all notes |
Set NEW NOTE alert |
Company Profile |
SEC
News |
Chart |
Request a new note
C
A
S
I |
TEAM
-
NASDAQ
Atlassian Corp Plc Cl A
Comp Sftwr-Spec Enterprs
|
$139.50
|
+0.01
0.01% |
$140.75
|
900,222
69.95% of 50 DAV
50 DAV is 1,287,000
|
$149.80
-6.88%
|
5/24/2019
|
$129.52
|
PP = $132.09
|
|
MB = $138.69
|
Most Recent Note - 8/14/2019 5:59:55 PM
G - Pulled back toward support at its 50 DMA line ($135.56). Its prior low ($130.78 on 7/23/19) defines the next important near-term support to watch where a violation would raise serious concerns and trigger a more worrisome technical sell signal. Reported earnings +43% on +36% sales revenues for the Jun '19 quarter, continuing its strong earnings track record.
>>> FEATURED STOCK ARTICLE : Abrupt Retreat After Getting Very Extended From Prior Base - 7/29/2019 |
View all notes |
Set NEW NOTE alert |
Company Profile |
SEC
News |
Chart |
Request a new note
C
A
S
I |
GLOB
-
NYSE
Globant SA
Computer-Tech Services
|
$101.11
|
+0.48
0.48% |
$101.87
|
460,524
147.60% of 50 DAV
50 DAV is 312,000
|
$112.33
-9.99%
|
2/15/2019
|
$69.35
|
PP = $70.00
|
|
MB = $73.50
|
Most Recent Note - 8/14/2019 5:56:48 PM
G - Big loss on light volume today violated its 50 DMA line ($103.55) raising concerns. It has not formed a sound new base of sufficient length. Due to report earnings news on 8/15/19. Volume and volatility often increase near earnings news.
>>> FEATURED STOCK ARTICLE : Consolidating Above 50-Day Average With Earnings News Soon - 8/9/2019 |
View all notes |
Set NEW NOTE alert |
Company Profile |
SEC
News |
Chart |
Request a new note
C
A
S
I |
TTD
-
NASDAQ
The Trade Desk Inc Cl A
Comml Svcs-Advertising
|
$243.52
|
-6.87
-2.74% |
$253.86
|
1,485,015
98.02% of 50 DAV
50 DAV is 1,515,000
|
$289.51
-15.89%
|
7/18/2019
|
$240.61
|
PP = $258.10
|
|
MB = $271.01
|
Most Recent Note - 8/14/2019 6:01:03 PM
Y - Testing its 50 DMA line ($247) which defines important support. Reported Jun '19 quarterly earnings +58% on +42% sales revenues.
>>> FEATURED STOCK ARTICLE : Endured Distributional Pressure While Building on New Base - 7/18/2019 |
View all notes |
Set NEW NOTE alert |
Company Profile |
SEC
News |
Chart |
Request a new note
C
A
S
I |
PAGS
-
NYSE
Pagseguro Digital Cl A
Finance-CrdtCard/PmtPr
|
$46.52
|
+0.72
1.57% |
$47.49
|
2,646,000
119.84% of 50 DAV
50 DAV is 2,208,000
|
$48.88
-4.83%
|
6/25/2019
|
$37.69
|
PP = $40.07
|
|
MB = $42.07
|
Most Recent Note - 8/13/2019 12:46:12 PM
G - Posting a solid gain today with light volume. Earnings news is due on 8/15/19. Prior high in the $40 area defines initial support to watch along with its 50 DMA line ($41.32).
>>> FEATURED STOCK ARTICLE : Encountering Distributional Pressure After Impressive Sprint - 7/30/2019 |
View all notes |
Set NEW NOTE alert |
Company Profile |
SEC
News |
Chart |
Request a new note
C
A
S
I |
Symbol/Exchange
Company Name
Industry Group |
PRICE |
CHANGE
(%Change) |
Day High |
Volume
(% DAV)
(% 50 day avg vol) |
52 Wk Hi
% From Hi |
Featured
Date |
Price
Featured |
Pivot Featured |
|
Max Buy |
|
|
|
THESE ARE NOT BUY RECOMMENDATIONS!
Comments contained in the body of this report are technical
opinions only. The material herein has been obtained
from sources believed to be reliable and accurate, however,
its accuracy and completeness cannot be guaranteed.
This site is not an investment advisor, hence it does
not endorse or recommend any securities or other investments.
Any recommendation contained in this report may not
be suitable for all investors and it is not to be deemed
an offer or solicitation on our part with respect to
the purchase or sale of any securities. All trademarks,
service marks and trade names appearing in this report
are the property of their respective owners, and are
likewise used for identification purposes only.
This report is a service available
only to active Paid Premium Members.
You may opt-out of receiving report notifications
at any time. Questions or comments may be submitted
by writing to Premium Membership Services 665 S.E. 10 Street, Suite 201 Deerfield Beach, FL 33441-5634 or by calling 1-800-965-8307
or 954-785-1121.
|
|
|

