You are not logged in.
This means you
CAN ONLY VIEW reports that were published prior to Saturday, February 24, 2024.
You
MUST UPGRADE YOUR MEMBERSHIP if you want to see any current reports.
AFTER MARKET UPDATE - FRIDAY, AUGUST 14TH, 2020
Previous After Market Report Next After Market Report >>>
|
|
|
|
DOW |
+34.30 |
27,931.02 |
+0.12% |
|
Volume |
715,612,990 |
-0% |
|
Volume |
3,458,561,600 |
+0% |
|
NASDAQ |
-23.20 |
11,019.30 |
-0.21% |
|
Advancers |
1,464 |
50% |
|
Advancers |
1,524 |
47% |
|
S&P 500 |
-0.58 |
3,372.85 |
-0.02% |
|
Decliners |
1,446 |
50% |
|
Decliners |
1,750 |
53% |
|
Russell 2000 |
-1.91 |
1,577.88 |
-0.12% |
|
52 Wk Highs |
44 |
|
|
52 Wk Highs |
55 |
|
|
S&P 600 |
+0.33 |
917.90 |
+0.04% |
|
52 Wk Lows |
7 |
|
|
52 Wk Lows |
14 |
|
|
 |
Leadership Waned as Major Indices Were Little Changed
Kenneth J. Gruneisen - Passed the CAN SLIM® Master's Exam
The S&P 500 ended just below the flat line, but still posted a gain of 0.6% for the week and remains within 0.4% of its February 19 all-time closing high. The Dow added 34 points, trimming its weekly advance to 1.8%. The Nasdaq Composite was down 0.2%, dipping 0.1% for the week as Tech shares underperformed. The reported volume totals were near the prior session totals on the NYSE and on the Nasdaq exchange. Decliners led advancers by an 8-7 margin on the Nasdaq exchange while the mix was nearly even on the NYSE. Leadership thinned as there were 22 high-ranked companies from the Leaders List that hit new 52-week highs and were listed on the BreakOuts Page, versus the total of 42 on the prior session. New 52-week highs totals still outnumbered new 52-week lows totals again on both the NYSE and the Nasdaq exchange. The major indices are in a confirmed uptrend (M criteria). Any sustainable rally requires a healthy crop of new leaders, so it remains ever-important to see substantial new highs totals. Charts used courtesy of www.stockcharts.com
PICTURED: The Dow Jones Industrial Average is perched -5.5% off its record high. Stocks finished mixed on Friday as investors digested economic data. Retail sales increased 1.2% in July, falling short of consensus estimates and well below the prior month’s upwardly revised 8.4% gain. Separately, a preliminary update from the University of Michigan revealed consumer sentiment unexpectedly improved in August. Treasuries were little changed, with the yield on the 10-year note steady at 0.71%, though the benchmark rate saw its largest weekly uptick since March (+15 basis points). In commodities, COMEX gold retreated 0.8% to $1,941.00/ounce, snapping a nine-week winning streak, while WTI crude pared its second-straight weekly gain.
Six of 11 S&P 500 sectors closed in negative territory with Utilities leading decliners. The more traditionally cyclical groups continued to outperform, with Industrials climbing more than 3% for the week. In earnings, Applied Materials (AMAT +3.92%) rose after the chipmaker delivered a top and bottom line beat and provided upbeat forward guidance. In other corporate news, Novavax (NVAX +9.93%) rose after negotiating a deal with the United Kingdom to provide 60 million doses of its coronavirus vaccine.
In geopolitical news, reports indicated that this weekend’s meeting between top U.S. and China trade officials was canceled due to scheduling issues. The two sides had planned to review terms of the “phase one” trade deal.
|
 Kenneth J. Gruneisen started out as a licensed stockbroker in August 1987, a couple of months prior to the historic stock market crash that took the Dow Jones Industrial Average down -22.6% in a single day. He has published daily fact-based fundamental and technical analysis on high-ranked stocks online for two decades. Through FACTBASEDINVESTING.COM, Kenneth provides educational articles, news, market commentary, and other information regarding proven investment systems that work in good times and bad.
Comments contained in the body of this report are technical opinions only and are not necessarily those of Gruneisen Growth Corp. The material herein has been obtained from sources believed to be reliable and accurate, however, its accuracy and completeness cannot be guaranteed. Our firm, employees, and customers may effect transactions, including transactions contrary to any recommendation herein, or have positions in the securities mentioned herein or options with respect thereto. Any recommendation contained in this report may not be suitable for all investors and it is not to be deemed an offer or solicitation on our part with respect to the purchase or sale of any securities. |
|
 |
Financial and Energy-Linked Groups Rose
Kenneth J. Gruneisen - Passed the CAN SLIM® Master's Exam
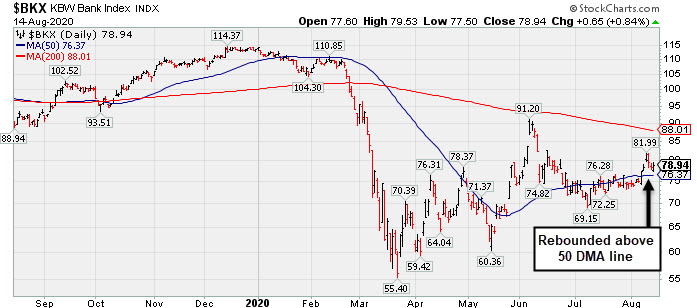
Financial stocks had a positive bias as the Broker/Dealer Index ($XBD +0.90%) and Bank Index ($BKX +0.83%) both posted gains, but the Retail Index ($RLX -0.17%) ended slightly in the red. The tech sector had a negative bias as the Networking Index ($NWX -0.89%) and Biotech Index ($BTK -0.91%) both slumped and the Semiconductor Index ($SOX -0.10%) also ended slightly in the red. Commodity-linked groups were mixed as the Oil Services Index ($OSX +0.56%) and Integrated Oil Index ($XOI +0.73%) each posted modest gains, meanwhile the Gold & Silver Index ($XAU -0.41%) edged lower.
PICTURED: The Bank Index ($BKX +0.83%) recently rebounded above its 50-day moving average (DMA) line helping its technical stance, but it still faces near-term resistance at its 200 DMA line and its June high.
| Oil Services |
$OSX |
39.59 |
+0.22 |
+0.56% |
-49.43% |
| Integrated Oil |
$XOI |
774.65 |
+5.62 |
+0.73% |
-39.03% |
| Semiconductor |
$SOX |
2,200.30 |
-2.11 |
-0.10% |
+18.96% |
| Networking |
$NWX |
602.53 |
-5.42 |
-0.89% |
+3.28% |
| Broker/Dealer |
$XBD |
295.32 |
+2.63 |
+0.90% |
+1.70% |
| Retail |
$RLX |
3,393.78 |
-5.65 |
-0.17% |
+38.56% |
| Gold & Silver |
$XAU |
145.96 |
-0.60 |
-0.41% |
+36.51% |
| Bank |
$BKX |
78.93 |
+0.65 |
+0.83% |
-30.37% |
| Biotech |
$BTK |
5,555.58 |
-51.17 |
-0.91% |
+9.63% |
|
|
|
 |
AMD Rose +46% Since First Featured on June 9th
Kenneth J. Gruneisen - Passed the CAN SLIM® Master's Exam
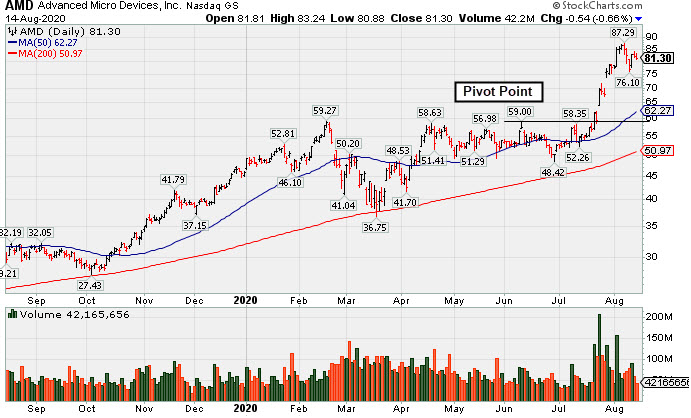
Advanced Micro Devices (AMD -$0.54 or -0.66% to $81.30) is consolidating near its all-time high, still very extended from the previously noted base. Its 50-day moving average (DMA) line ($62.27) and prior highs in the $59 area define important support to watch on pullbacks.
Bullish action came after it reported earnings +125% on +26% sales revenues for the Jun '20 quarter versus the year ago period. Volume and volatility often increase near earnings news. The 4 latest quarterly comparisons through Jun '20 showed very strong earnings increases well above the +25% minimum guideline (C criteria) with strong underlying sales revenues growth versus the year ago periods. Annual earnings growth (A criteria) has been very strong after losses in FY '15 and '16. it has a highest possible 99 Earnings Per Share Rating.
AMD hails from the Electronics - Semiconductor Fabless industry which has a Group Relative Strength Rating of 95 (L criteria). It has a large supply of 1.17 billion shares outstanding (S criteria), which makes it less likely to be a quick sprinter. However, the number of top-rated funds owning its shares rose from 1,669 in Jun '19 to 2,109 in Jun '20, a reassuring sign concerning the I criteria. Its current Up/Down Volume Ratio of 1.3 is an unbiased indication its shares have been under accumulation over the past 50 days. It has a Timeliness Rating of A, a Sponsorship Rating of B, and an Accumulation/Distribution rating of B+.
|
|
|
Color Codes Explained :
Y - Better candidates highlighted by our
staff of experts.
G - Previously featured
in past reports as yellow but may no longer be buyable under the
guidelines.
***Last / Change / Volume data in this table is the closing quote data***
Symbol/Exchange
Company Name
Industry Group |
PRICE |
CHANGE
(%Change) |
Day High |
Volume
(% DAV)
(% 50 day avg vol) |
52 Wk Hi
% From Hi |
Featured
Date |
Price
Featured |
Pivot Featured |
|
Max Buy |
 CRL
-
NYSE
CRL
-
NYSE
Charles River Labs Intl
DRUGS - Biotechnology
|
$214.49
|
-2.87
-1.32% |
$217.69
|
152,264
38.84% of 50 DAV
50 DAV is 392,000
|
$221.97
-3.37%
|
7/15/2020
|
$192.66
|
PP = $189.95
|
|
MB = $199.45
|
Most Recent Note - 8/12/2020 3:42:50 PM
G - Quickly rebounding near its all-time high with light volume behind today's big gain. Bullish action last week came after it reported Jun '20 quarterly earnings -3% on +4% sales revenues, below the +25% minimum guideline (C criteria) but better than expected while the company also raised its guidance. The prior high ($189.85 on 6/03/20) defines initial support to watch above its 50 DMA line ($189.40).
>>> FEATURED STOCK ARTICLE : Hit New Highs Again; EPS Rating Dropped Yet Remains High at 92 - 8/7/2020 |
View all notes |
Set NEW NOTE alert |
Company Profile |
SEC
News |
Chart |
Request a new note
C
A
S
I |
EBS
-
NYSE
Emergent Biosolutions
DRUGS - Biotechnology
|
$133.42
|
-1.52
-1.13% |
$136.02
|
791,908
75.42% of 50 DAV
50 DAV is 1,050,000
|
$137.61
-3.04%
|
7/7/2020
|
$89.47
|
PP = $93.68
|
|
MB = $98.36
|
Most Recent Note - 8/13/2020 7:57:34 PM
G - Rebounded near its all-time high with average volume behind today's big gain. Very extended from any sound base. Bullish action came after it reported Jun '20 quarterly earnings +890% on +62% sales revenue for the Jun '20 quarter versus the year ago period. Prior highs in the $93 area define initial support above its 50 DMA line ($92.41).
>>> FEATURED STOCK ARTICLE : Rally Continues Into Record High Territory - 8/4/2020 |
View all notes |
Set NEW NOTE alert |
Company Profile |
SEC
News |
Chart |
Request a new note
C
A
S
I |
BMRN
-
NASDAQ
Biomarin Pharmaceutical
DRUGS - Drug Manufacturers - Other
|
$118.16
|
+1.29
1.10% |
$119.98
|
971,484
73.88% of 50 DAV
50 DAV is 1,315,000
|
$131.95
-10.45%
|
6/17/2020
|
$110.95
|
PP = $112.67
|
|
MB = $118.30
|
Most Recent Note - 8/13/2020 7:44:44 PM
G - Still sputtering below its 50 DMA line ($120). A prompt rebound above the 50 DMA line is needed for its outlook to improve. Recently reported Jun '20 quarterly earnings +220% on +11% sales revenues versus the year ago period, continuing its strong earnings track record.
>>> FEATURED STOCK ARTICLE : Hovering Above 50-Day Average After Another Strong Earnings Report - 8/5/2020 |
View all notes |
Set NEW NOTE alert |
Company Profile |
SEC
News |
Chart |
Request a new note
C
A
S
I |
AMD
-
NASDAQ
Advanced Micro Devices
ELECTRONICS - Semiconductor - Broad Line
|
$81.30
|
-0.54
-0.66% |
$83.24
|
42,161,441
64.06% of 50 DAV
50 DAV is 65,818,000
|
$87.29
-6.86%
|
7/22/2020
|
$61.73
|
PP = $59.10
|
|
MB = $62.06
|
 Most Recent Note - 8/14/2020 5:26:27 PM
G - Volume totals have been cooling while perched near its all-time high, very extended from the previously noted base. The recent low ($76.10 on 8/11/20) defines near-term support above its 50 DMA line ($62.27). Fundamentals remain strong. See the latest FSU analysis for more details and a new annotated graph.
>>> FEATURED STOCK ARTICLE : AMD Rose +46% Since First Featured on June 9th - 8/14/2020 |
View all notes |
Set NEW NOTE alert |
Company Profile |
SEC
News |
Chart |
Request a new note
C
A
S
I |
TREX
-
NYSE
Trex Company Inc
MATERIALS and CONSTRUCTION - General Building Materials
|
$141.96
|
-1.26
-0.88% |
$143.34
|
393,688
43.74% of 50 DAV
50 DAV is 900,000
|
$144.96
-2.07%
|
6/26/2020
|
$109.05
|
PP = $132.94
|
|
MB = $139.59
|
Most Recent Note - 8/14/2020 5:35:17 PM
G - Color code is changed to green while perched near its all-time high and above its "max buy" level with volume totals cooling. Reported Jun '20 quarterly earnings +27% on +7% sales revenues versus the year ago period. Important near-term support is at its 50 DMA line ($129.76).
>>> FEATURED STOCK ARTICLE : Perched Near All Time High With Earnings News Due Monday - 7/30/2020 |
View all notes |
Set NEW NOTE alert |
Company Profile |
SEC
News |
Chart |
Request a new note
C
A
S
I |
Symbol/Exchange
Company Name
Industry Group |
PRICE |
CHANGE
(%Change) |
Day High |
Volume
(% DAV)
(% 50 day avg vol) |
52 Wk Hi
% From Hi |
Featured
Date |
Price
Featured |
Pivot Featured |
|
Max Buy |
NFLX
-
NASDAQ
Netflix Inc
SPECIALTY RETAIL - Music and Video Stores
|
$482.68
|
+1.35
0.28% |
$488.33
|
2,928,641
38.15% of 50 DAV
50 DAV is 7,677,000
|
$575.37
-16.11%
|
5/14/2020
|
$441.95
|
PP = $449.62
|
|
MB = $472.10
|
Most Recent Note - 8/14/2020 5:21:57 PM
G - Found prompt support this week after briefly undercutting both its 50 DMA line ($477) and prior low ($467.54). The rebound above the 50 DMA line helped its outlook improve, however, the volume behind recent gains has been very light. Fundamentals remain strong.
>>> FEATURED STOCK ARTICLE : Consolidating After Getting Extended From Prior Base - 7/29/2020 |
View all notes |
Set NEW NOTE alert |
Company Profile |
SEC
News |
Chart |
Request a new note
C
A
S
I |
CHGG
-
NYSE
Chegg Inc
Consumer Svcs-Education
|
$77.14
|
+0.28
0.36% |
$78.00
|
1,300,718
35.62% of 50 DAV
50 DAV is 3,652,000
|
$89.82
-14.12%
|
6/17/2020
|
$63.71
|
PP = $68.08
|
|
MB = $71.48
|
Most Recent Note - 8/13/2020 7:58:44 PM
G - Consolidating after getting very extended from any sound base. Reported Jun '20 quarterly earnings +61% on +63% sales revenues versus the year ago period. Its 50 DMA line ($70.73) defines support to watch above its prior high in the $68 area. Any losses leading to violations would raise concerns and trigger technical sell signals.
>>> FEATURED STOCK ARTICLE : Bullish Action Continued After Latest Strong Earnings Report - 8/6/2020 |
View all notes |
Set NEW NOTE alert |
Company Profile |
SEC
News |
Chart |
Request a new note
C
A
S
I |
LGIH
-
NASDAQ
L G I Homes Inc
Bldg-Resident/Comml
|
$108.94
|
-0.82
-0.75% |
$109.90
|
153,754
45.49% of 50 DAV
50 DAV is 338,000
|
$123.94
-12.10%
|
7/7/2020
|
$99.19
|
PP = $95.82
|
|
MB = $100.61
|
Most Recent Note - 8/13/2020 7:56:21 PM
G - Posted a big gain today with light volume. It is still extended from the previously noted base. Its 50 DMA line ($100.31) defines near-term support to watch above prior highs in the $95 area.
>>> FEATURED STOCK ARTICLE : Earning News Due Next Week for Homebuilder - 7/31/2020 |
View all notes |
Set NEW NOTE alert |
Company Profile |
SEC
News |
Chart |
Request a new note
C
A
S
I |
NOW
-
NYSE
Servicenow Inc
Computer Sftwr-Enterprse
|
$435.73
|
-2.69
-0.61% |
$442.89
|
1,225,369
71.33% of 50 DAV
50 DAV is 1,718,000
|
$454.70
-4.17%
|
4/30/2020
|
$343.05
|
PP = $363.05
|
|
MB = $381.20
|
Most Recent Note - 8/13/2020 7:42:23 PM
G - Consolidating above its 50 DMA line ($415.47) which defines important near-term support to watch. Subsequent losses leading to a violation may trigger a technical sell signal. Reported Jun '20 quarterly earnings +73% on +28% sales revenues versus the year ago period. See the latest FSU analysis for more details and a new annotated graph.
>>> FEATURED STOCK ARTICLE : Consolidating Above 50-Day Average After Another Strong Quarter - 8/13/2020 |
View all notes |
Set NEW NOTE alert |
Company Profile |
SEC
News |
Chart |
Request a new note
C
A
S
I |
TTD
-
NASDAQ
The Trade Desk Inc Cl A
Comml Svcs-Advertising
|
$465.60
|
-6.24
-1.32% |
$480.79
|
1,028,780
66.67% of 50 DAV
50 DAV is 1,543,000
|
$510.00
-8.71%
|
6/3/2020
|
$340.61
|
PP = $327.35
|
|
MB = $343.72
|
Most Recent Note - 8/12/2020 6:16:30 PM
G - Hovering near its all-time high. Recently reported Jun '20 quarterly earnings -3% on -13% sales revenues versus the year ago period, raising fundamental concerns. It is extended from any sound base of sufficient length. Its 50 DMA line ($421.28) and prior low ($404 on 7/24/20) define near-term support to watch where violations may trigger technical sell signals. See the latest FSU analysis for more details and a new annotated graph.
>>> FEATURED STOCK ARTICLE : Hovering Near High After Latest Quarterly Report Raised Concerns - 8/12/2020 |
View all notes |
Set NEW NOTE alert |
Company Profile |
SEC
News |
Chart |
Request a new note
C
A
S
I |
Symbol/Exchange
Company Name
Industry Group |
PRICE |
CHANGE
(%Change) |
Day High |
Volume
(% DAV)
(% 50 day avg vol) |
52 Wk Hi
% From Hi |
Featured
Date |
Price
Featured |
Pivot Featured |
|
Max Buy |
DOCU
-
NASDAQ
Docusign Inc
Computer Sftwr-Enterprse
|
$199.71
|
+0.33
0.17% |
$204.46
|
1,930,450
35.86% of 50 DAV
50 DAV is 5,383,000
|
$229.83
-13.11%
|
6/10/2020
|
$149.73
|
PP = $152.10
|
|
MB = $159.71
|
Most Recent Note - 8/13/2020 7:54:20 PM
G - Still very extended from any sound base. Its 50 DMA line ($185.66) defines near-term support to watch.
>>> FEATURED STOCK ARTICLE : E-Signature Firm is Extended From Any Sound Base - 7/28/2020 |
View all notes |
Set NEW NOTE alert |
Company Profile |
SEC
News |
Chart |
Request a new note
C
A
S
I |
PING
-
NYSE
Ping Identity Holdings Corp
Computer Sftwr-Security
|
$32.75
|
+0.40
1.24% |
$33.15
|
1,056,210
79.60% of 50 DAV
50 DAV is 1,326,900
|
$37.80
-13.36%
|
6/1/2020
|
$29.24
|
PP = $29.90
|
|
MB = $31.40
|
Most Recent Note - 8/13/2020 12:51:23 PM
G - Reported Jun '20 quarterly earnings -27% on -6% sales revenues versus the year ago period, below the +25% minimum earnings guideline, raising fundamental concerns. Undercut its 50 DMA line ($32.62) with today's 5th consecutive volume-driven loss. The next important near-term support is the prior highs in the $29 area. It has not formed a sound base of sufficient length. Completed Secondary Offerings on 7/09/20 and 5/15/20.
>>> FEATURED STOCK ARTICLE : Perched Near High With Earnings News Due Wednesday Evening - 8/10/2020 |
View all notes |
Set NEW NOTE alert |
Company Profile |
SEC
News |
Chart |
Request a new note
C
A
S
I |
|
|
|
THESE ARE NOT BUY RECOMMENDATIONS!
Comments contained in the body of this report are technical
opinions only. The material herein has been obtained
from sources believed to be reliable and accurate, however,
its accuracy and completeness cannot be guaranteed.
This site is not an investment advisor, hence it does
not endorse or recommend any securities or other investments.
Any recommendation contained in this report may not
be suitable for all investors and it is not to be deemed
an offer or solicitation on our part with respect to
the purchase or sale of any securities. All trademarks,
service marks and trade names appearing in this report
are the property of their respective owners, and are
likewise used for identification purposes only.
This report is a service available
only to active Paid Premium Members.
You may opt-out of receiving report notifications
at any time. Questions or comments may be submitted
by writing to Premium Membership Services 665 S.E. 10 Street, Suite 201 Deerfield Beach, FL 33441-5634 or by calling 1-800-965-8307
or 954-785-1121.
|
|
|