You are not logged in.
This means you
CAN ONLY VIEW reports that were published prior to Saturday, February 24, 2024.
You
MUST UPGRADE YOUR MEMBERSHIP if you want to see any current reports.
AFTER MARKET UPDATE - WEDNESDAY, AUGUST 14TH, 2019
Previous After Market Report Next After Market Report >>>
|
|
|
|
DOW |
-800.49 |
25,479.42 |
-3.05% |
|
Volume |
988,348,120 |
+15% |
|
Volume |
2,518,512,640 |
+8% |
|
NASDAQ |
-242.42 |
7,773.94 |
-3.02% |
|
Advancers |
473 |
16% |
|
Advancers |
530 |
17% |
|
S&P 500 |
-85.72 |
2,840.60 |
-2.93% |
|
Decliners |
2,408 |
84% |
|
Decliners |
2,573 |
83% |
|
Russell 2000 |
-43.05 |
1,467.52 |
-2.85% |
|
52 Wk Highs |
101 |
|
|
52 Wk Highs |
50 |
|
|
S&P 600 |
-27.14 |
902.75 |
-2.92% |
|
52 Wk Lows |
311 |
|
|
52 Wk Lows |
289 |
|
|
 |
Distributional Pressure Immediately Hurts New Rally
Kenneth J. Gruneisen - Passed the CAN SLIM® Master's Exam
The Dow slid 800 points, while the S&P 500 lost 2.9%. The Nasdaq Composite fell 3.0%. Volume totals reported were higher than the prior session totals on the NYSE and on the Nasdaq exchange, indicative of more worrisome distributional pressure. Breadth was negative as decliners led advancers by a 5-1 margin on the NYSE and nearly 5-1 on the Nasdaq exchange. There were 8 high-ranked companies from the Leaders List hit new 52-week highs and were listed on the BreakOuts Page, versus the total of 39 on the prior session. New 52-week lows totals expanded and easily outnumbered new 52-week highs on the NYSE and on the Nasdaq exchange. The Featured Stocks Page provides the most timely analysis on high-ranked leaders.Charts used courtesy of www.stockcharts.com
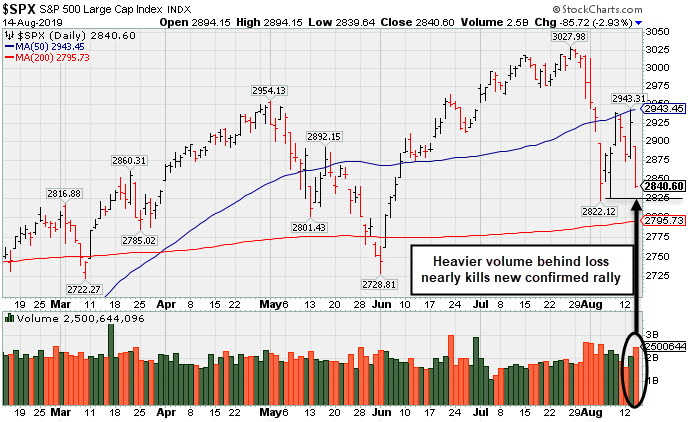
PICTURED: The S&P 500 Index suffered a big loss on heavier volume, slumping toward the recent low, which immediately pressured the new rally. A follow-through day on the prior session marked a bullish shift concerning the M criteria of the fact-based investment system, giving investors a green light to make carefully selected new buying efforts. Damaging losses below the prior low may kill the rally.
Stocks finished firmly lower Wednesday, as investor sentiment was pressured by an inversion of a closely watched part of the Treasury yield curve and downbeat global economic updates. The sell-off continued the recent trend of heightened market volatility, as the S&P 500 has now experienced an intraday move of at least 1% in eleven-straight sessions.
Perceived safe haven assets surged after Chinese industrial output fell to the lowest in 17 years and German GDP data showed the economy unexpectedly contracted during the second quarter. The news briefly sent the spread between two- and 10-year Treasury note yields into negative territory for the first time since 2007, raising investor concern as the inversion of this part of the curve has historically been a precursor to recessionary periods. The yield on the 10-year note slumped 11 basis points to 1.58%, while the yield on the two-year note slid eight basis points to 1.58%. The perceived “risk off” mentality pushed the yield on 30-year bonds to a record low of 2.01%, while COMEX gold climbed 0.9% to a six-year high of $1,515.90/ounce.
All 11 S&P 500 sectors finished in negative territory, with eight groups losing more than 2%. Energy stocks paced the declines following a retreat in oil prices. WTI crude dropped 3.5% to $55.08/barrel as concerns that a global economic slowdown would dim demand prospects. Banks weighed on Financials amid the yield curve inversion, with the sector falling 3.6%. In earnings, Macy’s (M -13.22%) slumped after missing analyst profit expectations and lowering its full-year guidance.
|
 Kenneth J. Gruneisen started out as a licensed stockbroker in August 1987, a couple of months prior to the historic stock market crash that took the Dow Jones Industrial Average down -22.6% in a single day. He has published daily fact-based fundamental and technical analysis on high-ranked stocks online for two decades. Through FACTBASEDINVESTING.COM, Kenneth provides educational articles, news, market commentary, and other information regarding proven investment systems that work in good times and bad.
Comments contained in the body of this report are technical opinions only and are not necessarily those of Gruneisen Growth Corp. The material herein has been obtained from sources believed to be reliable and accurate, however, its accuracy and completeness cannot be guaranteed. Our firm, employees, and customers may effect transactions, including transactions contrary to any recommendation herein, or have positions in the securities mentioned herein or options with respect thereto. Any recommendation contained in this report may not be suitable for all investors and it is not to be deemed an offer or solicitation on our part with respect to the purchase or sale of any securities. |
|
 |
Retail, Financial, Tech, and Energy-Linked Groups Fell
Kenneth J. Gruneisen - Passed the CAN SLIM® Master's Exam
The Retail Index ($RLX -3.34%), Broker/Dealer Index ($XBD -2.93%), and the Bank Index ($BKX -3.95%) each suffered a big loss. The tech sector also had a negative bias as the Semiconductor Index ($SOX -3.16%) and Networking Index ($NWX -3.07%) both outpaced the Biotech Index ($BTK -2.16%) to the downside. The Integrated Oil Index ($XOI -3.53%) and the Oil Services Index ($OSX -6.18%) both suffered large losses. The Gold & Silver Index ($XAU -0.39%) only edged slightly lower, making it a standout on the otherwise solidly negative session.
Charts courtesy of www.stockcharts.com
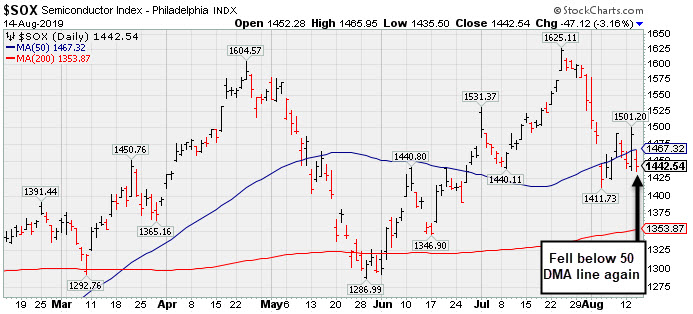
PICTURED: The Semiconductor Index ($SOX -3.16%) slumped below its 50-day moving average (DMA) line again.
| Oil Services |
$OSX |
61.19 |
-4.03 |
-6.18% |
-24.08% |
| Integrated Oil |
$XOI |
1,147.90 |
-42.04 |
-3.53% |
-0.97% |
| Semiconductor |
$SOX |
1,442.54 |
-47.12 |
-3.16% |
+24.88% |
| Networking |
$NWX |
550.76 |
-17.43 |
-3.07% |
+12.71% |
| Broker/Dealer |
$XBD |
243.27 |
-7.34 |
-2.93% |
+2.50% |
| Retail |
$RLX |
2,234.20 |
-77.14 |
-3.34% |
+14.49% |
| Gold & Silver |
$XAU |
92.91 |
-0.36 |
-0.39% |
+31.49% |
| Bank |
$BKX |
89.65 |
-3.69 |
-3.95% |
+4.50% |
| Biotech |
$BTK |
4,470.92 |
-98.59 |
-2.16% |
+5.92% |
|
|
|
 |
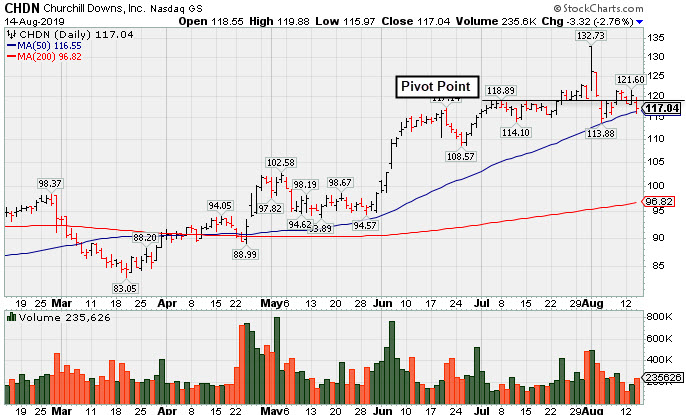
Recently Found Support at 50-Day Moving Average
Kenneth J. Gruneisen - Passed the CAN SLIM® Master's Exam
Churchill Downs Inc (CHDN -$3.32 or -2.76% to $117.04) has been consolidating near its 50-day moving average (DMA) line ($116.55). More damaging losses below that important short-term average or undercutting the recent low ($113.88 on 8/05/19) would raise greater concerns and trigger technical sell signals.
Recently it reported Jun '19 earnings +10% on +26% sales revenues versus the year ago period, below the +25% minimum earnings guideline (C criteria). That broke a streak of 6 consecutive quarters well above the +25% minimum earnings guideline (C criteria) versus the year ago periods. It still has an earnings Per Share Rating of 95.
It was highlighted in yellow in the 6/05/19 mid-day report (read here). It was last shown in this FSU section on 7/16/19 with an annotated graph under the headline, "Volume Light While Hovering at Record High". Annual earnings (A criteria) growth has been strong since a downturn in FY '14.
The number of top-rated funds owning its shares rose from 333 in Jun '17 to 436 in Jun '18, a reassuring sign concerning the I criteria. It has a small supply of 35.2 million shares (S criteria) outstanding following a 3:1 split effective 1/28/19, and this small supply can contribute to greater price volatility in the event of institutional buying or selling.
The L criteria of the fact-based investment system guides investors toward buying leading stocks that are in leading industry groups. The Leisure - Gaming/Equipment industry group has a Group Relative Strength Rating of D+. |
|
|
Color Codes Explained :
Y - Better candidates highlighted by our
staff of experts.
G - Previously featured
in past reports as yellow but may no longer be buyable under the
guidelines.
***Last / Change / Volume data in this table is the closing quote data***
Symbol/Exchange
Company Name
Industry Group |
PRICE |
CHANGE
(%Change) |
Day High |
Volume
(% DAV)
(% 50 day avg vol) |
52 Wk Hi
% From Hi |
Featured
Date |
Price
Featured |
Pivot Featured |
|
Max Buy |
 SPSC
-
NASDAQ
SPSC
-
NASDAQ
S P S Commerce Inc
COMPUTER SOFTWARE and SERVICES - Application Software
|
$102.78
|
-3.84
-3.60% |
$106.32
|
109,654
86.34% of 50 DAV
50 DAV is 127,000
|
$118.28
-13.10%
|
6/7/2019
|
$107.72
|
PP = $115.10
|
|
MB = $120.86
|
Most Recent Note - 8/13/2019 6:36:10 PM
Y - Finding support recently at its 50 DMA line ($105.43). Stalled after a gap up and big volume-driven gain noted on 7/26/19. Subsequent gains and a strong close above the pivot point may clinch a convincing new (or add-on) technical buy signal. Reported earnings +22% on +12% sales revenues for the Jun '19 quarter, slightly under the +25% minimum earnings guideline (C criteria), raising fundamental concerns.
>>> FEATURED STOCK ARTICLE : Found Support at 50-Day Average - 8/8/2019 |
View all notes |
Set NEW NOTE alert |
Company Profile |
SEC
News |
Chart |
Request a new note
C
A
S
I |
EPAM
-
NYSE
Epam Systems Inc
COMPUTER SOFTWARE and SERVICES - Information Technology Service
|
$182.34
|
-7.27
-3.83% |
$186.74
|
338,378
79.43% of 50 DAV
50 DAV is 426,000
|
$201.00
-9.28%
|
5/9/2019
|
$169.25
|
PP = $180.55
|
|
MB = $189.58
|
 Most Recent Note - 8/14/2019 5:55:01 PM
G - Quietly slumped to a close below its 50 DMA line hurting its outlook and its color code is changed to green. Reported earnings +27% on +24% sales revenues for the Jun '19 quarter. See the latest FSU analysis for more details and an annotated graph.
>>> FEATURED STOCK ARTICLE : Rebounded Above 50-Day Average Following Earnings Report - 8/12/2019 |
View all notes |
Set NEW NOTE alert |
Company Profile |
SEC
News |
Chart |
Request a new note
C
A
S
I |
AUDC
-
NASDAQ
Audiocodes Ltd
ELECTRONICS - Scientific and Technical Instrum
|
$17.39
|
-0.93
-5.08% |
$17.91
|
235,326
135.24% of 50 DAV
50 DAV is 174,000
|
$19.74
-11.90%
|
7/15/2019
|
$17.10
|
PP = $17.54
|
|
MB = $18.42
|
Most Recent Note - 8/14/2019 12:09:28 PM
Y - Pulling back with higher volume today while testing prior highs in the $17 area and its 50 DMA line ($16.67) noted as important support. Reported earnings +57% on +14% sales revenues for the Jun '19 quarter, continuing its strong earnings track record. See the latest FSU analysis for more details and an annotated graph.
>>> FEATURED STOCK ARTICLE : Volume Totals Cooling as Bullish Action Continues - 8/13/2019 |
View all notes |
Set NEW NOTE alert |
Company Profile |
SEC
News |
Chart |
Request a new note
C
A
S
I |
LHCG
-
NASDAQ
L H C Group Inc
HEALTH SERVICES - Home Health Care
|
$120.82
|
+0.03
0.02% |
$121.24
|
203,423
91.63% of 50 DAV
50 DAV is 222,000
|
$129.37
-6.61%
|
7/1/2019
|
$110.94
|
PP = $122.20
|
|
MB = $128.31
|
Most Recent Note - 8/12/2019 8:18:42 PM
G - Color code is changed to green after slumping below its 50 DMA line ($120) today raising concerns. Reported earnings +27% on +3% sales revenues for the Jun '19 quarter. Prior quarterly comparisons showed much stronger sales revenues growth. Recent gains above its pivot point were not backed by the +40% above average volume needed to trigger a proper new (or add-on) technical buy signal.
>>> FEATURED STOCK ARTICLE : Consolidating Following a Negative Reversal at High - 7/22/2019 |
View all notes |
Set NEW NOTE alert |
Company Profile |
SEC
News |
Chart |
Request a new note
C
A
S
I |
CHDN
-
NASDAQ
Churchill Downs Inc
LEISURE - Gaming Activities
|
$117.04
|
-3.32
-2.76% |
$119.88
|
235,626
89.25% of 50 DAV
50 DAV is 264,000
|
$132.73
-11.82%
|
7/22/2019
|
$118.45
|
PP = $118.89
|
|
MB = $124.83
|
Most Recent Note - 8/14/2019 5:50:05 PM
Y - Found support recently above its 50 DMA line ($116.55). Reported Jun '19 earnings rose +10% on +26% sales revenues versus the year ago period, below the +25% minimum earnings guideline (C criteria). The prior low ($113.88 on 8/05/19) defines the next important near-term support to watch below its 50 DMA line. See the latest FSU analysis for more details and a new annotated graph.
>>> FEATURED STOCK ARTICLE : Recently Found Support at 50-Day Moving Average - 8/14/2019 |
View all notes |
Set NEW NOTE alert |
Company Profile |
SEC
News |
Chart |
Request a new note
C
A
S
I |
Symbol/Exchange
Company Name
Industry Group |
PRICE |
CHANGE
(%Change) |
Day High |
Volume
(% DAV)
(% 50 day avg vol) |
52 Wk Hi
% From Hi |
Featured
Date |
Price
Featured |
Pivot Featured |
|
Max Buy |
LULU
-
NASDAQ
Lululemon Athletica
MANUFACTURING - Textile Manufacturing
|
$174.68
|
-4.91
-2.73% |
$176.86
|
1,764,861
86.98% of 50 DAV
50 DAV is 2,029,000
|
$194.25
-10.07%
|
6/13/2019
|
$174.48
|
PP = $179.60
|
|
MB = $188.58
|
Most Recent Note - 8/13/2019 6:34:42 PM
G - Color code is changed to green while sputtering below its 50 DMA line ($182.65). A rebound above the 50 DMA line is needed to help its technical stance improve. Reported Apr '19 quarterly earnings +35% on +20% sales revenues versus the year ago period.
>>> FEATURED STOCK ARTICLE : Quietly Hovering at All-Time High - 7/17/2019 |
View all notes |
Set NEW NOTE alert |
Company Profile |
SEC
News |
Chart |
Request a new note
C
A
S
I |
ULTA
-
NASDAQ
Ulta Beauty Inc
SPECIALTY RETAIL - Specialty Retail, Other
|
$321.00
|
-20.20
-5.92% |
$332.20
|
1,244,181
187.38% of 50 DAV
50 DAV is 664,000
|
$368.83
-12.97%
|
3/15/2019
|
$341.27
|
PP = $322.59
|
|
MB = $338.72
|
Most Recent Note - 8/14/2019 12:32:11 PM
G - Sputtering toward its 200 DMA line ($317) with technical weakness raising concerns. A rebound above its 50 DMA line ($347.60) is needed for its outlook to improve. Reported earnings +17% on +13% sales revenues for the Apr '19 quarter, below the +25% minimum earnings guideline (C criteria), raising fundamental concerns.
>>> FEATURED STOCK ARTICLE : Ulta Beauty Sputtering Below 50-Day Moving Average - 8/7/2019 |
View all notes |
Set NEW NOTE alert |
Company Profile |
SEC
News |
Chart |
Request a new note
C
A
S
I |
CHGG
-
NYSE
Chegg Inc
Consumer Svcs-Education
|
$39.60
|
-2.12
-5.08% |
$41.01
|
1,948,074
128.33% of 50 DAV
50 DAV is 1,518,000
|
$48.22
-17.88%
|
7/8/2019
|
$44.11
|
PP = $41.79
|
|
MB = $43.88
|
Most Recent Note - 8/14/2019 5:53:24 PM
G - Color code is changed to green after a more damaging loss raised concerns and triggered a technical sell signal. Slumped below prior highs in the $40-41 area and below its 50 DMA line ($41.53). A prompt rebound above the 50 DMA line is needed for its outlook to improve. Reported earnings +92% on +26% sales revenues for the Jun '19 quarter.
>>> FEATURED STOCK ARTICLE : Consolidating Above Prior Highs and 50-Day Average - 8/6/2019 |
View all notes |
Set NEW NOTE alert |
Company Profile |
SEC
News |
Chart |
Request a new note
C
A
S
I |
VEEV
-
NYSE
Veeva Systems Inc Cl A
Computer Sftwr-Medical
|
$156.87
|
-5.47
-3.37% |
$160.68
|
924,122
63.78% of 50 DAV
50 DAV is 1,449,000
|
$176.90
-11.32%
|
5/30/2019
|
$154.32
|
PP = $145.80
|
|
MB = $153.09
|
Most Recent Note - 8/12/2019 8:25:07 PM
G - Still sputtering below its 50 DMA line ($165.25) which acted as resistance after volume-driven losses. A rebounded above the 50 DMA line is needed for its outlook to improve. Fundamentals remain strong.
>>> FEATURED STOCK ARTICLE : Recently Found Support Near 50-Day Moving Average - 8/1/2019 |
View all notes |
Set NEW NOTE alert |
Company Profile |
SEC
News |
Chart |
Request a new note
C
A
S
I |
PAYC
-
NYSE
Paycom Software Inc
COMPUTER SOFTWARE and SERVICES - Application Software
|
$232.30
|
-11.28
-4.63% |
$240.82
|
532,533
81.68% of 50 DAV
50 DAV is 652,000
|
$246.85
-5.89%
|
2/6/2019
|
$171.66
|
PP = $164.18
|
|
MB = $172.39
|
Most Recent Note - 8/14/2019 5:57:58 PM
G - Fell near its 50 DMA line ($230.89) today while still building on a new flat base. Reported earnings +27% on +31% sales revenues for the Jun '19 quarter, continuing its strong earnings track record.
>>> FEATURED STOCK ARTICLE : Found Support and Gapped Up Following Earnings Report - 8/2/2019 |
View all notes |
Set NEW NOTE alert |
Company Profile |
SEC
News |
Chart |
Request a new note
C
A
S
I |
Symbol/Exchange
Company Name
Industry Group |
PRICE |
CHANGE
(%Change) |
Day High |
Volume
(% DAV)
(% 50 day avg vol) |
52 Wk Hi
% From Hi |
Featured
Date |
Price
Featured |
Pivot Featured |
|
Max Buy |
PLNT
-
NYSE
Planet Fitness Inc Cl A
Leisure-Services
|
$69.33
|
-3.30
-4.54% |
$72.23
|
1,391,788
88.93% of 50 DAV
50 DAV is 1,565,000
|
$81.90
-15.35%
|
7/26/2019
|
$79.15
|
PP = $82.00
|
|
MB = $86.10
|
Most Recent Note - 8/14/2019 6:03:30 PM
It will be dropped from the Featured Stocks list tonight after sinking further below its 50 DMA line ($76.34). A rebound above the 50 DMA line is needed for its outlook to improve. Reported earnings +32% on +29% sales revenues for the Jun '19 quarter continuing its strong earnings track record.
>>> FEATURED STOCK ARTICLE : Fitness Firm Forming a New Base - 7/26/2019 |
View all notes |
Set NEW NOTE alert |
Company Profile |
SEC
News |
Chart |
Request a new note
C
A
S
I |
BLD
-
NYSE
Topbuild Corp
Bldg-Constr Prds/Misc
|
$89.39
|
-2.30
-2.51% |
$90.97
|
170,337
53.40% of 50 DAV
50 DAV is 319,000
|
$92.07
-2.91%
|
5/17/2019
|
$82.19
|
PP = $87.31
|
|
MB = $91.68
|
Most Recent Note - 8/13/2019 6:26:03 PM
G - Posted a gain with light volume today for a best-ever close and its color code is changed to green. Bullish action came after it reported earnings +39% on +9% sales revenues for the Jun '19 quarter versus the year ago period, continuing its strong earnings track record. Its 50 DMA line ($82.36) and recent lows define near-term support to watch on pullbacks.
>>> FEATURED STOCK ARTICLE : Perched Near 52-Week High Finding Support - 7/25/2019 |
View all notes |
Set NEW NOTE alert |
Company Profile |
SEC
News |
Chart |
Request a new note
C
A
S
I |
TEAM
-
NASDAQ
Atlassian Corp Plc Cl A
Comp Sftwr-Spec Enterprs
|
$139.49
|
-7.21
-4.91% |
$144.91
|
1,126,314
87.24% of 50 DAV
50 DAV is 1,291,000
|
$149.80
-6.88%
|
5/24/2019
|
$129.52
|
PP = $132.09
|
|
MB = $138.69
|
Most Recent Note - 8/14/2019 5:59:55 PM
G - Pulled back toward support at its 50 DMA line ($135.56). Its prior low ($130.78 on 7/23/19) defines the next important near-term support to watch where a violation would raise serious concerns and trigger a more worrisome technical sell signal. Reported earnings +43% on +36% sales revenues for the Jun '19 quarter, continuing its strong earnings track record.
>>> FEATURED STOCK ARTICLE : Abrupt Retreat After Getting Very Extended From Prior Base - 7/29/2019 |
View all notes |
Set NEW NOTE alert |
Company Profile |
SEC
News |
Chart |
Request a new note
C
A
S
I |
GLOB
-
NYSE
Globant SA
Computer-Tech Services
|
$100.63
|
-4.78
-4.53% |
$103.73
|
208,381
66.15% of 50 DAV
50 DAV is 315,000
|
$112.33
-10.42%
|
2/15/2019
|
$69.35
|
PP = $70.00
|
|
MB = $73.50
|
Most Recent Note - 8/14/2019 5:56:48 PM
G - Big loss on light volume today violated its 50 DMA line ($103.55) raising concerns. It has not formed a sound new base of sufficient length. Due to report earnings news on 8/15/19. Volume and volatility often increase near earnings news.
>>> FEATURED STOCK ARTICLE : Consolidating Above 50-Day Average With Earnings News Soon - 8/9/2019 |
View all notes |
Set NEW NOTE alert |
Company Profile |
SEC
News |
Chart |
Request a new note
C
A
S
I |
TTD
-
NASDAQ
The Trade Desk Inc Cl A
Comml Svcs-Advertising
|
$250.39
|
-14.25
-5.38% |
$259.00
|
1,689,592
109.50% of 50 DAV
50 DAV is 1,543,000
|
$289.51
-13.51%
|
7/18/2019
|
$240.61
|
PP = $258.10
|
|
MB = $271.01
|
Most Recent Note - 8/14/2019 6:01:03 PM
Y - Testing its 50 DMA line ($247) which defines important support. Reported Jun '19 quarterly earnings +58% on +42% sales revenues.
>>> FEATURED STOCK ARTICLE : Endured Distributional Pressure While Building on New Base - 7/18/2019 |
View all notes |
Set NEW NOTE alert |
Company Profile |
SEC
News |
Chart |
Request a new note
C
A
S
I |
Symbol/Exchange
Company Name
Industry Group |
PRICE |
CHANGE
(%Change) |
Day High |
Volume
(% DAV)
(% 50 day avg vol) |
52 Wk Hi
% From Hi |
Featured
Date |
Price
Featured |
Pivot Featured |
|
Max Buy |
PAGS
-
NYSE
Pagseguro Digital Cl A
Finance-CrdtCard/PmtPr
|
$45.80
|
-1.00
-2.14% |
$46.35
|
1,277,763
57.20% of 50 DAV
50 DAV is 2,234,000
|
$48.88
-6.30%
|
6/25/2019
|
$37.69
|
PP = $40.07
|
|
MB = $42.07
|
Most Recent Note - 8/13/2019 12:46:12 PM
G - Posting a solid gain today with light volume. Earnings news is due on 8/15/19. Prior high in the $40 area defines initial support to watch along with its 50 DMA line ($41.32).
>>> FEATURED STOCK ARTICLE : Encountering Distributional Pressure After Impressive Sprint - 7/30/2019 |
View all notes |
Set NEW NOTE alert |
Company Profile |
SEC
News |
Chart |
Request a new note
C
A
S
I |
|
|
|
THESE ARE NOT BUY RECOMMENDATIONS!
Comments contained in the body of this report are technical
opinions only. The material herein has been obtained
from sources believed to be reliable and accurate, however,
its accuracy and completeness cannot be guaranteed.
This site is not an investment advisor, hence it does
not endorse or recommend any securities or other investments.
Any recommendation contained in this report may not
be suitable for all investors and it is not to be deemed
an offer or solicitation on our part with respect to
the purchase or sale of any securities. All trademarks,
service marks and trade names appearing in this report
are the property of their respective owners, and are
likewise used for identification purposes only.
This report is a service available
only to active Paid Premium Members.
You may opt-out of receiving report notifications
at any time. Questions or comments may be submitted
by writing to Premium Membership Services 665 S.E. 10 Street, Suite 201 Deerfield Beach, FL 33441-5634 or by calling 1-800-965-8307
or 954-785-1121.
|
|
|