You are not logged in.
This means you
CAN ONLY VIEW reports that were published prior to Sunday, February 25, 2024.
You
MUST UPGRADE YOUR MEMBERSHIP if you want to see any current reports.
AFTER MARKET UPDATE - THURSDAY, AUGUST 13TH, 2020
Previous After Market Report Next After Market Report >>>
|
|
|
|
DOW |
-80.12 |
27,896.72 |
-0.29% |
|
Volume |
717,918,602 |
-7% |
|
Volume |
3,448,560,500 |
-7% |
|
NASDAQ |
+30.26 |
11,042.50 |
+0.27% |
|
Advancers |
1,204 |
41% |
|
Advancers |
1,460 |
45% |
|
S&P 500 |
-6.92 |
3,373.43 |
-0.20% |
|
Decliners |
1,736 |
59% |
|
Decliners |
1,788 |
55% |
|
Russell 2000 |
-3.46 |
1,579.79 |
-0.22% |
|
52 Wk Highs |
59 |
|
|
52 Wk Highs |
103 |
|
|
S&P 600 |
-6.60 |
917.57 |
-0.71% |
|
52 Wk Lows |
3 |
|
|
52 Wk Lows |
19 |
|
|
 |
Indices Were Mixed and Little Changed but Leadership Thinned
Kenneth J. Gruneisen - Passed the CAN SLIM® Master's Exam
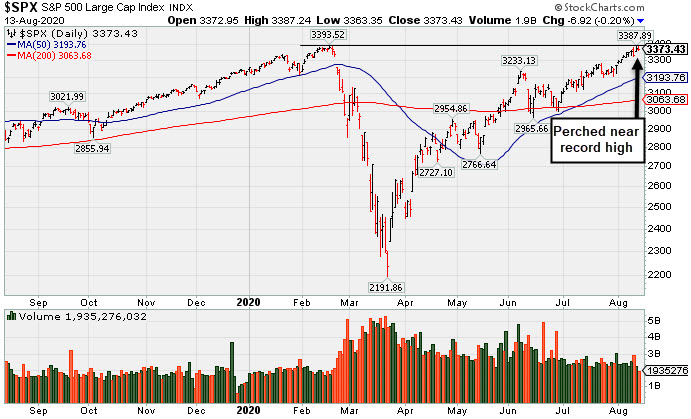
The Dow lost 80 points, while the S&P 500 slipped 0.2%, but still remains within 0.4% of its record high. The Nasdaq Composite bucked the downtrend, rising 0.3%. The reported volume totals were lighter than the prior session on the NYSE and on the Nasdaq exchange. Decliners led advancers by almost a 3-2 margin on the NYSE and by a 6-5 margin on the Nasdaq exchange. There were 42 high-ranked companies from the Leaders List that hit new 52-week highs and were listed on the BreakOuts Page, versus the total of 50 on the prior session. New 52-week highs totals contracted yet still outnumbered new 52-week lows totals again on both the NYSE and the Nasdaq exchange. The major indices are in a confirmed uptrend (M criteria). Any sustainable rally requires a healthy crop of new leaders, so it remains ever-important to see substantial new highs totals. Charts used courtesy of www.stockcharts.com
PICTURED: The S&P 500 Index is perched near its record high. Equities finished mixed on Thursday, as an impasse in fiscal stimulus negotiations weighed on a better-than-anticipated update on the U.S. labor market. Lawmakers in Washington remain at a stalemate over a fifth coronavirus-relief package, with supplementary funding for the U.S. Postal Service being the latest point of contention.
On the data front, initial jobless claims fell more than projected to 963,000 from an upwardly revised 1.19 million in the week ending August 8th. The figure also unexpectedly fell below 1 million for the first since the pandemic began in March. Treasuries declined for a fifth straight session, sending yields to eight-week highs following weak demand for a record-sized 30-year bond auction. The yield on the 10-year note added five basis points to 0.71%, while the 30-year bond rate jumped six basis points to 1.42%.
Nine of 11 S&P 500 sectors finished in negative territory. The Energy group led laggards, with WTI crude falling 0.7% to $42.36/barrel after the International Energy Agency downgraded global oil demand expectations. In earnings, Cisco Systems (CSCO -11.19%) fell after reporting a decline in revenue year-over-year and providing disappointing forward guidance. Lyft (LYFT -5.37%) fell after reporting a 50% decline in July rides. In other corporate news, AMC Entertainment (AMC +14.4%) after revealing plans to begin its phased reopening of its U.S. theaters on August 20th. Elsewhere, Apple (AAPL +1.77%) rose amid news the company plans to bundle its digital services at a discounted monthly price.
|
 Kenneth J. Gruneisen started out as a licensed stockbroker in August 1987, a couple of months prior to the historic stock market crash that took the Dow Jones Industrial Average down -22.6% in a single day. He has published daily fact-based fundamental and technical analysis on high-ranked stocks online for two decades. Through FACTBASEDINVESTING.COM, Kenneth provides educational articles, news, market commentary, and other information regarding proven investment systems that work in good times and bad.
Comments contained in the body of this report are technical opinions only and are not necessarily those of Gruneisen Growth Corp. The material herein has been obtained from sources believed to be reliable and accurate, however, its accuracy and completeness cannot be guaranteed. Our firm, employees, and customers may effect transactions, including transactions contrary to any recommendation herein, or have positions in the securities mentioned herein or options with respect thereto. Any recommendation contained in this report may not be suitable for all investors and it is not to be deemed an offer or solicitation on our part with respect to the purchase or sale of any securities. |
|
 |
Gold & Silver Index Rose; Financial, Tech and Energy Groups Fell
Kenneth J. Gruneisen - Passed the CAN SLIM® Master's Exam
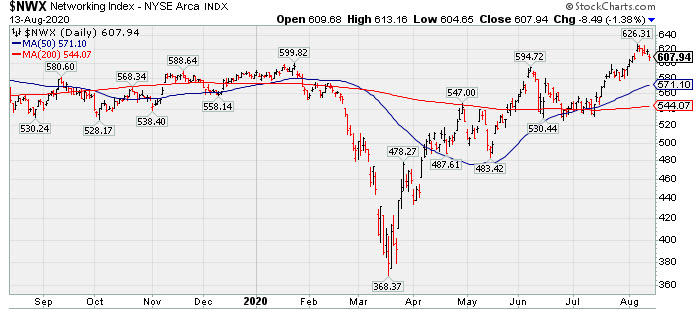
The Bank Index ($BKX -1.61%) and Broker/Dealer Index ($XBD -0.73%) both lost ground while the Retail Index ($RLX -0.14%) did a better job of holding its ground. The Semiconductor Index ($SOX -1.11%) and Networking Index ($NWX -1.38%) both lost ground while the Biotech Index ($BTK +0.04%) finished flat. Commodity-linked groups were mixed as the Gold & Silver Index ($XAU +3.44%) posted a standout gain while the Oil Services Index ($OSX -2.53%) and Integrated Oil Index ($XOI -2.09%) both fell.PICTURED: The Networking Index ($NWX -1.38%) is perched near its 2020 high.
| Oil Services |
$OSX |
39.37 |
-1.02 |
-2.53% |
-49.71% |
| Integrated Oil |
$XOI |
769.04 |
-16.45 |
-2.09% |
-39.47% |
| Semiconductor |
$SOX |
2,202.41 |
-24.81 |
-1.11% |
+19.07% |
| Networking |
$NWX |
607.94 |
-8.49 |
-1.38% |
+4.21% |
| Broker/Dealer |
$XBD |
292.70 |
-2.14 |
-0.73% |
+0.80% |
| Retail |
$RLX |
3,399.43 |
-4.91 |
-0.14% |
+38.79% |
| Gold & Silver |
$XAU |
146.56 |
+4.88 |
+3.44% |
+37.07% |
| Bank |
$BKX |
78.28 |
-1.28 |
-1.61% |
-30.95% |
| Biotech |
$BTK |
5,606.76 |
+2.46 |
+0.04% |
+10.64% |
|
|
|
 |
Consolidating Above 50-Day Average After Another Strong Quarter
Kenneth J. Gruneisen - Passed the CAN SLIM® Master's Exam
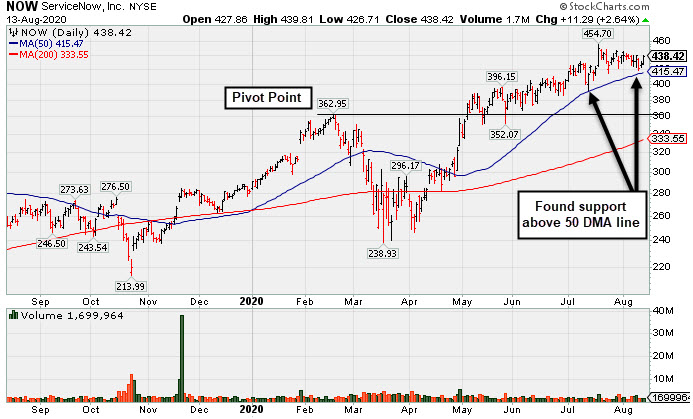
ServiceNow Inc (NOW +$11.29 or +2.64% to $438.42) is consolidating above its 50-day moving average (DMA) line ($413.78) which defines important near-term support to watch. Subsequent losses leading to a violation may trigger a technical sell signal.
Recently it reported Jun '20 quarterly earnings +73% on +28% sales revenues versus the year ago period. Results have been routinely above the +25% minimum earnings guideline (C criteria). It has an Earnings Per Share Rating of 99. The Computer Software - Enterprise group has a Group Relative Strength Rating of 96, a reassuring sign concerning the L criteria. NOW has a new CEO as of 1/01/20.
NOW is up +28.7% from when it was highlighted in yellow in the 4/30/20 mid-day report with a pivot point based on its 2/19/20 high plus 10 cents (read here). It was last shown in this FSU section on 7/22/20 with an annotated graph under the headline, "Perched Near All-Time High With Earnings News Due Next Week". The number of top-rated funds owning its shares rose from 1,030 in Jun '17 to 2.244 in Jun '20, a reassuring sign concerning the I criteria. It has a Timeliness Rating of A and a Sponsorship Rating of A. Its current Up/Down Volume Ratio of 1.3 is an unbiased indication its shares have been under accumulation over the past 50 days. |
|
|
Color Codes Explained :
Y - Better candidates highlighted by our
staff of experts.
G - Previously featured
in past reports as yellow but may no longer be buyable under the
guidelines.
***Last / Change / Volume data in this table is the closing quote data***
Symbol/Exchange
Company Name
Industry Group |
PRICE |
CHANGE
(%Change) |
Day High |
Volume
(% DAV)
(% 50 day avg vol) |
52 Wk Hi
% From Hi |
Featured
Date |
Price
Featured |
Pivot Featured |
|
Max Buy |
 CRL
-
NYSE
CRL
-
NYSE
Charles River Labs Intl
DRUGS - Biotechnology
|
$217.36
|
-2.29
-1.04% |
$219.91
|
258,518
64.31% of 50 DAV
50 DAV is 402,000
|
$221.97
-2.08%
|
7/15/2020
|
$192.66
|
PP = $189.95
|
|
MB = $199.45
|
Most Recent Note - 8/12/2020 3:42:50 PM
G - Quickly rebounding near its all-time high with light volume behind today's big gain. Bullish action last week came after it reported Jun '20 quarterly earnings -3% on +4% sales revenues, below the +25% minimum guideline (C criteria) but better than expected while the company also raised its guidance. The prior high ($189.85 on 6/03/20) defines initial support to watch above its 50 DMA line ($189.40).
>>> FEATURED STOCK ARTICLE : Hit New Highs Again; EPS Rating Dropped Yet Remains High at 92 - 8/7/2020 |
View all notes |
Set NEW NOTE alert |
Company Profile |
SEC
News |
Chart |
Request a new note
C
A
S
I |
EBS
-
NYSE
Emergent Biosolutions
DRUGS - Biotechnology
|
$134.94
|
+5.37
4.14% |
$135.98
|
1,080,892
104.03% of 50 DAV
50 DAV is 1,039,000
|
$137.61
-1.94%
|
7/7/2020
|
$89.47
|
PP = $93.68
|
|
MB = $98.36
|
 Most Recent Note - 8/13/2020 7:57:34 PM
G - Rebounded near its all-time high with average volume behind today's big gain. Very extended from any sound base. Bullish action came after it reported Jun '20 quarterly earnings +890% on +62% sales revenue for the Jun '20 quarter versus the year ago period. Prior highs in the $93 area define initial support above its 50 DMA line ($92.41).
>>> FEATURED STOCK ARTICLE : Rally Continues Into Record High Territory - 8/4/2020 |
View all notes |
Set NEW NOTE alert |
Company Profile |
SEC
News |
Chart |
Request a new note
C
A
S
I |
BMRN
-
NASDAQ
Biomarin Pharmaceutical
DRUGS - Drug Manufacturers - Other
|
$116.87
|
-1.15
-0.97% |
$118.61
|
1,134,317
85.16% of 50 DAV
50 DAV is 1,332,000
|
$131.95
-11.43%
|
6/17/2020
|
$110.95
|
PP = $112.67
|
|
MB = $118.30
|
Most Recent Note - 8/13/2020 7:44:44 PM
G - Still sputtering below its 50 DMA line ($120). A prompt rebound above the 50 DMA line is needed for its outlook to improve. Recently reported Jun '20 quarterly earnings +220% on +11% sales revenues versus the year ago period, continuing its strong earnings track record.
>>> FEATURED STOCK ARTICLE : Hovering Above 50-Day Average After Another Strong Earnings Report - 8/5/2020 |
View all notes |
Set NEW NOTE alert |
Company Profile |
SEC
News |
Chart |
Request a new note
C
A
S
I |
AMD
-
NASDAQ
Advanced Micro Devices
ELECTRONICS - Semiconductor - Broad Line
|
$81.84
|
-0.77
-0.93% |
$84.02
|
57,249,547
87.26% of 50 DAV
50 DAV is 65,605,000
|
$87.29
-6.24%
|
7/22/2020
|
$61.73
|
PP = $59.10
|
|
MB = $62.06
|
Most Recent Note - 8/12/2020 3:41:03 PM
G - Rebounding toward its all-time high with heavier volume behind today's big gain after 3 consecutive losses. Reported earnings +125% on +26% sales revenues for the Jun '20 quarter versus the year ago period. It is still very extended from the previously noted base. Its 50 DMA line ($61.11) and prior highs in the $59 area define important support to watch on pullbacks.
>>> FEATURED STOCK ARTICLE : Pullback After Breakout Gain Backed by +152% Above Average Volume - 7/23/2020 |
View all notes |
Set NEW NOTE alert |
Company Profile |
SEC
News |
Chart |
Request a new note
C
A
S
I |
TREX
-
NYSE
Trex Company Inc
MATERIALS and CONSTRUCTION - General Building Materials
|
$143.22
|
+3.76
2.70% |
$144.78
|
479,699
52.89% of 50 DAV
50 DAV is 907,000
|
$144.96
-1.20%
|
6/26/2020
|
$109.05
|
PP = $132.94
|
|
MB = $139.59
|
Most Recent Note - 8/12/2020 6:12:14 PM
Y - Hovering near its all-time high and near its "max buy" level with volume totals cooling. Reported Jun '20 quarterly earnings +27% on +7% sales revenues versus the year ago period. Important near-term support is at its 50 DMA line ($128.68).
>>> FEATURED STOCK ARTICLE : Perched Near All Time High With Earnings News Due Monday - 7/30/2020 |
View all notes |
Set NEW NOTE alert |
Company Profile |
SEC
News |
Chart |
Request a new note
C
A
S
I |
Symbol/Exchange
Company Name
Industry Group |
PRICE |
CHANGE
(%Change) |
Day High |
Volume
(% DAV)
(% 50 day avg vol) |
52 Wk Hi
% From Hi |
Featured
Date |
Price
Featured |
Pivot Featured |
|
Max Buy |
NFLX
-
NASDAQ
Netflix Inc
SPECIALTY RETAIL - Music and Video Stores
|
$481.33
|
+5.86
1.23% |
$484.45
|
3,005,690
39.02% of 50 DAV
50 DAV is 7,703,000
|
$575.37
-16.34%
|
5/14/2020
|
$441.95
|
PP = $449.62
|
|
MB = $472.10
|
Most Recent Note - 8/11/2020 6:13:13 PM
G - Technically, it violated the 50 DMA line ($473.65) and undercut the prior low ($467.54) with today's loss on average volume raising concerns. Only a prompt rebound above the 50 DMA line would help its outlook improve. Fundamentals remain strong.
>>> FEATURED STOCK ARTICLE : Consolidating After Getting Extended From Prior Base - 7/29/2020 |
View all notes |
Set NEW NOTE alert |
Company Profile |
SEC
News |
Chart |
Request a new note
C
A
S
I |
CHGG
-
NYSE
Chegg Inc
Consumer Svcs-Education
|
$76.86
|
+2.36
3.17% |
$79.11
|
3,292,380
90.03% of 50 DAV
50 DAV is 3,657,000
|
$89.82
-14.43%
|
6/17/2020
|
$63.71
|
PP = $68.08
|
|
MB = $71.48
|
Most Recent Note - 8/13/2020 7:58:44 PM
G - Consolidating after getting very extended from any sound base. Reported Jun '20 quarterly earnings +61% on +63% sales revenues versus the year ago period. Its 50 DMA line ($70.73) defines support to watch above its prior high in the $68 area. Any losses leading to violations would raise concerns and trigger technical sell signals.
>>> FEATURED STOCK ARTICLE : Bullish Action Continued After Latest Strong Earnings Report - 8/6/2020 |
View all notes |
Set NEW NOTE alert |
Company Profile |
SEC
News |
Chart |
Request a new note
C
A
S
I |
LGIH
-
NASDAQ
L G I Homes Inc
Bldg-Resident/Comml
|
$109.76
|
+3.67
3.46% |
$110.24
|
217,037
63.65% of 50 DAV
50 DAV is 341,000
|
$123.94
-11.44%
|
7/7/2020
|
$99.19
|
PP = $95.82
|
|
MB = $100.61
|
Most Recent Note - 8/13/2020 7:56:21 PM
G - Posted a big gain today with light volume. It is still extended from the previously noted base. Its 50 DMA line ($100.31) defines near-term support to watch above prior highs in the $95 area.
>>> FEATURED STOCK ARTICLE : Earning News Due Next Week for Homebuilder - 7/31/2020 |
View all notes |
Set NEW NOTE alert |
Company Profile |
SEC
News |
Chart |
Request a new note
C
A
S
I |
NOW
-
NYSE
Servicenow Inc
Computer Sftwr-Enterprse
|
$438.42
|
+11.29
2.64% |
$439.81
|
1,691,604
98.81% of 50 DAV
50 DAV is 1,712,000
|
$454.70
-3.58%
|
4/30/2020
|
$343.05
|
PP = $363.05
|
|
MB = $381.20
|
Most Recent Note - 8/13/2020 7:42:23 PM
G - Consolidating above its 50 DMA line ($415.47) which defines important near-term support to watch. Subsequent losses leading to a violation may trigger a technical sell signal. Reported Jun '20 quarterly earnings +73% on +28% sales revenues versus the year ago period. See the latest FSU analysis for more details and a new annotated graph.
>>> FEATURED STOCK ARTICLE : Consolidating Above 50-Day Average After Another Strong Quarter - 8/13/2020 |
View all notes |
Set NEW NOTE alert |
Company Profile |
SEC
News |
Chart |
Request a new note
C
A
S
I |
TTD
-
NASDAQ
The Trade Desk Inc Cl A
Comml Svcs-Advertising
|
$471.84
|
+11.81
2.57% |
$481.87
|
1,036,954
64.85% of 50 DAV
50 DAV is 1,599,000
|
$510.00
-7.48%
|
6/3/2020
|
$340.61
|
PP = $327.35
|
|
MB = $343.72
|
Most Recent Note - 8/12/2020 6:16:30 PM
G - Hovering near its all-time high. Recently reported Jun '20 quarterly earnings -3% on -13% sales revenues versus the year ago period, raising fundamental concerns. It is extended from any sound base of sufficient length. Its 50 DMA line ($421.28) and prior low ($404 on 7/24/20) define near-term support to watch where violations may trigger technical sell signals. See the latest FSU analysis for more details and a new annotated graph.
>>> FEATURED STOCK ARTICLE : Hovering Near High After Latest Quarterly Report Raised Concerns - 8/12/2020 |
View all notes |
Set NEW NOTE alert |
Company Profile |
SEC
News |
Chart |
Request a new note
C
A
S
I |
Symbol/Exchange
Company Name
Industry Group |
PRICE |
CHANGE
(%Change) |
Day High |
Volume
(% DAV)
(% 50 day avg vol) |
52 Wk Hi
% From Hi |
Featured
Date |
Price
Featured |
Pivot Featured |
|
Max Buy |
DOCU
-
NASDAQ
Docusign Inc
Computer Sftwr-Enterprse
|
$199.38
|
+6.08
3.15% |
$203.85
|
4,043,020
74.98% of 50 DAV
50 DAV is 5,392,000
|
$229.83
-13.25%
|
6/10/2020
|
$149.73
|
PP = $152.10
|
|
MB = $159.71
|
Most Recent Note - 8/13/2020 7:54:20 PM
G - Still very extended from any sound base. Its 50 DMA line ($185.66) defines near-term support to watch.
>>> FEATURED STOCK ARTICLE : E-Signature Firm is Extended From Any Sound Base - 7/28/2020 |
View all notes |
Set NEW NOTE alert |
Company Profile |
SEC
News |
Chart |
Request a new note
C
A
S
I |
PING
-
NYSE
Ping Identity Holdings Corp
Computer Sftwr-Security
|
$32.35
|
-1.17
-3.49% |
$33.09
|
3,444,728
269.48% of 50 DAV
50 DAV is 1,278,300
|
$37.80
-14.42%
|
6/1/2020
|
$29.24
|
PP = $29.90
|
|
MB = $31.40
|
Most Recent Note - 8/13/2020 12:51:23 PM
G - Reported Jun '20 quarterly earnings -27% on -6% sales revenues versus the year ago period, below the +25% minimum earnings guideline, raising fundamental concerns. Undercut its 50 DMA line ($32.62) with today's 5th consecutive volume-driven loss. The next important near-term support is the prior highs in the $29 area. It has not formed a sound base of sufficient length. Completed Secondary Offerings on 7/09/20 and 5/15/20.
>>> FEATURED STOCK ARTICLE : Perched Near High With Earnings News Due Wednesday Evening - 8/10/2020 |
View all notes |
Set NEW NOTE alert |
Company Profile |
SEC
News |
Chart |
Request a new note
C
A
S
I |
|
|
|
THESE ARE NOT BUY RECOMMENDATIONS!
Comments contained in the body of this report are technical
opinions only. The material herein has been obtained
from sources believed to be reliable and accurate, however,
its accuracy and completeness cannot be guaranteed.
This site is not an investment advisor, hence it does
not endorse or recommend any securities or other investments.
Any recommendation contained in this report may not
be suitable for all investors and it is not to be deemed
an offer or solicitation on our part with respect to
the purchase or sale of any securities. All trademarks,
service marks and trade names appearing in this report
are the property of their respective owners, and are
likewise used for identification purposes only.
This report is a service available
only to active Paid Premium Members.
You may opt-out of receiving report notifications
at any time. Questions or comments may be submitted
by writing to Premium Membership Services 665 S.E. 10 Street, Suite 201 Deerfield Beach, FL 33441-5634 or by calling 1-800-965-8307
or 954-785-1121.
|
|
|