You are not logged in.
This means you
CAN ONLY VIEW reports that were published prior to Friday, February 23, 2024.
You
MUST UPGRADE YOUR MEMBERSHIP if you want to see any current reports.
AFTER MARKET UPDATE - TUESDAY, AUGUST 13TH, 2019
Previous After Market Report Next After Market Report >>>
|
|
|
|
DOW |
+372.54 |
26,279.91 |
+1.44% |
|
Volume |
856,150,820 |
+51% |
|
Volume |
2,334,058,560 |
+13% |
|
NASDAQ |
+152.95 |
8,016.36 |
+1.95% |
|
Advancers |
2,058 |
71% |
|
Advancers |
2,117 |
69% |
|
S&P 500 |
+43.23 |
2,926.32 |
+1.50% |
|
Decliners |
826 |
29% |
|
Decliners |
970 |
31% |
|
Russell 2000 |
+16.30 |
1,510.58 |
+1.09% |
|
52 Wk Highs |
156 |
|
|
52 Wk Highs |
72 |
|
|
S&P 600 |
+9.36 |
929.89 |
+1.02% |
|
52 Wk Lows |
142 |
|
|
52 Wk Lows |
133 |
|
|
 |
Major Averages Confirm New Rally with More Leadership and Volume
Kenneth J. Gruneisen - Passed the CAN SLIM® Master's Exam
The Dow surged 372 points, posting its best session in at least two months. The S&P 500 added 1.5%, while the Nasdaq Composite was up 2%. Volume totals reported were higher than the prior session totals on the NYSE and on the Nasdaq exchange. Breadth was positive as advancers led decliners by a 5-2 margin on the NYSE and more than 2-1 on the Nasdaq exchange. There were 39 high-ranked companies from the Leaders List hit new 52-week highs and were listed on the BreakOuts Page, versus the total of 40 on the prior session. New 52-week highs totals expanded and outnumbered shrinking new 52-week lows on the NYSE. New highs also expanded on the Nasdaq exchange but they were outnumbered by new lows. The Featured Stocks Page provides the most timely analysis on high-ranked leaders.Charts used courtesy of www.stockcharts.com
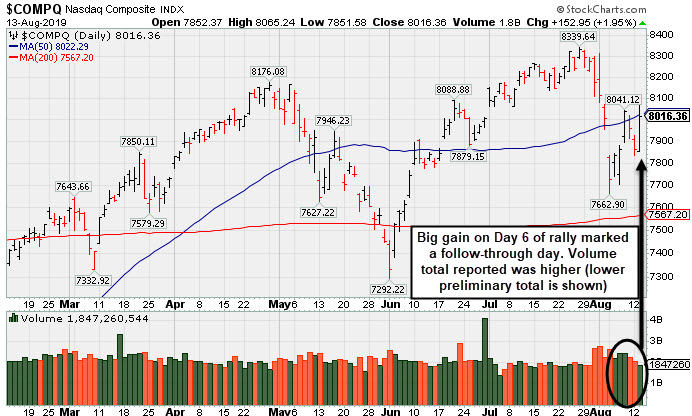
PICTURED: The Nasdaq Composite Index posted a big +1.95% gain on Day 6 of the rally attempt, and the volume total reported was higher while the number of stocks hitting new highs rose. The follow-through day marked a bullish shift concerning the M criteria of the fact-based investment system, giving investors a green light to make carefully selected new buying efforts.
Stocks finished firmly higher Tuesday, snapping a two-day losing streak amid easing trade tensions. The major averages reversed early session declines amid reports the U.S. will delay the implementation of the proposed September 1st tariffs on Chinese imports. Popular holiday shopping items, such as phones and toys, are set to be excluded until mid-December.
Treasuries declined, with the yield on the 10-year note up five basis points to 1.69%. The spread between two- and 10-year yields touched the narrowest since 2007. On the data front, core consumer prices (excluding food and energy), increased at an annualized pace of 2.2% in July, notching a six-month high. A separate release revealed small business optimism improved last month. In commodities, WTI crude climbed 4% to $57.10/barrel, while COMEX gold erased early session gains to finish 0.2% lower at $1,502.20/ounce.
Technology shares paced gains, with the sector rallying 2.5% following the positive trade rhetoric. Apple (AAPL +4.23%) climbed, while the Philadelphia Semiconductor Index also outperformed, up nearly 3%. The news of potential tariff delays on Chinese goods also provided a tailwind to retailers, with Nike (NKE +2.05%) . In earnings, JD.com (JD +12.89%) rose after topping analyst profit and revenue estimates. In other corporate news, Constellation Brands (STZ +1.80%) rose after announcing the sale of its Canadian whiskey business for $266 million.
|
 Kenneth J. Gruneisen started out as a licensed stockbroker in August 1987, a couple of months prior to the historic stock market crash that took the Dow Jones Industrial Average down -22.6% in a single day. He has published daily fact-based fundamental and technical analysis on high-ranked stocks online for two decades. Through FACTBASEDINVESTING.COM, Kenneth provides educational articles, news, market commentary, and other information regarding proven investment systems that work in good times and bad.
Comments contained in the body of this report are technical opinions only and are not necessarily those of Gruneisen Growth Corp. The material herein has been obtained from sources believed to be reliable and accurate, however, its accuracy and completeness cannot be guaranteed. Our firm, employees, and customers may effect transactions, including transactions contrary to any recommendation herein, or have positions in the securities mentioned herein or options with respect thereto. Any recommendation contained in this report may not be suitable for all investors and it is not to be deemed an offer or solicitation on our part with respect to the purchase or sale of any securities. |
|
 |
Retail, Financial, Tech, and Energy-Linked Groups Rose
Kenneth J. Gruneisen - Passed the CAN SLIM® Master's Exam
The Retail Index ($RLX +1.86%) outpaced the Broker/Dealer Index ($XBD +1.22%) and the Bank Index ($BKX +0.87%). The tech sector also had a positive bias as the Semiconductor Index ($SOX +2.95%) and the Networking Index ($NWX +1.62%) both outpaced the Biotech Index ($BTK +0.96%). The Gold & Silver Index ($XAU -1.70%) was a standout decliner while the Integrated Oil Index ($XOI +1.40%) outpaced the Oil Services Index ($OSX +0.29%).
Charts courtesy of www.stockcharts.com
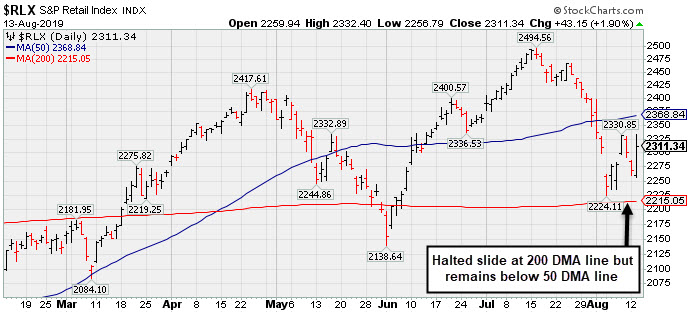
PICTURED: The Retail Index ($XBD +1.90%) halted its slide at its 200-day moving average (DMA) line but remains below its 50 DMA line.
| Oil Services |
$OSX |
65.22 |
+0.19 |
+0.29% |
-19.08% |
| Integrated Oil |
$XOI |
1,189.94 |
+16.37 |
+1.40% |
+2.66% |
| Semiconductor |
$SOX |
1,489.66 |
+42.68 |
+2.95% |
+28.96% |
| Networking |
$NWX |
568.19 |
+9.04 |
+1.62% |
+16.27% |
| Broker/Dealer |
$XBD |
250.61 |
+3.02 |
+1.22% |
+5.59% |
| Retail |
$RLX |
2,311.34 |
+42.11 |
+1.86% |
+18.44% |
| Gold & Silver |
$XAU |
93.27 |
-1.61 |
-1.70% |
+32.00% |
| Bank |
$BKX |
93.34 |
+0.80 |
+0.86% |
+8.80% |
| Biotech |
$BTK |
4,569.50 |
+43.27 |
+0.96% |
+8.26% |
|
|
|
 |
Volume Totals Cooling as Bullish Action Continues
Kenneth J. Gruneisen - Passed the CAN SLIM® Master's Exam
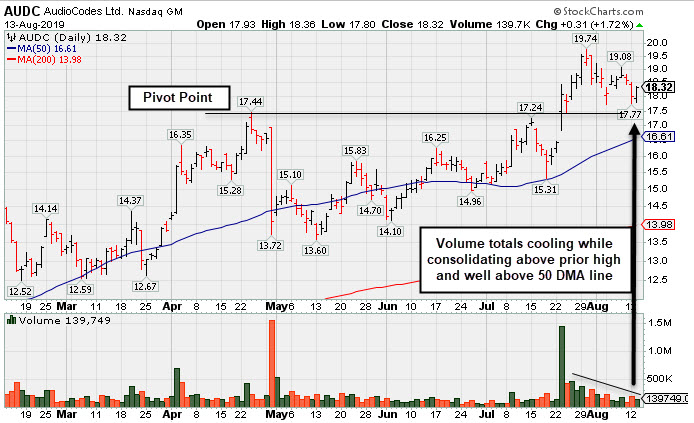
Audiocodes Ltd (AUDC +$0.31 or +1.72% to $18.32) has seen volume totals cooling while consolidating below its "max buy" level and well above its 50-day moving average (DMA) line ($16.61). Bullish action came after it reported earnings +57% on +14% sales revenues for the Jun '19 quarter, continuing its strong earnings track record for a 10th consecutive quarterly comparison above the +25% minimum guideline (C criteria). Annual earnings growth has been strong and it has a 99 Earnings Per Share Rating.
AUDC was highlighted in yellow with new pivot point cited based on its 4/24/19 high plus 10 cents in the 7/15/19 mid-day report (read here). This Israel-based designer of advanced voice-over-IP products shown in this FSU section on 7/15/19 with an annotated graph under the headline, "Posted a Gain With Average Volume for Best Ever Close".
The number of top-rated funds owning its shares rose from 33 in Mar '18 to 77 in Jun '19, a reassuring sign concerning the I criteria. Its current Up/Down Volume Ratio of 1.6 is an unbiased indication its shares have been under accumulation over the past 50 days. It has a Timeliness Rating of B and Sponsorship Rating of A. The small supply of 22.8 million shares (S criteria) in the public float can contribute to greater price volatility in the event of institutional buying or selling.
Charts courtesy of www.stockcharts.com
|
|
|
Color Codes Explained :
Y - Better candidates highlighted by our
staff of experts.
G - Previously featured
in past reports as yellow but may no longer be buyable under the
guidelines.
***Last / Change / Volume data in this table is the closing quote data***
Symbol/Exchange
Company Name
Industry Group |
PRICE |
CHANGE
(%Change) |
Day High |
Volume
(% DAV)
(% 50 day avg vol) |
52 Wk Hi
% From Hi |
Featured
Date |
Price
Featured |
Pivot Featured |
|
Max Buy |
 SPSC
-
NASDAQ
SPSC
-
NASDAQ
S P S Commerce Inc
COMPUTER SOFTWARE and SERVICES - Application Software
|
$106.62
|
+1.46
1.39% |
$107.66
|
77,314
59.02% of 50 DAV
50 DAV is 131,000
|
$118.28
-9.86%
|
6/7/2019
|
$107.72
|
PP = $115.10
|
|
MB = $120.86
|
 Most Recent Note - 8/13/2019 6:36:10 PM
Y - Finding support recently at its 50 DMA line ($105.43). Stalled after a gap up and big volume-driven gain noted on 7/26/19. Subsequent gains and a strong close above the pivot point may clinch a convincing new (or add-on) technical buy signal. Reported earnings +22% on +12% sales revenues for the Jun '19 quarter, slightly under the +25% minimum earnings guideline (C criteria), raising fundamental concerns.
>>> FEATURED STOCK ARTICLE : Found Support at 50-Day Average - 8/8/2019 |
View all notes |
Set NEW NOTE alert |
Company Profile |
SEC
News |
Chart |
Request a new note
C
A
S
I |
EPAM
-
NYSE
Epam Systems Inc
COMPUTER SOFTWARE and SERVICES - Information Technology Service
|
$189.61
|
+3.17
1.70% |
$190.36
|
324,817
73.99% of 50 DAV
50 DAV is 439,000
|
$201.00
-5.67%
|
5/9/2019
|
$169.25
|
PP = $180.55
|
|
MB = $189.58
|
Most Recent Note - 8/12/2019 8:14:26 PM
Y - Rebound above its 50 DMA line helped its outlook to improve after it reported earnings +27% on +24% sales revenues for the Jun '19 quarter. See the latest FSU analysis for more details and a new annotated graph.
>>> FEATURED STOCK ARTICLE : Rebounded Above 50-Day Average Following Earnings Report - 8/12/2019 |
View all notes |
Set NEW NOTE alert |
Company Profile |
SEC
News |
Chart |
Request a new note
C
A
S
I |
AUDC
-
NASDAQ
Audiocodes Ltd
ELECTRONICS - Scientific and Technical Instrum
|
$18.32
|
+0.31
1.72% |
$18.36
|
139,749
80.32% of 50 DAV
50 DAV is 174,000
|
$19.74
-7.19%
|
7/15/2019
|
$17.10
|
PP = $17.54
|
|
MB = $18.42
|
Most Recent Note - 8/13/2019 6:23:44 PM
Y - Volume totals have been cooling while consolidating below its "max buy" level. Reported earnings +57% on +14% sales revenues for the Jun '19 quarter, continuing its strong earnings track record. Prior highs in the $17 area define initial support above its 50 DMA line ($16.61). See the latest FSU analysis for more details and a new annotated graph.
>>> FEATURED STOCK ARTICLE : Volume Totals Cooling as Bullish Action Continues - 8/13/2019 |
View all notes |
Set NEW NOTE alert |
Company Profile |
SEC
News |
Chart |
Request a new note
C
A
S
I |
LHCG
-
NASDAQ
L H C Group Inc
HEALTH SERVICES - Home Health Care
|
$120.79
|
+3.30
2.81% |
$120.90
|
156,520
70.50% of 50 DAV
50 DAV is 222,000
|
$129.37
-6.63%
|
7/1/2019
|
$110.94
|
PP = $122.20
|
|
MB = $128.31
|
Most Recent Note - 8/12/2019 8:18:42 PM
G - Color code is changed to green after slumping below its 50 DMA line ($120) today raising concerns. Reported earnings +27% on +3% sales revenues for the Jun '19 quarter. Prior quarterly comparisons showed much stronger sales revenues growth. Recent gains above its pivot point were not backed by the +40% above average volume needed to trigger a proper new (or add-on) technical buy signal.
>>> FEATURED STOCK ARTICLE : Consolidating Following a Negative Reversal at High - 7/22/2019 |
View all notes |
Set NEW NOTE alert |
Company Profile |
SEC
News |
Chart |
Request a new note
C
A
S
I |
CHDN
-
NASDAQ
Churchill Downs Inc
LEISURE - Gaming Activities
|
$120.36
|
+1.92
1.62% |
$121.60
|
182,101
67.95% of 50 DAV
50 DAV is 268,000
|
$132.73
-9.32%
|
7/22/2019
|
$118.45
|
PP = $118.89
|
|
MB = $124.83
|
Most Recent Note - 8/13/2019 12:47:46 PM
Y - Found support recently above its 50 DMA line ($116.26). Reported Jun '19 earnings rose +10% on +26% sales revenues versus the year ago period, below the +25% minimum earnings guideline (C criteria). The prior low ($108.57 on 6/25/19) defines the next important near-term support to watch below its 50 DMA line.
>>> FEATURED STOCK ARTICLE : Volume Light While Hovering at Record High - 7/16/2019 |
View all notes |
Set NEW NOTE alert |
Company Profile |
SEC
News |
Chart |
Request a new note
C
A
S
I |
Symbol/Exchange
Company Name
Industry Group |
PRICE |
CHANGE
(%Change) |
Day High |
Volume
(% DAV)
(% 50 day avg vol) |
52 Wk Hi
% From Hi |
Featured
Date |
Price
Featured |
Pivot Featured |
|
Max Buy |
LULU
-
NASDAQ
Lululemon Athletica
MANUFACTURING - Textile Manufacturing
|
$179.59
|
+0.77
0.43% |
$183.72
|
1,679,114
82.80% of 50 DAV
50 DAV is 2,028,000
|
$194.25
-7.55%
|
6/13/2019
|
$174.48
|
PP = $179.60
|
|
MB = $188.58
|
Most Recent Note - 8/13/2019 6:34:42 PM
G - Color code is changed to green while sputtering below its 50 DMA line ($182.65). A rebound above the 50 DMA line is needed to help its technical stance improve. Reported Apr '19 quarterly earnings +35% on +20% sales revenues versus the year ago period.
>>> FEATURED STOCK ARTICLE : Quietly Hovering at All-Time High - 7/17/2019 |
View all notes |
Set NEW NOTE alert |
Company Profile |
SEC
News |
Chart |
Request a new note
C
A
S
I |
ULTA
-
NASDAQ
Ulta Beauty Inc
SPECIALTY RETAIL - Specialty Retail, Other
|
$341.20
|
+4.69
1.39% |
$348.32
|
573,952
85.28% of 50 DAV
50 DAV is 673,000
|
$368.83
-7.49%
|
3/15/2019
|
$341.27
|
PP = $322.59
|
|
MB = $338.72
|
Most Recent Note - 8/13/2019 6:33:18 PM
G - Sputtering below its 50 DMA line ($347.81) again and a rebound above it is needed for its outlook to improve. Still hovering near its all-time high. Reported earnings +17% on +13% sales revenues for the Apr '19 quarter, below the +25% minimum earnings guideline (C criteria), raising fundamental concerns.
>>> FEATURED STOCK ARTICLE : Ulta Beauty Sputtering Below 50-Day Moving Average - 8/7/2019 |
View all notes |
Set NEW NOTE alert |
Company Profile |
SEC
News |
Chart |
Request a new note
C
A
S
I |
CHGG
-
NYSE
Chegg Inc
Consumer Svcs-Education
|
$41.72
|
+0.24
0.58% |
$42.14
|
1,648,914
109.13% of 50 DAV
50 DAV is 1,511,000
|
$48.22
-13.48%
|
7/8/2019
|
$44.11
|
PP = $41.79
|
|
MB = $43.88
|
Most Recent Note - 8/12/2019 8:17:02 PM
Y - Slumped today with higher volume testing prior highs in the $40-41 area which define important near-term support along with its 50 DMA line ($41.36). More damaging losses would raise concerns and trigger a technical sell signal. Reported earnings +92% on +26% sales revenues for the Jun '19 quarter.
>>> FEATURED STOCK ARTICLE : Consolidating Above Prior Highs and 50-Day Average - 8/6/2019 |
View all notes |
Set NEW NOTE alert |
Company Profile |
SEC
News |
Chart |
Request a new note
C
A
S
I |
VEEV
-
NYSE
Veeva Systems Inc Cl A
Computer Sftwr-Medical
|
$162.34
|
+2.30
1.44% |
$163.89
|
916,256
62.08% of 50 DAV
50 DAV is 1,476,000
|
$176.90
-8.23%
|
5/30/2019
|
$154.32
|
PP = $145.80
|
|
MB = $153.09
|
Most Recent Note - 8/12/2019 8:25:07 PM
G - Still sputtering below its 50 DMA line ($165.25) which acted as resistance after volume-driven losses. A rebounded above the 50 DMA line is needed for its outlook to improve. Fundamentals remain strong.
>>> FEATURED STOCK ARTICLE : Recently Found Support Near 50-Day Moving Average - 8/1/2019 |
View all notes |
Set NEW NOTE alert |
Company Profile |
SEC
News |
Chart |
Request a new note
C
A
S
I |
PAYC
-
NYSE
Paycom Software Inc
COMPUTER SOFTWARE and SERVICES - Application Software
|
$243.58
|
+4.48
1.87% |
$244.88
|
459,679
68.81% of 50 DAV
50 DAV is 668,000
|
$246.85
-1.32%
|
2/6/2019
|
$171.66
|
PP = $164.18
|
|
MB = $172.39
|
Most Recent Note - 8/12/2019 8:22:07 PM
G - Found prompt support near its 50 DMA line while building a new flat base. Reported earnings +27% on +31% sales revenues for the Jun '19 quarter, continuing its strong earnings track record.
>>> FEATURED STOCK ARTICLE : Found Support and Gapped Up Following Earnings Report - 8/2/2019 |
View all notes |
Set NEW NOTE alert |
Company Profile |
SEC
News |
Chart |
Request a new note
C
A
S
I |
Symbol/Exchange
Company Name
Industry Group |
PRICE |
CHANGE
(%Change) |
Day High |
Volume
(% DAV)
(% 50 day avg vol) |
52 Wk Hi
% From Hi |
Featured
Date |
Price
Featured |
Pivot Featured |
|
Max Buy |
PLNT
-
NYSE
Planet Fitness Inc Cl A
Leisure-Services
|
$72.63
|
+1.00
1.40% |
$72.89
|
1,255,899
80.04% of 50 DAV
50 DAV is 1,569,000
|
$81.90
-11.32%
|
7/26/2019
|
$79.15
|
PP = $82.00
|
|
MB = $86.10
|
Most Recent Note - 8/13/2019 6:31:33 PM
G - Still sputtering below its 50 DMA line ($76.50), and a rebound above it is needed for its outlook to improve Reported earnings +32% on +29% sales revenues for the Jun '19 quarter continuing its strong earnings track record.
>>> FEATURED STOCK ARTICLE : Fitness Firm Forming a New Base - 7/26/2019 |
View all notes |
Set NEW NOTE alert |
Company Profile |
SEC
News |
Chart |
Request a new note
C
A
S
I |
BLD
-
NYSE
Topbuild Corp
Bldg-Constr Prds/Misc
|
$91.69
|
+2.30
2.57% |
$92.04
|
176,945
54.95% of 50 DAV
50 DAV is 322,000
|
$92.07
-0.41%
|
5/17/2019
|
$82.19
|
PP = $87.31
|
|
MB = $91.68
|
Most Recent Note - 8/13/2019 6:26:03 PM
G - Posted a gain with light volume today for a best-ever close and its color code is changed to green. Bullish action came after it reported earnings +39% on +9% sales revenues for the Jun '19 quarter versus the year ago period, continuing its strong earnings track record. Its 50 DMA line ($82.36) and recent lows define near-term support to watch on pullbacks.
>>> FEATURED STOCK ARTICLE : Perched Near 52-Week High Finding Support - 7/25/2019 |
View all notes |
Set NEW NOTE alert |
Company Profile |
SEC
News |
Chart |
Request a new note
C
A
S
I |
TEAM
-
NASDAQ
Atlassian Corp Plc Cl A
Comp Sftwr-Spec Enterprs
|
$146.70
|
+3.02
2.10% |
$147.01
|
897,373
68.03% of 50 DAV
50 DAV is 1,319,000
|
$149.80
-2.07%
|
5/24/2019
|
$129.52
|
PP = $132.09
|
|
MB = $138.69
|
Most Recent Note - 8/13/2019 6:29:31 PM
G - Posted a gain today with below average volume and its color code is changed to green while getting extended from any sound base. Found support above its 50 DMA line ($135). Its prior low ($130.78 on 7/23/19) defines important near-term support to watch where a violation would raise serious concerns and trigger a more worrisome technical sell signal. Reported earnings +43% on +36% sales revenues for the Jun '19 quarter, continuing its strong earnings track record.
>>> FEATURED STOCK ARTICLE : Abrupt Retreat After Getting Very Extended From Prior Base - 7/29/2019 |
View all notes |
Set NEW NOTE alert |
Company Profile |
SEC
News |
Chart |
Request a new note
C
A
S
I |
GLOB
-
NYSE
Globant SA
Computer-Tech Services
|
$105.41
|
+1.95
1.88% |
$105.94
|
230,004
70.99% of 50 DAV
50 DAV is 324,000
|
$112.33
-6.16%
|
2/15/2019
|
$69.35
|
PP = $70.00
|
|
MB = $73.50
|
Most Recent Note - 8/12/2019 1:07:28 PM
G - Gapped down and undercut its 50 DMA line ($102.94). It has not formed a sound new base of sufficient length. Due to report earnings news on 8/15/19. See the latest FSU analysis for more details and an annotated graph.
>>> FEATURED STOCK ARTICLE : Consolidating Above 50-Day Average With Earnings News Soon - 8/9/2019 |
View all notes |
Set NEW NOTE alert |
Company Profile |
SEC
News |
Chart |
Request a new note
C
A
S
I |
TTD
-
NASDAQ
The Trade Desk Inc Cl A
Comml Svcs-Advertising
|
$264.64
|
+9.56
3.75% |
$266.00
|
1,948,659
126.70% of 50 DAV
50 DAV is 1,538,000
|
$289.51
-8.59%
|
7/18/2019
|
$240.61
|
PP = $258.10
|
|
MB = $271.01
|
Most Recent Note - 8/12/2019 1:18:08 PM
Y - Color code is changed to yellow while consolidating below its "max buy" level. Its 50 DMA line ($245) defines support. Reported Jun '19 quarterly earnings +58% on +42% sales revenues.
>>> FEATURED STOCK ARTICLE : Endured Distributional Pressure While Building on New Base - 7/18/2019 |
View all notes |
Set NEW NOTE alert |
Company Profile |
SEC
News |
Chart |
Request a new note
C
A
S
I |
Symbol/Exchange
Company Name
Industry Group |
PRICE |
CHANGE
(%Change) |
Day High |
Volume
(% DAV)
(% 50 day avg vol) |
52 Wk Hi
% From Hi |
Featured
Date |
Price
Featured |
Pivot Featured |
|
Max Buy |
PAGS
-
NYSE
Pagseguro Digital Cl A
Finance-CrdtCard/PmtPr
|
$46.80
|
+1.96
4.37% |
$47.12
|
2,206,718
98.65% of 50 DAV
50 DAV is 2,237,000
|
$48.88
-4.26%
|
6/25/2019
|
$37.69
|
PP = $40.07
|
|
MB = $42.07
|
Most Recent Note - 8/13/2019 12:46:12 PM
G - Posting a solid gain today with light volume. Earnings news is due on 8/15/19. Prior high in the $40 area defines initial support to watch along with its 50 DMA line ($41.32).
>>> FEATURED STOCK ARTICLE : Encountering Distributional Pressure After Impressive Sprint - 7/30/2019 |
View all notes |
Set NEW NOTE alert |
Company Profile |
SEC
News |
Chart |
Request a new note
C
A
S
I |
|
|
|
THESE ARE NOT BUY RECOMMENDATIONS!
Comments contained in the body of this report are technical
opinions only. The material herein has been obtained
from sources believed to be reliable and accurate, however,
its accuracy and completeness cannot be guaranteed.
This site is not an investment advisor, hence it does
not endorse or recommend any securities or other investments.
Any recommendation contained in this report may not
be suitable for all investors and it is not to be deemed
an offer or solicitation on our part with respect to
the purchase or sale of any securities. All trademarks,
service marks and trade names appearing in this report
are the property of their respective owners, and are
likewise used for identification purposes only.
This report is a service available
only to active Paid Premium Members.
You may opt-out of receiving report notifications
at any time. Questions or comments may be submitted
by writing to Premium Membership Services 665 S.E. 10 Street, Suite 201 Deerfield Beach, FL 33441-5634 or by calling 1-800-965-8307
or 954-785-1121.
|
|
|

