You are not logged in.
This means you
CAN ONLY VIEW reports that were published prior to Sunday, February 25, 2024.
You
MUST UPGRADE YOUR MEMBERSHIP if you want to see any current reports.
AFTER MARKET UPDATE - WEDNESDAY, AUGUST 12TH, 2020
Previous After Market Report Next After Market Report >>>
|
|
|
|
DOW |
+289.93 |
27,976.84 |
+1.05% |
|
Volume |
770,948,616 |
-19% |
|
Volume |
3,705,705,100 |
-13% |
|
NASDAQ |
+229.42 |
11,012.24 |
+2.13% |
|
Advancers |
1,844 |
63% |
|
Advancers |
1,833 |
56% |
|
S&P 500 |
+46.66 |
3,380.35 |
+1.40% |
|
Decliners |
1,084 |
37% |
|
Decliners |
1,419 |
44% |
|
Russell 2000 |
+8.15 |
1,583.25 |
+0.52% |
|
52 Wk Highs |
88 |
|
|
52 Wk Highs |
111 |
|
|
S&P 600 |
+4.38 |
924.17 |
+0.48% |
|
52 Wk Lows |
1 |
|
|
52 Wk Lows |
25 |
|
|
 |
Major Indices Rose With Less Volume and Less Leadership
Kenneth J. Gruneisen - Passed the CAN SLIM® Master's Exam
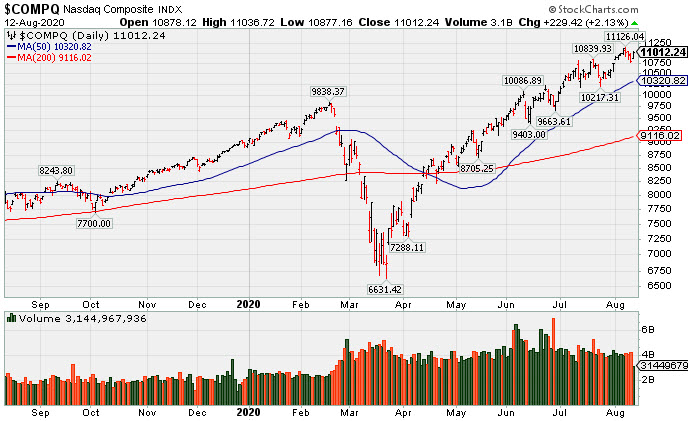
The Dow was up 289 points, while the Nasdaq Composite climbed 2.1% and the S&P 500 rallied 1.4%. The reported volume totals were lighter than the prior session on the NYSE and on the Nasdaq exchange, indicating lackluster institutional buying demand. Advancers led decliners by more than a 3-2 margin on the NYSE and by a 9-7 margin on the Nasdaq exchange. There were 50 high-ranked companies from the Leaders List that hit new 52-week highs and were listed on the BreakOuts Page, versus the total of 59 on the prior session. New 52-week highs totals contracted yet still outnumbered new 52-week lows totals again on both the NYSE and the Nasdaq exchange. The major indices are in a confirmed uptrend (M criteria). Any sustainable rally requires a healthy crop of new leaders, so it remains ever-important to see substantial new highs totals. Charts used courtesy of www.stockcharts.com
PICTURED: The Nasdaq Composite Index is perched near its record high. Stocks finished firmly higher on Wednesday. The S&P 500 rallied 1.4%, paring an earlier gain of as much as 1.6% that briefly took the benchmark index above its February 19 record closing level. Optimism surrounding a potential COVID-19 vaccine helped boost sentiment. The U.S. government announced it would purchase 100 million doses of Moderna’s (MRNA +0.80%) vaccine candidate in a deal worth over $1.5 billion.
Ten of 11 S&P 500 sectors closed in positive territory with Financials the sole declining group. Technology stocks paced the gains, rising 2.3%. Mega-cap shares were among the standouts, with Apple (AAPL), Microsoft (MSFT), and Amazon (AMZN) each adding at least 2.7%. In corporate news, Tesla (TSLA +13.12%) after the electric vehicle manufacturer announced a 5-for-1 stock split.
Treasuries slumped for a fourth-consecutive day, but pared a decline after a record 10-year auction was met with solid demand. The yield on the 10-year note finished up three basis points to 0.66%, still its highest level in more than a month. Meanwhile, a larger-than-anticipated increase in consumer prices provided further support to rates. Core CPI (excluding food and energy) advanced 1.6% year-over-year in July, well above the prior month’s reading of 1.2% and the largest increase since 1991.
In commodities, WTI crude jumped more than 2% to its best closing level since early March after reports showed a greater-than-anticipated drawdown in U.S. crude stockpiles. COMEX gold steadied after posting its worst day since 2013 on Tuesday.
|
 Kenneth J. Gruneisen started out as a licensed stockbroker in August 1987, a couple of months prior to the historic stock market crash that took the Dow Jones Industrial Average down -22.6% in a single day. He has published daily fact-based fundamental and technical analysis on high-ranked stocks online for two decades. Through FACTBASEDINVESTING.COM, Kenneth provides educational articles, news, market commentary, and other information regarding proven investment systems that work in good times and bad.
Comments contained in the body of this report are technical opinions only and are not necessarily those of Gruneisen Growth Corp. The material herein has been obtained from sources believed to be reliable and accurate, however, its accuracy and completeness cannot be guaranteed. Our firm, employees, and customers may effect transactions, including transactions contrary to any recommendation herein, or have positions in the securities mentioned herein or options with respect thereto. Any recommendation contained in this report may not be suitable for all investors and it is not to be deemed an offer or solicitation on our part with respect to the purchase or sale of any securities. |
|
 |
Retail, Energy, Tech, and Broker/Dealer Indexes Rose
Kenneth J. Gruneisen - Passed the CAN SLIM® Master's Exam
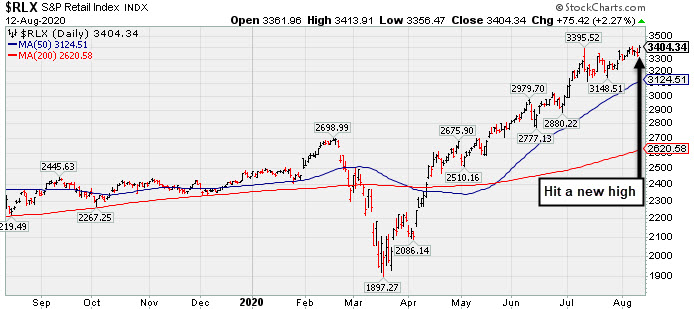
The Retail Index ($RLX +2.27%) posted a solid gain that helped underpin the major indices and the Broker/Dealer Index ($XBD +0.44%) also edged higher, but the Bank Index ($BKX -0.62%) edged lower. The Semiconductor Index ($SOX +3.36%) led the tech sector higher as the Biotech Index ($BTK +1.22%) posted a smaller gain and the Networking Index ($NWX +0.33%) edged higher. Energy-linked groups rose as the Oil Services Index ($OSX +0.77%) and Integrated Oil Index ($XOI +1.33%) both notched gains. The Gold & Silver Index ($XAU +0.15%) finished flat.PICTURED: The Retail Index ($RLX +2.27%) hit a new high.
| Oil Services |
$OSX |
40.39 |
+0.31 |
+0.77% |
-48.41% |
| Integrated Oil |
$XOI |
785.48 |
+10.33 |
+1.33% |
-38.18% |
| Semiconductor |
$SOX |
2,227.22 |
+72.43 |
+3.36% |
+20.42% |
| Networking |
$NWX |
616.44 |
+2.03 |
+0.33% |
+5.66% |
| Broker/Dealer |
$XBD |
294.84 |
+1.29 |
+0.44% |
+1.53% |
| Retail |
$RLX |
3,404.34 |
+75.42 |
+2.27% |
+38.99% |
| Gold & Silver |
$XAU |
141.68 |
+0.21 |
+0.15% |
+32.51% |
| Bank |
$BKX |
79.56 |
-0.50 |
-0.62% |
-29.82% |
| Biotech |
$BTK |
5,604.30 |
+67.59 |
+1.22% |
+10.59% |
|
|
|
 |
Hovering Near High After Latest Quarterly Report Raised Concerns
Kenneth J. Gruneisen - Passed the CAN SLIM® Master's Exam
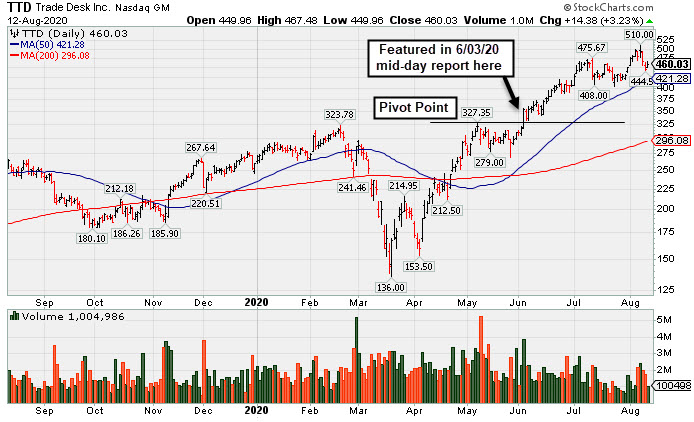
The Trade Desk Inc Cl A (TTD +$14.38 or +3.23% to $460.03) is still hovering near its all-time high. Recently it reported Jun '20 quarterly earnings -3% on -13% sales revenues versus the year ago period, well below the +25% minimum earnings guideline (C criteria), raising fundamental concerns. It is extended from any sound base of sufficient length. Its 50-day moving average (DMA) line ($421.28) and prior low ($404 on 7/24/20) define near-term support to watch where violations may trigger technical sell signals.
TTD traded up as much as +50% since highlighted in yellow with new pivot point cited based on its 5/07/20 high in the 6/03/20 mid-day report (read here). The Comml Svcs-Advertising firm was last shown in this FSU section on 7/20/20 with an annotated graph under the headline, "Rebounded Near All-Time High With Gain Backed by Light Volume".
Its annual earnings (A criteria) history has been strong, and it has a 97 Earnings Per Share Rating. The number of top-rated funds owning its shares rose from 280 in Mar '18 to 721 in Jun '20, a reassuring sign concerning the I criteria. Its current Up/Down Volume Ratio of 2.3 is an unbiased indication its shares have been under accumulation over the past 50 days. It has a Timeliness Rating of B and a Sponsorship Rating of B. There are only 46.7 million shares outstanding (S criteria) which can contribute to greater volatility in the event of institutional buying or selling. |
|
|
Color Codes Explained :
Y - Better candidates highlighted by our
staff of experts.
G - Previously featured
in past reports as yellow but may no longer be buyable under the
guidelines.
***Last / Change / Volume data in this table is the closing quote data***
Symbol/Exchange
Company Name
Industry Group |
PRICE |
CHANGE
(%Change) |
Day High |
Volume
(% DAV)
(% 50 day avg vol) |
52 Wk Hi
% From Hi |
Featured
Date |
Price
Featured |
Pivot Featured |
|
Max Buy |
 FTNT
-
NASDAQ
FTNT
-
NASDAQ
Fortinet Inc
Computer Sftwr-Security
|
$126.70
|
+0.11
0.09% |
$128.25
|
1,153,413
72.07% of 50 DAV
50 DAV is 1,600,400
|
$151.95
-16.62%
|
6/22/2020
|
$142.68
|
PP = $149.79
|
|
MB = $157.28
|
 Most Recent Note - 8/12/2020 6:00:13 PM
It will be dropped from the Featured Stocks lists tonight. Failing to promptly rebound after damaging losses violating its 50 DMA line ($136) and undercutting the prior low. Its Relative Strength Rating has slumped to 71, well below the 80+ minimum guideline for buy candidates. Its Jun '20 quarterly report of earnings +41% on +18% sales revenues versus the year ago period continued its strong earnings track record. Faces resistance due to overhead supply up to the $151 level which may hinder upward price progress.
>>> FEATURED STOCK ARTICLE : Rebounded Above 50-Day Average; Earnings News Due on - 8/3/2020 |
View all notes |
Set NEW NOTE alert |
Company Profile |
SEC
News |
Chart |
Request a new note
C
A
S
I |
CRL
-
NYSE
Charles River Labs Intl
DRUGS - Biotechnology
|
$219.65
|
+9.41
4.48% |
$220.54
|
340,807
85.20% of 50 DAV
50 DAV is 400,000
|
$221.97
-1.05%
|
7/15/2020
|
$192.66
|
PP = $189.95
|
|
MB = $199.45
|
Most Recent Note - 8/12/2020 3:42:50 PM
G - Quickly rebounding near its all-time high with light volume behind today's big gain. Bullish action last week came after it reported Jun '20 quarterly earnings -3% on +4% sales revenues, below the +25% minimum guideline (C criteria) but better than expected while the company also raised its guidance. The prior high ($189.85 on 6/03/20) defines initial support to watch above its 50 DMA line ($189.40).
>>> FEATURED STOCK ARTICLE : Hit New Highs Again; EPS Rating Dropped Yet Remains High at 92 - 8/7/2020 |
View all notes |
Set NEW NOTE alert |
Company Profile |
SEC
News |
Chart |
Request a new note
C
A
S
I |
EBS
-
NYSE
Emergent Biosolutions
DRUGS - Biotechnology
|
$129.57
|
+7.24
5.92% |
$131.19
|
755,470
72.85% of 50 DAV
50 DAV is 1,037,000
|
$137.61
-5.84%
|
7/7/2020
|
$89.47
|
PP = $93.68
|
|
MB = $98.36
|
Most Recent Note - 8/12/2020 3:44:22 PM
G - Rebounding toward its all-time high with lighter volume behind today's big gain. Very extended from any sound base. Bullish action came after it reported Jun '20 quarterly earnings +890% on +62% sales revenue for the Jun '20 quarter versus the year ago period. Prior highs in the $93 area define initial support above its 50 DMA line ($91.43).
>>> FEATURED STOCK ARTICLE : Rally Continues Into Record High Territory - 8/4/2020 |
View all notes |
Set NEW NOTE alert |
Company Profile |
SEC
News |
Chart |
Request a new note
C
A
S
I |
BMRN
-
NASDAQ
Biomarin Pharmaceutical
DRUGS - Drug Manufacturers - Other
|
$118.02
|
+1.19
1.02% |
$118.98
|
1,006,858
75.42% of 50 DAV
50 DAV is 1,335,000
|
$131.95
-10.56%
|
6/17/2020
|
$110.95
|
PP = $112.67
|
|
MB = $118.30
|
Most Recent Note - 8/10/2020 6:13:38 PM
G - Slumped below its 50 DMA line ($119.52) with a streak of 3 consecutive losses backed by light volume. A prompt rebound above the 50 DMA line is needed for its outlook to improve. Sputtering since it recently reported Jun '20 quarterly earnings +220% on +11% sales revenues versus the year ago period, continuing its strong earnings track record.
>>> FEATURED STOCK ARTICLE : Hovering Above 50-Day Average After Another Strong Earnings Report - 8/5/2020 |
View all notes |
Set NEW NOTE alert |
Company Profile |
SEC
News |
Chart |
Request a new note
C
A
S
I |
AMD
-
NASDAQ
Advanced Micro Devices
ELECTRONICS - Semiconductor - Broad Line
|
$82.61
|
+5.73
7.45% |
$82.88
|
88,319,336
136.53% of 50 DAV
50 DAV is 64,690,000
|
$87.29
-5.36%
|
7/22/2020
|
$61.73
|
PP = $59.10
|
|
MB = $62.06
|
Most Recent Note - 8/12/2020 3:41:03 PM
G - Rebounding toward its all-time high with heavier volume behind today's big gain after 3 consecutive losses. Reported earnings +125% on +26% sales revenues for the Jun '20 quarter versus the year ago period. It is still very extended from the previously noted base. Its 50 DMA line ($61.11) and prior highs in the $59 area define important support to watch on pullbacks.
>>> FEATURED STOCK ARTICLE : Pullback After Breakout Gain Backed by +152% Above Average Volume - 7/23/2020 |
View all notes |
Set NEW NOTE alert |
Company Profile |
SEC
News |
Chart |
Request a new note
C
A
S
I |
Symbol/Exchange
Company Name
Industry Group |
PRICE |
CHANGE
(%Change) |
Day High |
Volume
(% DAV)
(% 50 day avg vol) |
52 Wk Hi
% From Hi |
Featured
Date |
Price
Featured |
Pivot Featured |
|
Max Buy |
TREX
-
NYSE
Trex Company Inc
MATERIALS and CONSTRUCTION - General Building Materials
|
$139.46
|
+3.90
2.88% |
$139.69
|
342,077
37.47% of 50 DAV
50 DAV is 913,000
|
$144.96
-3.79%
|
6/26/2020
|
$109.05
|
PP = $132.94
|
|
MB = $139.59
|
Most Recent Note - 8/12/2020 6:12:14 PM
Y - Hovering near its all-time high and near its "max buy" level with volume totals cooling. Reported Jun '20 quarterly earnings +27% on +7% sales revenues versus the year ago period. Important near-term support is at its 50 DMA line ($128.68).
>>> FEATURED STOCK ARTICLE : Perched Near All Time High With Earnings News Due Monday - 7/30/2020 |
View all notes |
Set NEW NOTE alert |
Company Profile |
SEC
News |
Chart |
Request a new note
C
A
S
I |
NFLX
-
NASDAQ
Netflix Inc
SPECIALTY RETAIL - Music and Video Stores
|
$475.47
|
+8.54
1.83% |
$482.49
|
5,421,868
70.74% of 50 DAV
50 DAV is 7,664,000
|
$575.37
-17.36%
|
5/14/2020
|
$441.95
|
PP = $449.62
|
|
MB = $472.10
|
Most Recent Note - 8/11/2020 6:13:13 PM
G - Technically, it violated the 50 DMA line ($473.65) and undercut the prior low ($467.54) with today's loss on average volume raising concerns. Only a prompt rebound above the 50 DMA line would help its outlook improve. Fundamentals remain strong.
>>> FEATURED STOCK ARTICLE : Consolidating After Getting Extended From Prior Base - 7/29/2020 |
View all notes |
Set NEW NOTE alert |
Company Profile |
SEC
News |
Chart |
Request a new note
C
A
S
I |
CHGG
-
NYSE
Chegg Inc
Consumer Svcs-Education
|
$74.50
|
-2.46
-3.20% |
$77.62
|
5,123,138
141.41% of 50 DAV
50 DAV is 3,623,000
|
$89.82
-17.06%
|
6/17/2020
|
$63.71
|
PP = $68.08
|
|
MB = $71.48
|
Most Recent Note - 8/12/2020 6:14:18 PM
G - Abruptly retreating from its all-time high with today's 3rd consecutive big loss after getting very extended from any sound base. Reported Jun '20 quarterly earnings +61% on +63% sales revenues versus the year ago period. Its 50 DMA line ($70.42) defines support to watch above its prior high in the $68 area. Any losses leading to violations would raise concerns and trigger technical sell signals.
>>> FEATURED STOCK ARTICLE : Bullish Action Continued After Latest Strong Earnings Report - 8/6/2020 |
View all notes |
Set NEW NOTE alert |
Company Profile |
SEC
News |
Chart |
Request a new note
C
A
S
I |
LGIH
-
NASDAQ
L G I Homes Inc
Bldg-Resident/Comml
|
$106.09
|
+1.12
1.07% |
$107.70
|
311,886
91.46% of 50 DAV
50 DAV is 341,000
|
$123.94
-14.40%
|
7/7/2020
|
$99.19
|
PP = $95.82
|
|
MB = $100.61
|
Most Recent Note - 8/11/2020 6:02:06 PM
G - Pulled back today for a big loss marked by above average volume. It is still extended from the previously noted base. Its 50 DMA line ($99.54) defines near-term support to watch above prior highs in the $95 area.
>>> FEATURED STOCK ARTICLE : Earning News Due Next Week for Homebuilder - 7/31/2020 |
View all notes |
Set NEW NOTE alert |
Company Profile |
SEC
News |
Chart |
Request a new note
C
A
S
I |
NOW
-
NYSE
Servicenow Inc
Computer Sftwr-Enterprse
|
$427.13
|
+5.77
1.37% |
$431.43
|
1,614,983
93.89% of 50 DAV
50 DAV is 1,720,000
|
$454.70
-6.06%
|
4/30/2020
|
$343.05
|
PP = $363.05
|
|
MB = $381.20
|
Most Recent Note - 8/11/2020 6:03:31 PM
G - Slumped toward its 50 DMA line ($413.78) which defines important near-term support to watch. Subsequent losses leading to a violation may trigger a technical sell signal. Reported Jun '20 quarterly earnings +73% on +28% sales revenues versus the year ago period.
>>> FEATURED STOCK ARTICLE : Perched Near All-Time High With Earnings News Due Next Week - 7/22/2020 |
View all notes |
Set NEW NOTE alert |
Company Profile |
SEC
News |
Chart |
Request a new note
C
A
S
I |
Symbol/Exchange
Company Name
Industry Group |
PRICE |
CHANGE
(%Change) |
Day High |
Volume
(% DAV)
(% 50 day avg vol) |
52 Wk Hi
% From Hi |
Featured
Date |
Price
Featured |
Pivot Featured |
|
Max Buy |
TTD
-
NASDAQ
The Trade Desk Inc Cl A
Comml Svcs-Advertising
|
$460.03
|
+14.38
3.23% |
$467.48
|
1,002,756
61.71% of 50 DAV
50 DAV is 1,625,000
|
$510.00
-9.80%
|
6/3/2020
|
$340.61
|
PP = $327.35
|
|
MB = $343.72
|
Most Recent Note - 8/12/2020 6:16:30 PM
G - Hovering near its all-time high. Recently reported Jun '20 quarterly earnings -3% on -13% sales revenues versus the year ago period, raising fundamental concerns. It is extended from any sound base of sufficient length. Its 50 DMA line ($421.28) and prior low ($404 on 7/24/20) define near-term support to watch where violations may trigger technical sell signals. See the latest FSU analysis for more details and a new annotated graph.
>>> FEATURED STOCK ARTICLE : Hovering Near High After Latest Quarterly Report Raised Concerns - 8/12/2020 |
View all notes |
Set NEW NOTE alert |
Company Profile |
SEC
News |
Chart |
Request a new note
C
A
S
I |
DOCU
-
NASDAQ
Docusign Inc
Computer Sftwr-Enterprse
|
$193.30
|
+1.48
0.77% |
$196.88
|
4,575,135
83.93% of 50 DAV
50 DAV is 5,451,000
|
$229.83
-15.89%
|
6/10/2020
|
$149.73
|
PP = $152.10
|
|
MB = $159.71
|
Most Recent Note - 8/11/2020 6:10:52 PM
G - Pulled back today for a 5th consecutive loss while abruptly retreating from its all-time high. Still very extended from any sound base. Its 50 DMA line ($183.71) defines near-term support to watch. DOCU is now priced +74% above its 200 DMA price, and it is taught in the Certification that a stock trading +70-100% or more above the 200 DMA is to be recognized as a "sell signal".
>>> FEATURED STOCK ARTICLE : E-Signature Firm is Extended From Any Sound Base - 7/28/2020 |
View all notes |
Set NEW NOTE alert |
Company Profile |
SEC
News |
Chart |
Request a new note
C
A
S
I |
PING
-
NYSE
Ping Identity Hldg Corp
Computer Sftwr-Security
|
$33.52
|
-0.03
-0.09% |
$34.95
|
1,429,862
111.53% of 50 DAV
50 DAV is 1,282,000
|
$37.80
-11.32%
|
6/1/2020
|
$29.24
|
PP = $29.90
|
|
MB = $31.40
|
Most Recent Note - 8/11/2020 6:04:45 PM
G - Retreated from its all-time high with today's 3rd consecutive loss. Due to report Jun '20 quarterly earnings news after the close on Wednesday, 8/12/20. Its 50 DMA line ($32.52) defines important near-term support above prior highs in the $29 area. It has not formed a sound base of sufficient length. Completed Secondary Offerings on 7/09/20 and 5/15/20. See the latest FSU analysis for more details and an annotated graph.
>>> FEATURED STOCK ARTICLE : Perched Near High With Earnings News Due Wednesday Evening - 8/10/2020 |
View all notes |
Set NEW NOTE alert |
Company Profile |
SEC
News |
Chart |
Request a new note
C
A
S
I |
ZEN
-
NYSE
Zendesk Inc
Computer Sftwr-Enterprse
|
$86.22
|
+0.96
1.13% |
$87.80
|
1,343,124
60.53% of 50 DAV
50 DAV is 2,218,900
|
$101.94
-15.42%
|
7/21/2020
|
$94.29
|
PP = $94.97
|
|
MB = $99.72
|
Most Recent Note - 8/12/2020 6:09:44 PM
It will be dropped from the Featured Stocks list tonight. After slumping further into the prior base its Relative Strength Rating has fallen to 68, well below the 80+ minimum guideline for buy candidates. Violated the 50 DMA line ($88.53) recently triggering a technical sell signal. A rebound above the 50 DMA line is needed for its outlook to improve. Weak action came after it reported Jun '20 quarterly earnings +180% on +27% sales revenues versus the year-ago period.
>>> FEATURED STOCK ARTICLE : Pullback Below Pivot Point Following Breakout Gain - 7/21/2020 |
View all notes |
Set NEW NOTE alert |
Company Profile |
SEC
News |
Chart |
Request a new note
C
A
S
I |
|
|
|
THESE ARE NOT BUY RECOMMENDATIONS!
Comments contained in the body of this report are technical
opinions only. The material herein has been obtained
from sources believed to be reliable and accurate, however,
its accuracy and completeness cannot be guaranteed.
This site is not an investment advisor, hence it does
not endorse or recommend any securities or other investments.
Any recommendation contained in this report may not
be suitable for all investors and it is not to be deemed
an offer or solicitation on our part with respect to
the purchase or sale of any securities. All trademarks,
service marks and trade names appearing in this report
are the property of their respective owners, and are
likewise used for identification purposes only.
This report is a service available
only to active Paid Premium Members.
You may opt-out of receiving report notifications
at any time. Questions or comments may be submitted
by writing to Premium Membership Services 665 S.E. 10 Street, Suite 201 Deerfield Beach, FL 33441-5634 or by calling 1-800-965-8307
or 954-785-1121.
|
|
|