You are not logged in.
This means you
CAN ONLY VIEW reports that were published prior to Monday, February 19, 2024.
You
MUST UPGRADE YOUR MEMBERSHIP if you want to see any current reports.
AFTER MARKET UPDATE - MONDAY, AUGUST 12TH, 2019
Previous After Market Report Next After Market Report >>>
|
|
|
|
DOW |
-389.73 |
25,897.71 |
-1.48% |
|
Volume |
568,533,770 |
-27% |
|
Volume |
2,070,228,010 |
-6% |
|
NASDAQ |
-95.73 |
7,863.41 |
-1.20% |
|
Advancers |
868 |
30% |
|
Advancers |
1,038 |
34% |
|
S&P 500 |
-35.56 |
2,883.09 |
-1.22% |
|
Decliners |
2,020 |
70% |
|
Decliners |
2,038 |
66% |
|
Russell 2000 |
-18.58 |
1,494.46 |
-1.23% |
|
52 Wk Highs |
146 |
|
|
52 Wk Highs |
58 |
|
|
S&P 600 |
-10.13 |
920.62 |
-1.09% |
|
52 Wk Lows |
210 |
|
|
52 Wk Lows |
172 |
|
|
 |
Breadth Negative as Major Indices Sputter
Kenneth J. Gruneisen - Passed the CAN SLIM® Master's Exam
The Dow dropped below the 26,000 level, after falling 391 points. The S&P 500 and the Nasdaq Composite both slipped 1.2%. Volume totals reported were lighter than the prior session totals on the NYSE and on the Nasdaq exchange. Breadth was negative as decliners led advancers by more than a 2-1 margin on the NYSE and nearly 2-1 on the Nasdaq exchange. There were 21 high-ranked companies from the Leaders List hit new 52-week highs and were listed on the BreakOuts Page, versus the total of 40 on the prior session. New 52-week lows outnumbered new 52-week highs on the NYSE and on the Nasdaq exchange. Disciplined investors will watch for a follow-through between Day 4-7 which could signal a new uptrend for the major indices (M criteria). The Featured Stocks Page provides the most timely analysis on high-ranked leaders.Charts used courtesy of www.stockcharts.com
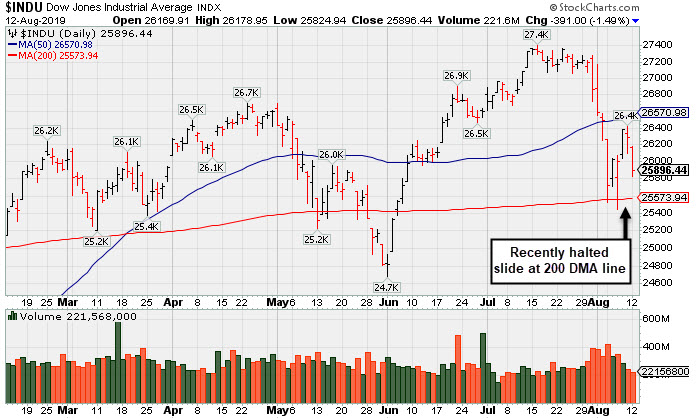
PICTURED: The Dow Jones Industrial Average recently halted its slide at its 200-day moving average (DMA) line.
Stocks declined for the second straight session on Monday as investors assessed geopolitical risks and the impact of the U.S.-China trade war. Treasury yields continued last week’s retreat raising concerns about the condition of the U.S. economy. The yield on the 10-year note slipped ten basis points to 1.63%, while the 30-year bond dropped 11 basis points to 2.14%, marking the lowest level since 2016. Wall Street analysts downgraded the probability that the U.S. and China will be able to reach a trade deal before the 2020 elections. In Hong Kong, political unrest also provided a headwind to equity markets, after protestors shut down a major airport overnight canceling all outbound flights. On the data front, the federal budget deficit widened by $183 billion in July, up 27% from this time last year.
All 11 S&P 500 sectors closed in negative territory with Financials declining nearly 2%. Shares of Bank of America (BAC -2.44%) and Citigroup (C -2.74%). In earnings, Sysco (SYY +3.14%) rose after the food distributor beat analyst earnings expectations. In other corporate news, BlackRock (BLK -2.34%) fell after buying a majority stake in the parent company of Sports Illustrated, Authentic Brands. Tyson Foods (TSN -0.11%) edged lower after a fire partially destroyed a meat-packaging plant in Kansas.
In commodities, WTI crude gained 0.5% to $54.78/barrel. COMEX gold closed up 1.0% to $1,512.20/ounce hitting its highest level in six-years.
|
 Kenneth J. Gruneisen started out as a licensed stockbroker in August 1987, a couple of months prior to the historic stock market crash that took the Dow Jones Industrial Average down -22.6% in a single day. He has published daily fact-based fundamental and technical analysis on high-ranked stocks online for two decades. Through FACTBASEDINVESTING.COM, Kenneth provides educational articles, news, market commentary, and other information regarding proven investment systems that work in good times and bad.
Comments contained in the body of this report are technical opinions only and are not necessarily those of Gruneisen Growth Corp. The material herein has been obtained from sources believed to be reliable and accurate, however, its accuracy and completeness cannot be guaranteed. Our firm, employees, and customers may effect transactions, including transactions contrary to any recommendation herein, or have positions in the securities mentioned herein or options with respect thereto. Any recommendation contained in this report may not be suitable for all investors and it is not to be deemed an offer or solicitation on our part with respect to the purchase or sale of any securities. |
|
 |
Financial, Retail, Tech, and Commodity-Linked Groups Fell
Kenneth J. Gruneisen - Passed the CAN SLIM® Master's Exam
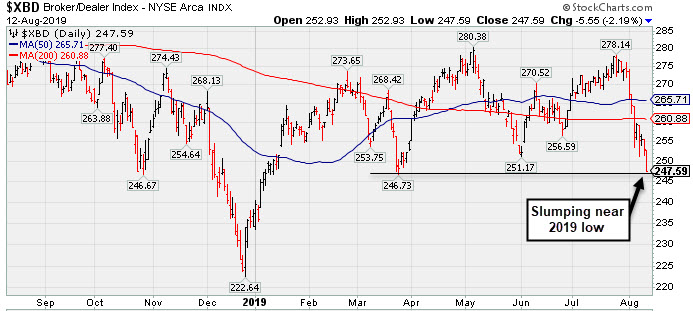
The Broker/Dealer Index ($XBD -2.19%) and the Bank Index ($BKX -2.05%) both outpaced the Retail Index ($RLX -1.32%) to the downside. The tech sector was also weak as the Semiconductor Index ($SOX -1.19%), Biotech Index ($BTK -1.60%), and the Networking Index ($NWX -1.10%) finished with unanimous losses. The Gold & Silver Index ($XAU -0.89%), Integrated Oil Index ($XOI -1.33%) and the Oil Services Index ($OSX -0.66%) each also ended lower.
Charts courtesy of www.stockcharts.com
PICTURED: The Broker/Dealer Index ($XBD -2.19%) slumped near its 2019 low.
| Oil Services |
$OSX |
65.03 |
-0.43 |
-0.66% |
-19.32% |
| Integrated Oil |
$XOI |
1,173.57 |
-15.86 |
-1.33% |
+1.25% |
| Semiconductor |
$SOX |
1,446.98 |
-17.36 |
-1.19% |
+25.26% |
| Networking |
$NWX |
559.15 |
-6.20 |
-1.10% |
+14.42% |
| Broker/Dealer |
$XBD |
247.59 |
-5.55 |
-2.19% |
+4.32% |
| Retail |
$RLX |
2,268.49 |
-31.32 |
-1.36% |
+16.25% |
| Gold & Silver |
$XAU |
94.93 |
-0.85 |
-0.89% |
+34.35% |
| Bank |
$BKX |
92.54 |
-1.94 |
-2.05% |
+7.87% |
| Biotech |
$BTK |
4,526.23 |
-73.37 |
-1.60% |
+7.24% |
|
|
|
 |
Rebounded Above 50-Day Average Following Earnings Report
Kenneth J. Gruneisen - Passed the CAN SLIM® Master's Exam
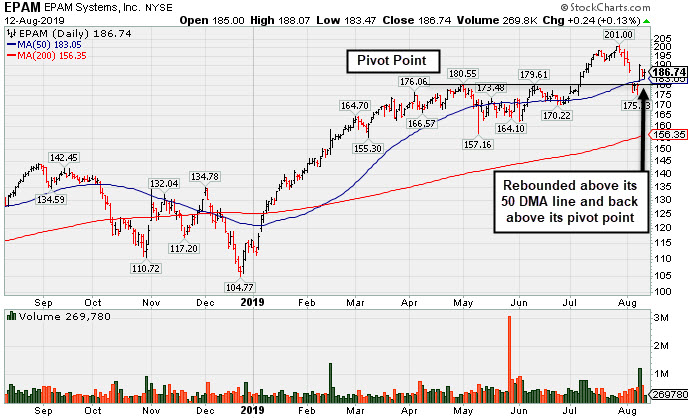
Epam Systems Inc's (EPAM -$0.06 or -0.03% to $186.44) color code was changed to yellow after reporting earnings +27% on +24% sales revenues , continuing its strong earnings track record. A rebound above its 50-day moving average (DMA) line ($183.05) helped its outlook to improve.
Fundamentals remain strong with a 97 Earnings Per Share Rating, well above the 80+ minimum guideline for buy candidates. The Computer - Tech Services firm's annual earnings history (A criteria) has been strong. It was last shown in this FSU section on 7/12/19 with an annotated graph under the headline, "Winning Streak Leaves IT Firm Extended From Prior Base".
The number of top-rated funds owning its shares rose from 462 in Jun '17 to 803 in Jun '19, a reassuring sign concerning the I criteria. Its small supply of only 51.4 million shares (S criteria) in the pubic float can contribute to greater volatility in the event of institutional buying or selling. Its Relative Strength rating of 94 is above the 80+ minimum guideline for buy candidates. Charts courtesy of www.stockcharts.com
|
|
|
Color Codes Explained :
Y - Better candidates highlighted by our
staff of experts.
G - Previously featured
in past reports as yellow but may no longer be buyable under the
guidelines.
***Last / Change / Volume data in this table is the closing quote data***
Symbol/Exchange
Company Name
Industry Group |
PRICE |
CHANGE
(%Change) |
Day High |
Volume
(% DAV)
(% 50 day avg vol) |
52 Wk Hi
% From Hi |
Featured
Date |
Price
Featured |
Pivot Featured |
|
Max Buy |
 SPSC
-
NASDAQ
SPSC
-
NASDAQ
S P S Commerce Inc
COMPUTER SOFTWARE and SERVICES - Application Software
|
$105.16
|
-2.75
-2.55% |
$107.94
|
96,174
72.86% of 50 DAV
50 DAV is 132,000
|
$118.28
-11.09%
|
6/7/2019
|
$107.72
|
PP = $115.10
|
|
MB = $120.86
|
Most Recent Note - 8/8/2019 8:32:11 PM
Y - Found support at its 50 DMA line. Stalled after a gap up and big volume-driven gain noted on 7/26/19. Subsequent gains and a strong close above the pivot point may clinch a convincing new (or add-on) technical buy signal. Reported earnings +22% on +12% sales revenues for the Jun '19 quarter, slightly under the +25% minimum earnings guideline (C criteria), raising fundamental concerns. See the latest FSU analysis for more details and a new annotated graph.
>>> FEATURED STOCK ARTICLE : Found Support at 50-Day Average - 8/8/2019 |
View all notes |
Set NEW NOTE alert |
Company Profile |
SEC
News |
Chart |
Request a new note
C
A
S
I |
EPAM
-
NYSE
Epam Systems Inc
COMPUTER SOFTWARE and SERVICES - Information Technology Service
|
$186.44
|
-0.06
-0.03% |
$188.08
|
271,218
60.40% of 50 DAV
50 DAV is 449,000
|
$201.00
-7.24%
|
5/9/2019
|
$169.25
|
PP = $180.55
|
|
MB = $189.58
|
 Most Recent Note - 8/12/2019 8:14:26 PM
Y - Rebound above its 50 DMA line helped its outlook to improve after it reported earnings +27% on +24% sales revenues for the Jun '19 quarter. See the latest FSU analysis for more details and a new annotated graph.
>>> FEATURED STOCK ARTICLE : Rebounded Above 50-Day Average Following Earnings Report - 8/12/2019 |
View all notes |
Set NEW NOTE alert |
Company Profile |
SEC
News |
Chart |
Request a new note
C
A
S
I |
AUDC
-
NASDAQ
Audiocodes Ltd
ELECTRONICS - Scientific and Technical Instrum
|
$18.01
|
-0.57
-3.07% |
$18.50
|
181,080
104.67% of 50 DAV
50 DAV is 173,000
|
$19.74
-8.76%
|
7/15/2019
|
$17.10
|
PP = $17.54
|
|
MB = $18.42
|
Most Recent Note - 8/12/2019 8:20:02 PM
Y - Consolidating below its "max buy" level. Reported earnings +57% on +14% sales revenues for the Jun '19 quarter, continuing its strong earnings track record. Prior highs in the $17 area define initial support above its 50 DMA line ($16.52).
>>> FEATURED STOCK ARTICLE : Posted a Gain With Average Volume for Best Ever Close - 7/15/2019 |
View all notes |
Set NEW NOTE alert |
Company Profile |
SEC
News |
Chart |
Request a new note
C
A
S
I |
LHCG
-
NASDAQ
L H C Group Inc
HEALTH SERVICES - Home Health Care
|
$117.49
|
-5.34
-4.35% |
$122.75
|
177,479
79.95% of 50 DAV
50 DAV is 222,000
|
$129.37
-9.18%
|
7/1/2019
|
$110.94
|
PP = $122.20
|
|
MB = $128.31
|
Most Recent Note - 8/12/2019 8:18:42 PM
G - Color code is changed to green after slumping below its 50 DMA line ($120) today raising concerns. Reported earnings +27% on +3% sales revenues for the Jun '19 quarter. Prior quarterly comparisons showed much stronger sales revenues growth. Recent gains above its pivot point were not backed by the +40% above average volume needed to trigger a proper new (or add-on) technical buy signal.
>>> FEATURED STOCK ARTICLE : Consolidating Following a Negative Reversal at High - 7/22/2019 |
View all notes |
Set NEW NOTE alert |
Company Profile |
SEC
News |
Chart |
Request a new note
C
A
S
I |
CHDN
-
NASDAQ
Churchill Downs Inc
LEISURE - Gaming Activities
|
$118.44
|
-2.58
-2.13% |
$120.00
|
119,429
43.75% of 50 DAV
50 DAV is 273,000
|
$132.73
-10.77%
|
7/22/2019
|
$118.45
|
PP = $118.89
|
|
MB = $124.83
|
Most Recent Note - 8/6/2019 8:57:41 PM
Y - Found support above its 50 DMA line ($114) with a gain on lighter volume. Reported Jun '19 earnings rose +10% on +26% sales revenues versus the year ago period, below the +25% minimum earnings guideline (C criteria). The prior low ($108.57 on 6/25/19) defines the next important near-term support to watch below its 50 DMA line.
>>> FEATURED STOCK ARTICLE : Volume Light While Hovering at Record High - 7/16/2019 |
View all notes |
Set NEW NOTE alert |
Company Profile |
SEC
News |
Chart |
Request a new note
C
A
S
I |
Symbol/Exchange
Company Name
Industry Group |
PRICE |
CHANGE
(%Change) |
Day High |
Volume
(% DAV)
(% 50 day avg vol) |
52 Wk Hi
% From Hi |
Featured
Date |
Price
Featured |
Pivot Featured |
|
Max Buy |
LULU
-
NASDAQ
Lululemon Athletica
MANUFACTURING - Textile Manufacturing
|
$178.82
|
-4.00
-2.19% |
$182.05
|
965,449
47.28% of 50 DAV
50 DAV is 2,042,000
|
$194.25
-7.94%
|
6/13/2019
|
$174.48
|
PP = $179.60
|
|
MB = $188.58
|
Most Recent Note - 8/8/2019 10:53:10 AM
Y - Color code is changed to yellow after rebounding above its 50 DMA line ($181.65) helping its technical stance improve. Reported Apr '19 quarterly earnings +35% on +20% sales revenues versus the year ago period.
>>> FEATURED STOCK ARTICLE : Quietly Hovering at All-Time High - 7/17/2019 |
View all notes |
Set NEW NOTE alert |
Company Profile |
SEC
News |
Chart |
Request a new note
C
A
S
I |
ULTA
-
NASDAQ
Ulta Beauty Inc
SPECIALTY RETAIL - Specialty Retail, Other
|
$336.51
|
-10.19
-2.94% |
$345.91
|
759,225
105.30% of 50 DAV
50 DAV is 721,000
|
$368.83
-8.76%
|
3/15/2019
|
$341.27
|
PP = $322.59
|
|
MB = $338.72
|
Most Recent Note - 8/7/2019 6:54:44 PM
G - Still sputtering below its 50 DMA line ($346.55). Volume totals have been near average while still hovering near its all-time high. Reported earnings +17% on +13% sales revenues for the Apr '19 quarter, below the +25% minimum earnings guideline (C criteria), raising fundamental concerns. See the latest FSU analysis for more details and a new annotated graph.
>>> FEATURED STOCK ARTICLE : Ulta Beauty Sputtering Below 50-Day Moving Average - 8/7/2019 |
View all notes |
Set NEW NOTE alert |
Company Profile |
SEC
News |
Chart |
Request a new note
C
A
S
I |
CHGG
-
NYSE
Chegg Inc
Consumer Svcs-Education
|
$41.48
|
-2.20
-5.04% |
$43.45
|
1,910,741
128.07% of 50 DAV
50 DAV is 1,492,000
|
$48.22
-13.98%
|
7/8/2019
|
$44.11
|
PP = $41.79
|
|
MB = $43.88
|
Most Recent Note - 8/12/2019 8:17:02 PM
Y - Slumped today with higher volume testing prior highs in the $40-41 area which define important near-term support along with its 50 DMA line ($41.36). More damaging losses would raise concerns and trigger a technical sell signal. Reported earnings +92% on +26% sales revenues for the Jun '19 quarter.
>>> FEATURED STOCK ARTICLE : Consolidating Above Prior Highs and 50-Day Average - 8/6/2019 |
View all notes |
Set NEW NOTE alert |
Company Profile |
SEC
News |
Chart |
Request a new note
C
A
S
I |
VEEV
-
NYSE
Veeva Systems Inc Cl A
Computer Sftwr-Medical
|
$160.00
|
-2.16
-1.33% |
$161.59
|
632,160
41.59% of 50 DAV
50 DAV is 1,520,000
|
$176.90
-9.55%
|
5/30/2019
|
$154.32
|
PP = $145.80
|
|
MB = $153.09
|
Most Recent Note - 8/12/2019 8:25:07 PM
G - Still sputtering below its 50 DMA line ($165.25) which acted as resistance after volume-driven losses. A rebounded above the 50 DMA line is needed for its outlook to improve. Fundamentals remain strong.
>>> FEATURED STOCK ARTICLE : Recently Found Support Near 50-Day Moving Average - 8/1/2019 |
View all notes |
Set NEW NOTE alert |
Company Profile |
SEC
News |
Chart |
Request a new note
C
A
S
I |
PAYC
-
NYSE
Paycom Software Inc
COMPUTER SOFTWARE and SERVICES - Application Software
|
$239.10
|
-1.52
-0.63% |
$242.35
|
248,771
36.21% of 50 DAV
50 DAV is 687,000
|
$246.85
-3.14%
|
2/6/2019
|
$171.66
|
PP = $164.18
|
|
MB = $172.39
|
Most Recent Note - 8/12/2019 8:22:07 PM
G - Found prompt support near its 50 DMA line while building a new flat base. Reported earnings +27% on +31% sales revenues for the Jun '19 quarter, continuing its strong earnings track record.
>>> FEATURED STOCK ARTICLE : Found Support and Gapped Up Following Earnings Report - 8/2/2019 |
View all notes |
Set NEW NOTE alert |
Company Profile |
SEC
News |
Chart |
Request a new note
C
A
S
I |
Symbol/Exchange
Company Name
Industry Group |
PRICE |
CHANGE
(%Change) |
Day High |
Volume
(% DAV)
(% 50 day avg vol) |
52 Wk Hi
% From Hi |
Featured
Date |
Price
Featured |
Pivot Featured |
|
Max Buy |
PLNT
-
NYSE
Planet Fitness Inc Cl A
Leisure-Services
|
$71.63
|
-2.14
-2.90% |
$73.49
|
773,472
49.33% of 50 DAV
50 DAV is 1,568,000
|
$81.90
-12.54%
|
7/26/2019
|
$79.15
|
PP = $82.00
|
|
MB = $86.10
|
Most Recent Note - 8/7/2019 12:36:46 PM
G - Color code is changed to green after it gapped down today slumping well below its 50 DMA line ($76.70) with today's big volume-driven loss raising concerns. Reported earnings +32% on +29% sales revenues for the Jun '19 quarter continuing its strong earnings track record.
>>> FEATURED STOCK ARTICLE : Fitness Firm Forming a New Base - 7/26/2019 |
View all notes |
Set NEW NOTE alert |
Company Profile |
SEC
News |
Chart |
Request a new note
C
A
S
I |
BLD
-
NYSE
Topbuild Corp
Bldg-Constr Prds/Misc
|
$89.39
|
-0.53
-0.59% |
$90.82
|
132,065
40.64% of 50 DAV
50 DAV is 325,000
|
$92.07
-2.91%
|
5/17/2019
|
$82.19
|
PP = $87.31
|
|
MB = $91.68
|
Most Recent Note - 8/7/2019 7:00:45 PM
Y - Posted a gain with average volume today for a best-ever close, perched at its all-time high. Bullish action came after it reported earnings +39% on +9% sales revenues for the Jun '19 quarter versus the year ago period, continuing its strong earnings track record. Its gain above the pivot point on 8/02/19 was backed by +81% above average volume clinching a convincing technical buy signal. Its 50 DMA line ($81.43) and recent lows define near-term support to watch on pullbacks.
>>> FEATURED STOCK ARTICLE : Perched Near 52-Week High Finding Support - 7/25/2019 |
View all notes |
Set NEW NOTE alert |
Company Profile |
SEC
News |
Chart |
Request a new note
C
A
S
I |
TEAM
-
NASDAQ
Atlassian Corp Plc Cl A
Comp Sftwr-Spec Enterprs
|
$143.68
|
-2.31
-1.58% |
$145.28
|
692,057
52.15% of 50 DAV
50 DAV is 1,327,000
|
$149.80
-4.09%
|
5/24/2019
|
$129.52
|
PP = $132.09
|
|
MB = $138.69
|
Most Recent Note - 8/7/2019 6:56:15 PM
Y - Posted a gain with above average volume, finding support above its 50 DMA line ($133.45). Its prior low ($123.43 on 6/25/19) defines important near-term support to watch where a violation would raise serious concerns and trigger a more worrisome technical sell signal. Reported earnings +43% on +36% sales revenues for the Jun '19 quarter, continuing its strong earnings track record.
>>> FEATURED STOCK ARTICLE : Abrupt Retreat After Getting Very Extended From Prior Base - 7/29/2019 |
View all notes |
Set NEW NOTE alert |
Company Profile |
SEC
News |
Chart |
Request a new note
C
A
S
I |
GLOB
-
NYSE
Globant SA
Computer-Tech Services
|
$103.46
|
-3.89
-3.62% |
$105.00
|
633,415
199.82% of 50 DAV
50 DAV is 317,000
|
$112.33
-7.90%
|
2/15/2019
|
$69.35
|
PP = $70.00
|
|
MB = $73.50
|
Most Recent Note - 8/12/2019 1:07:28 PM
G - Gapped down and undercut its 50 DMA line ($102.94). It has not formed a sound new base of sufficient length. Due to report earnings news on 8/15/19. See the latest FSU analysis for more details and an annotated graph.
>>> FEATURED STOCK ARTICLE : Consolidating Above 50-Day Average With Earnings News Soon - 8/9/2019 |
View all notes |
Set NEW NOTE alert |
Company Profile |
SEC
News |
Chart |
Request a new note
C
A
S
I |
TTD
-
NASDAQ
The Trade Desk Inc Cl A
Comml Svcs-Advertising
|
$255.08
|
-16.86
-6.20% |
$271.84
|
2,198,248
145.19% of 50 DAV
50 DAV is 1,514,000
|
$289.51
-11.89%
|
7/18/2019
|
$240.61
|
PP = $258.10
|
|
MB = $271.01
|
Most Recent Note - 8/12/2019 1:18:08 PM
Y - Color code is changed to yellow while consolidating below its "max buy" level. Its 50 DMA line ($245) defines support. Reported Jun '19 quarterly earnings +58% on +42% sales revenues.
>>> FEATURED STOCK ARTICLE : Endured Distributional Pressure While Building on New Base - 7/18/2019 |
View all notes |
Set NEW NOTE alert |
Company Profile |
SEC
News |
Chart |
Request a new note
C
A
S
I |
Symbol/Exchange
Company Name
Industry Group |
PRICE |
CHANGE
(%Change) |
Day High |
Volume
(% DAV)
(% 50 day avg vol) |
52 Wk Hi
% From Hi |
Featured
Date |
Price
Featured |
Pivot Featured |
|
Max Buy |
PAGS
-
NYSE
Pagseguro Digital Cl A
Finance-CrdtCard/PmtPr
|
$44.84
|
-1.11
-2.42% |
$44.96
|
1,158,167
51.38% of 50 DAV
50 DAV is 2,254,000
|
$48.88
-8.27%
|
6/25/2019
|
$37.69
|
PP = $40.07
|
|
MB = $42.07
|
Most Recent Note - 8/6/2019 8:54:36 PM
G - Posted a gain today with light volume. Prior high in the $40 area defines initial support to watch along with its 50 DMA line ($39.95).
>>> FEATURED STOCK ARTICLE : Encountering Distributional Pressure After Impressive Sprint - 7/30/2019 |
View all notes |
Set NEW NOTE alert |
Company Profile |
SEC
News |
Chart |
Request a new note
C
A
S
I |
|
|
|
THESE ARE NOT BUY RECOMMENDATIONS!
Comments contained in the body of this report are technical
opinions only. The material herein has been obtained
from sources believed to be reliable and accurate, however,
its accuracy and completeness cannot be guaranteed.
This site is not an investment advisor, hence it does
not endorse or recommend any securities or other investments.
Any recommendation contained in this report may not
be suitable for all investors and it is not to be deemed
an offer or solicitation on our part with respect to
the purchase or sale of any securities. All trademarks,
service marks and trade names appearing in this report
are the property of their respective owners, and are
likewise used for identification purposes only.
This report is a service available
only to active Paid Premium Members.
You may opt-out of receiving report notifications
at any time. Questions or comments may be submitted
by writing to Premium Membership Services 665 S.E. 10 Street, Suite 201 Deerfield Beach, FL 33441-5634 or by calling 1-800-965-8307
or 954-785-1121.
|
|
|