You are not logged in.
This means you
CAN ONLY VIEW reports that were published prior to Sunday, February 18, 2024.
You
MUST UPGRADE YOUR MEMBERSHIP if you want to see any current reports.
AFTER MARKET UPDATE - TUESDAY, AUGUST 11TH, 2020
Previous After Market Report Next After Market Report >>>
|
|
|
|
DOW |
-104.53 |
27,686.91 |
-0.38% |
|
Volume |
956,031,253 |
+11% |
|
Volume |
4,279,200,500 |
+7% |
|
NASDAQ |
-185.27 |
10,783.09 |
-1.69% |
|
Advancers |
1,473 |
50% |
|
Advancers |
1,273 |
40% |
|
S&P 500 |
-26.78 |
3,333.69 |
-0.80% |
|
Decliners |
1,467 |
50% |
|
Decliners |
1,894 |
60% |
|
Russell 2000 |
-9.57 |
1,575.10 |
-0.60% |
|
52 Wk Highs |
118 |
|
|
52 Wk Highs |
116 |
|
|
S&P 600 |
-0.70 |
919.79 |
-0.08% |
|
52 Wk Lows |
3 |
|
|
52 Wk Lows |
10 |
|
|
 |
Major Indices Reversed into Red as Volume Totals Rose
Kenneth J. Gruneisen - Passed the CAN SLIM® Master's Exam
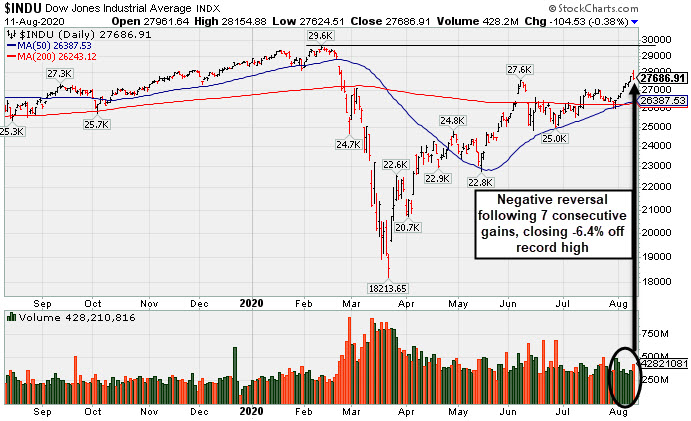
The S&P 500 reversed direction, ending the day down 0.8%. The Dow shed 104 points, while the Nasdaq Composite extended its decline to 1.7%. The reported volume totals were higher than the prior session on the NYSE and on the Nasdaq exchange, indicating an increase in institutional selling pressure. Advancers and decliners were evenly matched on the NYSE while decliners led advancers by a 3-2 margin on the Nasdaq exchange. There were 59 high-ranked companies from the Leaders List that hit new 52-week highs and were listed on the BreakOuts Page, versus the total of 72 on the prior session. New 52-week highs totals contracted yet still outnumbered new 52-week lows totals again on both the NYSE and the Nasdaq exchange. The major indices are in a confirmed uptrend (M criteria). Any sustainable rally requires a healthy crop of new leaders, so it remains ever-important to see substantial new highs totals. Charts used courtesy of www.stockcharts.com
PICTURED: The Dow Jones Industrial Average had a "negative reversal" for a loss on higher volume, breaking a streak of 7 consecutive gains. It ended -6.4% off its record high. Stocks finished lower on Tuesday, with all three major U.S. equity benchmarks sliding into negative territory during the final hour of trading. Weakness came after Senate Majority Leader McConnell stated that fiscal stimulus talks had reached a stalemate. The benchmark index had come within 0.5% of hitting a new all-time high earlier in the session on reports that lawmakers were willing to restart negotiations. Rumors that Russia had granted regulatory approval to a coronavirus vaccine had also provided a tailwind to risk assets during the morning.
Nine of 11 S&P 500 sectors closed in negative territory, with investors seemingly rotating away from Tech and growth-related shares and into more value-oriented sectors. Financials outperformed as Treasury yields jumped the most since June. The yield on the 10-year note climbed as high as 0.65% before ending the day up five basis points to 0.63% as investors anticipated this week’s record $112 billion of government debt issuance.
On the data front, an update on inflation revealed producer prices rose 0.6% last month, rebounding from June’s 0.2% drop and marking the largest gain since October 2018. A slump in Treasuries weighed on COMEX gold. The yellow metal fell 5.3% to $1,917.10/ounce, its worst one-day percentage decline since 2013. Also in the commodity space, WTI crude slipped 1% to $41.52/barrel, reversing an early session gain as a gauge of the U.S. dollar ended higher.
|
 Kenneth J. Gruneisen started out as a licensed stockbroker in August 1987, a couple of months prior to the historic stock market crash that took the Dow Jones Industrial Average down -22.6% in a single day. He has published daily fact-based fundamental and technical analysis on high-ranked stocks online for two decades. Through FACTBASEDINVESTING.COM, Kenneth provides educational articles, news, market commentary, and other information regarding proven investment systems that work in good times and bad.
Comments contained in the body of this report are technical opinions only and are not necessarily those of Gruneisen Growth Corp. The material herein has been obtained from sources believed to be reliable and accurate, however, its accuracy and completeness cannot be guaranteed. Our firm, employees, and customers may effect transactions, including transactions contrary to any recommendation herein, or have positions in the securities mentioned herein or options with respect thereto. Any recommendation contained in this report may not be suitable for all investors and it is not to be deemed an offer or solicitation on our part with respect to the purchase or sale of any securities. |
|
 |
Financial Indexes Rose; Gold & Silver Index Fell Considerably
Kenneth J. Gruneisen - Passed the CAN SLIM® Master's Exam
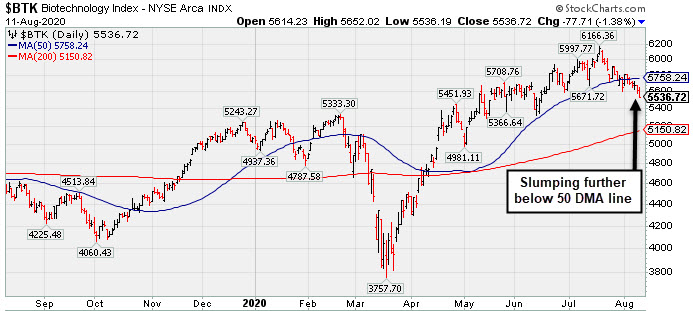
The Bank Index ($BKX +2.31%) and Broker/Dealer Index ($XBD +1.49%) were standout gainers on Tuesday. The Oil Services Index ($OSX +1.03%) posted a gain while the Integrated Oil Index ($XOI -0.53%) edged lower. The Retail Index ($RLX -1.16%) lost ground and the tech sector had a negative bias as the Biotech Index ($BTK -1.38%) and Semiconductor Index ($SOX -1.11%) both outpaced the Networking Index ($NWX -0.14%) to the downside. The Gold & Silver Index ($XAU -7.55%) was a standout decliner.PICTURED: The Biotech Index ($BTK -1.38%) is slumping further below its 50-day moving average (DMA) line.
| Oil Services |
$OSX |
40.07 |
+0.41 |
+1.03% |
-48.82% |
| Integrated Oil |
$XOI |
775.15 |
-4.15 |
-0.53% |
-38.99% |
| Semiconductor |
$SOX |
2,155.37 |
-24.23 |
-1.11% |
+16.53% |
| Networking |
$NWX |
614.41 |
-0.87 |
-0.14% |
+5.31% |
| Broker/Dealer |
$XBD |
293.54 |
+4.32 |
+1.49% |
+1.09% |
| Retail |
$RLX |
3,328.92 |
-39.02 |
-1.16% |
+35.91% |
| Gold & Silver |
$XAU |
141.47 |
-11.56 |
-7.55% |
+32.31% |
| Bank |
$BKX |
80.05 |
+1.81 |
+2.31% |
-29.38% |
| Biotech |
$BTK |
5,536.72 |
-77.71 |
-1.38% |
+9.26% |
|
|
|
 |
Below 50-Day Average After Slumping into Prior Base
Kenneth J. Gruneisen - Passed the CAN SLIM® Master's Exam
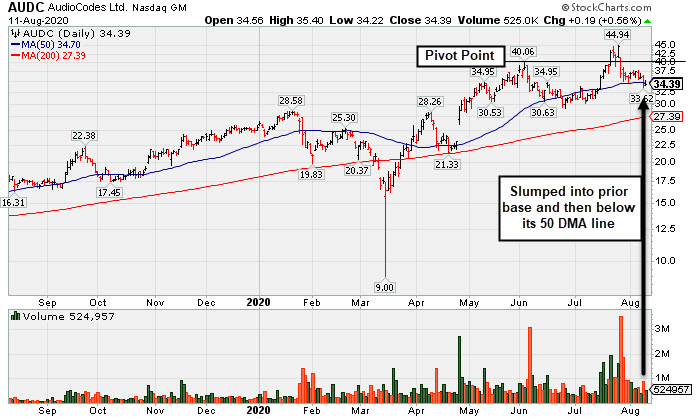
Audiocodes Ltd (AUDC +$0.19 or +0.56% to $34.39) closed below its 50-day moving average (DMA) line ($34.70) again today following a damaging loss on the prior session. Weak action raised concerns and triggered a worrisome technical sell signal. It will be dropped from the Featured Stocks list tonight. Only a prompt rebound above the 50 DMA line would help its outlook improve. Disciplined investors always limit losses by selling any stock that falls more than 7-8% from their purchase price.
Weakness came after AUDC reported Jun '20 quarterly earnings +45% on +8% sales revenues versus the year-ago period. However, it now has a strong earnings track record of 14 consecutive quarterly comparisons above the +25% minimum guideline (C criteria). Annual earnings growth has been strong and it has a 99 Earnings Per Share Rating.
AUDC was highlighted in yellow in the 7/17/20 mid-day report (read here) with new pivot point cited based on its 6/03/20 high plus 10 cents. This Israel-based designer of advanced voice-over-IP products was last shown in this FSU section on 7/17/20 with an annotated graph under the headline, "Resilient and High-Ranked VOIP Firm Rebounding Near Highs".Its current Up/Down Volume Ratio of 0.8 is an unbiased indication its shares have been under slight distributional pressure over the past 50 days.
AUDC completed a new Public Offering on 6/08/20. Such offerings often hinder upward price progress for a brief period, yet they typically help companies attract greater ownership interest from the institutional crowd. The number of top-rated funds owning its shares rose from 33 in Mar '18 to 102 in Jun '20, a reassuring sign concerning the I criteria. It has a Timeliness Rating of C and Sponsorship Rating of B. The small supply of 29.5 million shares (S criteria) outstanding can contribute to greater price volatility in the event of institutional buying or selling.
Charts courtesy of www.stockcharts.com
 |
|
|
Color Codes Explained :
Y - Better candidates highlighted by our
staff of experts.
G - Previously featured
in past reports as yellow but may no longer be buyable under the
guidelines.
***Last / Change / Volume data in this table is the closing quote data***
Symbol/Exchange
Company Name
Industry Group |
PRICE |
CHANGE
(%Change) |
Day High |
Volume
(% DAV)
(% 50 day avg vol) |
52 Wk Hi
% From Hi |
Featured
Date |
Price
Featured |
Pivot Featured |
|
Max Buy |
 FTNT
-
NASDAQ
FTNT
-
NASDAQ
Fortinet Inc
Computer Sftwr-Security
|
$126.59
|
-0.29
-0.23% |
$128.17
|
2,166,278
135.54% of 50 DAV
50 DAV is 1,598,300
|
$151.95
-16.69%
|
6/22/2020
|
$142.68
|
PP = $149.79
|
|
MB = $157.28
|
Most Recent Note - 8/7/2020 12:47:28 PM
G - Color code is changed to green after it gapped down today, violating its 50 DMA line ($137), following its Jun '20 quarterly report of earnings +41% on +18% sales revenues versus the year ago period. Prior low ($124.24 on 7/15/20) defines the next important support level to watch. Faces resistance due to overhead supply up to the $151 level which may hinder upward price progress.
>>> FEATURED STOCK ARTICLE : Rebounded Above 50-Day Average; Earnings News Due on - 8/3/2020 |
View all notes |
Set NEW NOTE alert |
Company Profile |
SEC
News |
Chart |
Request a new note
C
A
S
I |
CRL
-
NYSE
Charles River Labs Intl
DRUGS - Biotechnology
|
$210.24
|
-8.52
-3.89% |
$220.62
|
594,099
150.40% of 50 DAV
50 DAV is 395,000
|
$221.97
-5.28%
|
7/15/2020
|
$192.66
|
PP = $189.95
|
|
MB = $199.45
|
 Most Recent Note - 8/11/2020 6:07:50 PM
G - Volume was +50% above average behind today's big loss while retreating from its all-time high. Bullish action last week came after it reported Jun '20 quarterly earnings -3% on +4% sales revenues, below the +25% minimum guideline (C criteria) but better than expected while the company also raised its guidance. The prior high ($189.85 on 6/03/20) defines initial support to watch above its 50 DMA line ($188.67).
>>> FEATURED STOCK ARTICLE : Hit New Highs Again; EPS Rating Dropped Yet Remains High at 92 - 8/7/2020 |
View all notes |
Set NEW NOTE alert |
Company Profile |
SEC
News |
Chart |
Request a new note
C
A
S
I |
EBS
-
NYSE
Emergent Biosolutions
DRUGS - Biotechnology
|
$122.33
|
-7.86
-6.04% |
$128.91
|
1,250,502
120.82% of 50 DAV
50 DAV is 1,035,000
|
$137.61
-11.10%
|
7/7/2020
|
$89.47
|
PP = $93.68
|
|
MB = $98.36
|
Most Recent Note - 8/11/2020 6:00:45 PM
G - Retreating from its all-time high with today's 3rd loss in the span of 4 sessions after getting very extended from any sound base. Bullish action came after it reported Jun '20 quarterly earnings +890% on +62% sales revenue for the Jun '20 quarter versus the year ago period. Prior highs in the $93 area define initial support above its 50 DMA line ($90.63).
>>> FEATURED STOCK ARTICLE : Rally Continues Into Record High Territory - 8/4/2020 |
View all notes |
Set NEW NOTE alert |
Company Profile |
SEC
News |
Chart |
Request a new note
C
A
S
I |
BMRN
-
NASDAQ
Biomarin Pharmaceutical
DRUGS - Drug Manufacturers - Other
|
$116.83
|
-1.42
-1.20% |
$118.82
|
980,204
72.82% of 50 DAV
50 DAV is 1,346,000
|
$131.95
-11.46%
|
6/17/2020
|
$110.95
|
PP = $112.67
|
|
MB = $118.30
|
Most Recent Note - 8/10/2020 6:13:38 PM
G - Slumped below its 50 DMA line ($119.52) with a streak of 3 consecutive losses backed by light volume. A prompt rebound above the 50 DMA line is needed for its outlook to improve. Sputtering since it recently reported Jun '20 quarterly earnings +220% on +11% sales revenues versus the year ago period, continuing its strong earnings track record.
>>> FEATURED STOCK ARTICLE : Hovering Above 50-Day Average After Another Strong Earnings Report - 8/5/2020 |
View all notes |
Set NEW NOTE alert |
Company Profile |
SEC
News |
Chart |
Request a new note
C
A
S
I |
AUDC
-
NASDAQ
Audiocodes Ltd
ELECTRONICS - Scientific and Technical Instrum
|
$34.39
|
+0.19
0.56% |
$35.40
|
524,957
62.49% of 50 DAV
50 DAV is 840,000
|
$44.94
-23.48%
|
7/17/2020
|
$37.16
|
PP = $40.16
|
|
MB = $42.17
|
Most Recent Note - 8/11/2020 5:55:31 PM
Finished weak after an early gain today and it will be dropped from the Featured Stocks list tonight. It violated its 50 DMA line ($34.70) on the prior session raising greater concerns and triggering a worrisome technical sell signal. Only a prompt rebound above the 50 DMA line would help its outlook improve. Disciplined investors always limit losses by selling any stock that falls more than 7-8% from their purchase price. See the latest FSU analysis for more details and a new annotated graph.
>>> FEATURED STOCK ARTICLE : Below 50-Day Average After Slumping into Prior Base - 8/11/2020 |
View all notes |
Set NEW NOTE alert |
Company Profile |
SEC
News |
Chart |
Request a new note
C
A
S
I |
Symbol/Exchange
Company Name
Industry Group |
PRICE |
CHANGE
(%Change) |
Day High |
Volume
(% DAV)
(% 50 day avg vol) |
52 Wk Hi
% From Hi |
Featured
Date |
Price
Featured |
Pivot Featured |
|
Max Buy |
AMD
-
NASDAQ
Advanced Micro Devices
ELECTRONICS - Semiconductor - Broad Line
|
$76.88
|
-5.36
-6.52% |
$80.71
|
77,526,826
121.38% of 50 DAV
50 DAV is 63,871,000
|
$87.29
-11.93%
|
7/22/2020
|
$61.73
|
PP = $59.10
|
|
MB = $62.06
|
Most Recent Note - 8/11/2020 5:58:20 PM
G - Retreated further from its all-time high today with a big 3rd consecutive loss on +21% above average volume. Reported earnings +125% on +26% sales revenues for the Jun '20 quarter versus the year ago period. It is still very extended from the previously noted base. Its 50 DMA line ($60.54) and prior highs in the $59 area define important support to watch on pullbacks.
>>> FEATURED STOCK ARTICLE : Pullback After Breakout Gain Backed by +152% Above Average Volume - 7/23/2020 |
View all notes |
Set NEW NOTE alert |
Company Profile |
SEC
News |
Chart |
Request a new note
C
A
S
I |
TREX
-
NYSE
Trex Company Inc
MATERIALS and CONSTRUCTION - General Building Materials
|
$135.56
|
-1.52
-1.11% |
$138.98
|
442,019
48.05% of 50 DAV
50 DAV is 920,000
|
$144.96
-6.48%
|
6/26/2020
|
$109.05
|
PP = $132.94
|
|
MB = $139.59
|
Most Recent Note - 8/10/2020 6:17:17 PM
Y - Hovering near its all-time high, and its color code is changed to yellow after pulling back below its "max buy" level with a loss on light volume. Reported Jun '20 quarterly earnings +27% on +7% sales revenues versus the year ago period. Important near-term support is at its 50 DMA line ($128).
>>> FEATURED STOCK ARTICLE : Perched Near All Time High With Earnings News Due Monday - 7/30/2020 |
View all notes |
Set NEW NOTE alert |
Company Profile |
SEC
News |
Chart |
Request a new note
C
A
S
I |
NFLX
-
NASDAQ
Netflix Inc
SPECIALTY RETAIL - Music and Video Stores
|
$466.93
|
-16.45
-3.40% |
$480.92
|
7,296,016
96.10% of 50 DAV
50 DAV is 7,592,000
|
$575.37
-18.85%
|
5/14/2020
|
$441.95
|
PP = $449.62
|
|
MB = $472.10
|
Most Recent Note - 8/11/2020 6:13:13 PM
G - Technically, it violated the 50 DMA line ($473.65) and undercut the prior low ($467.54) with today's loss on average volume raising concerns. Only a prompt rebound above the 50 DMA line would help its outlook improve. Fundamentals remain strong.
>>> FEATURED STOCK ARTICLE : Consolidating After Getting Extended From Prior Base - 7/29/2020 |
View all notes |
Set NEW NOTE alert |
Company Profile |
SEC
News |
Chart |
Request a new note
C
A
S
I |
CHGG
-
NYSE
Chegg Inc
Consumer Svcs-Education
|
$76.96
|
-4.57
-5.61% |
$80.15
|
4,317,654
119.07% of 50 DAV
50 DAV is 3,626,000
|
$89.82
-14.32%
|
6/17/2020
|
$63.71
|
PP = $68.08
|
|
MB = $71.48
|
Most Recent Note - 8/11/2020 5:59:16 PM
G - Retreated abruptly from its all-time high with today's 2nd consecutive big loss after getting very extended from any sound base. Reported Jun '20 quarterly earnings +61% on +63% sales revenues versus the year ago period. Its 50 DMA line ($70.19) defines support to watch above its prior high in the $68 area. Any losses leading to violations would raise concerns and trigger technical sell signals.
>>> FEATURED STOCK ARTICLE : Bullish Action Continued After Latest Strong Earnings Report - 8/6/2020 |
View all notes |
Set NEW NOTE alert |
Company Profile |
SEC
News |
Chart |
Request a new note
C
A
S
I |
LGIH
-
NASDAQ
L G I Homes Inc
Bldg-Resident/Comml
|
$104.97
|
-5.18
-4.70% |
$110.67
|
470,704
138.85% of 50 DAV
50 DAV is 339,000
|
$123.94
-15.31%
|
7/7/2020
|
$99.19
|
PP = $95.82
|
|
MB = $100.61
|
Most Recent Note - 8/11/2020 6:02:06 PM
G - Pulled back today for a big loss marked by above average volume. It is still extended from the previously noted base. Its 50 DMA line ($99.54) defines near-term support to watch above prior highs in the $95 area.
>>> FEATURED STOCK ARTICLE : Earning News Due Next Week for Homebuilder - 7/31/2020 |
View all notes |
Set NEW NOTE alert |
Company Profile |
SEC
News |
Chart |
Request a new note
C
A
S
I |
Symbol/Exchange
Company Name
Industry Group |
PRICE |
CHANGE
(%Change) |
Day High |
Volume
(% DAV)
(% 50 day avg vol) |
52 Wk Hi
% From Hi |
Featured
Date |
Price
Featured |
Pivot Featured |
|
Max Buy |
NOW
-
NYSE
Servicenow Inc
Computer Sftwr-Enterprse
|
$421.36
|
-17.32
-3.95% |
$434.99
|
1,636,064
95.45% of 50 DAV
50 DAV is 1,714,000
|
$454.70
-7.33%
|
4/30/2020
|
$343.05
|
PP = $363.05
|
|
MB = $381.20
|
Most Recent Note - 8/11/2020 6:03:31 PM
G - Slumped toward its 50 DMA line ($413.78) which defines important near-term support to watch. Subsequent losses leading to a violation may trigger a technical sell signal. Reported Jun '20 quarterly earnings +73% on +28% sales revenues versus the year ago period.
>>> FEATURED STOCK ARTICLE : Perched Near All-Time High With Earnings News Due Next Week - 7/22/2020 |
View all notes |
Set NEW NOTE alert |
Company Profile |
SEC
News |
Chart |
Request a new note
C
A
S
I |
TTD
-
NASDAQ
The Trade Desk Inc Cl A
Comml Svcs-Advertising
|
$445.65
|
-20.08
-4.31% |
$463.39
|
1,708,507
105.99% of 50 DAV
50 DAV is 1,612,000
|
$510.00
-12.62%
|
6/3/2020
|
$340.61
|
PP = $327.35
|
|
MB = $343.72
|
Most Recent Note - 8/11/2020 6:06:11 PM
G - Retreating from its all-time high, it suffered a 3rd loss in the span of 4 sessions. Weak action came after it reported Jun '20 quarterly earnings -3% on -13% sales revenues versus the year ago period. It is extended from any sound base of sufficient length. Its 50 DMA line ($418.45) and prior low ($404 on 7/24/20) define near-term support to watch where violations may trigger technical sell signals.
>>> FEATURED STOCK ARTICLE : Rebounded Near All-Time High With Gain Backed by Light Volume - 7/20/2020 |
View all notes |
Set NEW NOTE alert |
Company Profile |
SEC
News |
Chart |
Request a new note
C
A
S
I |
DOCU
-
NASDAQ
Docusign Inc
Computer Sftwr-Enterprse
|
$191.82
|
-6.56
-3.31% |
$199.84
|
4,469,665
81.30% of 50 DAV
50 DAV is 5,498,000
|
$229.83
-16.54%
|
6/10/2020
|
$149.73
|
PP = $152.10
|
|
MB = $159.71
|
Most Recent Note - 8/11/2020 6:10:52 PM
G - Pulled back today for a 5th consecutive loss while abruptly retreating from its all-time high. Still very extended from any sound base. Its 50 DMA line ($183.71) defines near-term support to watch. DOCU is now priced +74% above its 200 DMA price, and it is taught in the Certification that a stock trading +70-100% or more above the 200 DMA is to be recognized as a "sell signal".
>>> FEATURED STOCK ARTICLE : E-Signature Firm is Extended From Any Sound Base - 7/28/2020 |
View all notes |
Set NEW NOTE alert |
Company Profile |
SEC
News |
Chart |
Request a new note
C
A
S
I |
PING
-
NYSE
Ping Identity Hldg Corp
Computer Sftwr-Security
|
$33.55
|
-2.05
-5.76% |
$35.14
|
916,584
69.86% of 50 DAV
50 DAV is 1,312,000
|
$37.80
-11.24%
|
6/1/2020
|
$29.24
|
PP = $29.90
|
|
MB = $31.40
|
Most Recent Note - 8/11/2020 6:04:45 PM
G - Retreated from its all-time high with today's 3rd consecutive loss. Due to report Jun '20 quarterly earnings news after the close on Wednesday, 8/12/20. Its 50 DMA line ($32.52) defines important near-term support above prior highs in the $29 area. It has not formed a sound base of sufficient length. Completed Secondary Offerings on 7/09/20 and 5/15/20. See the latest FSU analysis for more details and an annotated graph.
>>> FEATURED STOCK ARTICLE : Perched Near High With Earnings News Due Wednesday Evening - 8/10/2020 |
View all notes |
Set NEW NOTE alert |
Company Profile |
SEC
News |
Chart |
Request a new note
C
A
S
I |
ZEN
-
NYSE
Zendesk Inc
Computer Sftwr-Enterprse
|
$85.26
|
-2.00
-2.29% |
$87.48
|
1,932,542
87.33% of 50 DAV
50 DAV is 2,212,800
|
$101.94
-16.36%
|
7/21/2020
|
$94.29
|
PP = $94.97
|
|
MB = $99.72
|
Most Recent Note - 8/7/2020 5:46:47 PM
G - Color code is changed to green while slumping further into the prior base as its Relative Strength Rating has fallen to 74, below the 80+ minimum guideline for buy candidates. Testing the 50 DMA line ($88.57) which defines important near term support, and any loss and subsequent violation may trigger a technical sell signal. Weak action came after it reported Jun '20 quarterly earnings +180% on +27% sales revenues versus the year-ago period.
>>> FEATURED STOCK ARTICLE : Pullback Below Pivot Point Following Breakout Gain - 7/21/2020 |
View all notes |
Set NEW NOTE alert |
Company Profile |
SEC
News |
Chart |
Request a new note
C
A
S
I |
Symbol/Exchange
Company Name
Industry Group |
PRICE |
CHANGE
(%Change) |
Day High |
Volume
(% DAV)
(% 50 day avg vol) |
52 Wk Hi
% From Hi |
Featured
Date |
Price
Featured |
Pivot Featured |
|
Max Buy |
|
|
|
THESE ARE NOT BUY RECOMMENDATIONS!
Comments contained in the body of this report are technical
opinions only. The material herein has been obtained
from sources believed to be reliable and accurate, however,
its accuracy and completeness cannot be guaranteed.
This site is not an investment advisor, hence it does
not endorse or recommend any securities or other investments.
Any recommendation contained in this report may not
be suitable for all investors and it is not to be deemed
an offer or solicitation on our part with respect to
the purchase or sale of any securities. All trademarks,
service marks and trade names appearing in this report
are the property of their respective owners, and are
likewise used for identification purposes only.
This report is a service available
only to active Paid Premium Members.
You may opt-out of receiving report notifications
at any time. Questions or comments may be submitted
by writing to Premium Membership Services 665 S.E. 10 Street, Suite 201 Deerfield Beach, FL 33441-5634 or by calling 1-800-965-8307
or 954-785-1121.
|
|
|