You are not logged in.
This means you
CAN ONLY VIEW reports that were published prior to Sunday, February 25, 2024.
You
MUST UPGRADE YOUR MEMBERSHIP if you want to see any current reports.
AFTER MARKET UPDATE - FRIDAY, AUGUST 9TH, 2019
Previous After Market Report Next After Market Report >>>
|
|
|
|
DOW |
-90.75 |
26,287.44 |
-0.34% |
|
Volume |
775,619,360 |
-25% |
|
Volume |
2,211,592,770 |
-9% |
|
NASDAQ |
-80.02 |
7,959.14 |
-1.00% |
|
Advancers |
956 |
34% |
|
Advancers |
1,039 |
34% |
|
S&P 500 |
-19.44 |
2,918.65 |
-0.66% |
|
Decliners |
1,859 |
66% |
|
Decliners |
2,041 |
66% |
|
Russell 2000 |
-19.09 |
1,513.04 |
-1.25% |
|
52 Wk Highs |
177 |
|
|
52 Wk Highs |
62 |
|
|
S&P 600 |
-11.60 |
930.75 |
-1.23% |
|
52 Wk Lows |
114 |
|
|
52 Wk Lows |
141 |
|
|
 |
Major Indices Fell With Lighter Volume Totals
Kenneth J. Gruneisen - Passed the CAN SLIM® Master's Exam
The S&P 500 conclude a volatile week with a 0.5% decline, and the Dow lost 0.8%. The Nasdaq Composite slipped 0.6% for the week. Volume totals reported were lighter than the prior session totals on the NYSE and on the Nasdaq exchange. Breadth was negative as decliners led advancers by nearly a 2-1 margin on the NYSE and on the Nasdaq exchange. There were 40 high-ranked companies from the Leaders List hit new 52-week highs and were listed on the BreakOuts Page, versus the total of 58 on the prior session. New 52-week highs outnumbered new 52-week lows on the NYSE however new lows easily outnumbered new highs and on the Nasdaq exchange. Disciplined investors will watch for a follow-through between Day 4-7 which could signal a new uptrend for the major indices (M criteria). The Featured Stocks Page provides the most timely analysis on high-ranked leaders.Charts used courtesy of www.stockcharts.com
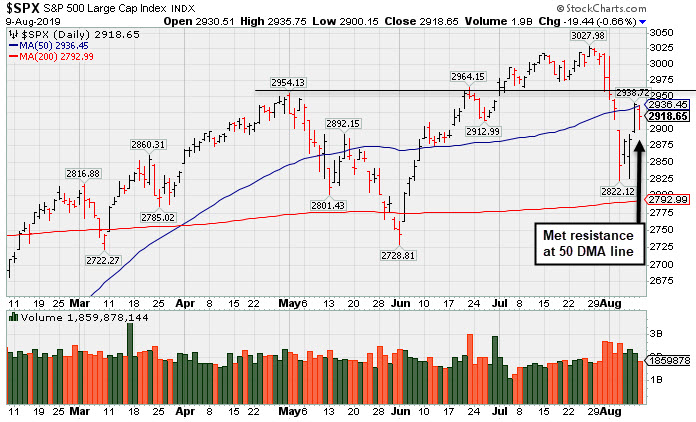
PICTURED: The S&P 500 Index met resistance at its 50-day moving average (DMA) line on Friday which marked Day 4 of the rally attempt.
Stocks finished lower Friday, as investors assessed the latest updates on the U.S. and China trade dispute. Investor sentiment was dampened after a report indicated the Trump Administration would delay waivers for U.S. Tech companies to supply components to Huawei. Adding to the downbeat mood were comments from President Trump suggesting planned trade negotiations in September with China could be cancelled. Perceived "safe-haven" assets modestly weakened, with COMEX gold off 0.1% to $1,496.60. Treasuries were lower along the curve, with the yield on the 10-year note up two basis points to 1.73%.
On the data front, the core Producer Price Index, which excludes volatile components food and gas, declined 0.1% month-over-month in July, less than the projected 0.1% advance. The 2.1% annualized core reading was the slowest in two years.
Eight of 11 S&P 500 sectors ended in negative territory. Technology stocks paced the decline as chipmakers underperform. Energy stocks also lagged despite WTI crude jumping 3.5% to $54.41/barrel. In earnings, shares of Uber (UBER -6.80%) fell after the ride sharing company posted a larger than anticipated quarterly loss. Activision Blizzard (ATVI -2.57%) fell despite the video game developer topping analyst projections on both the top and bottom line.
|
 Kenneth J. Gruneisen started out as a licensed stockbroker in August 1987, a couple of months prior to the historic stock market crash that took the Dow Jones Industrial Average down -22.6% in a single day. He has published daily fact-based fundamental and technical analysis on high-ranked stocks online for two decades. Through FACTBASEDINVESTING.COM, Kenneth provides educational articles, news, market commentary, and other information regarding proven investment systems that work in good times and bad.
Comments contained in the body of this report are technical opinions only and are not necessarily those of Gruneisen Growth Corp. The material herein has been obtained from sources believed to be reliable and accurate, however, its accuracy and completeness cannot be guaranteed. Our firm, employees, and customers may effect transactions, including transactions contrary to any recommendation herein, or have positions in the securities mentioned herein or options with respect thereto. Any recommendation contained in this report may not be suitable for all investors and it is not to be deemed an offer or solicitation on our part with respect to the purchase or sale of any securities. |
|
 |
Retail, Tech, Financial, and Commodity-Linked Groups Fell
Kenneth J. Gruneisen - Passed the CAN SLIM® Master's Exam
The Retail Index ($RLX -1.32%), Broker/Dealer Index ($XBD -0.97%) and the Bank Index ($BKX -0.41%) ended the session lower. The tech sector was also weak as the Semiconductor Index ($SOX -1.81%), Biotech Index ($BTK -1.51%), and the Networking Index ($NWX -1.33%) finished with unanimous losses. The Gold & Silver Index ($XAU -1.17%) and Integrated Oil Index ($XOI -0.77%) lost ground and the Oil Services Index ($OSX -3.07%) was a standout decliner.
Charts courtesy of www.stockcharts.com
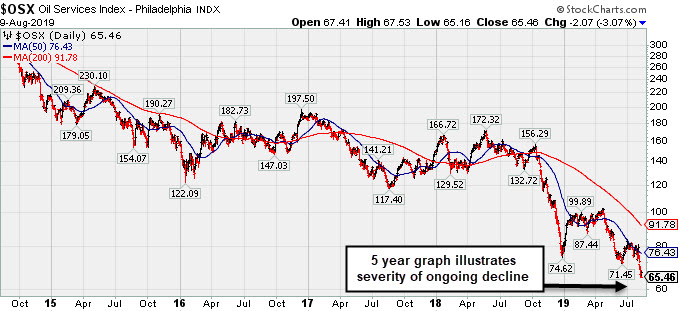
PICTURED: The 5-year graph of the Oil Services Index ($OSX -3.07%) illustrates the severity of the ongoing decline.
| Oil Services |
$OSX |
65.46 |
-2.07 |
-3.07% |
-18.78% |
| Integrated Oil |
$XOI |
1,189.42 |
-9.24 |
-0.77% |
+2.62% |
| Semiconductor |
$SOX |
1,464.34 |
-26.92 |
-1.81% |
+26.76% |
| Networking |
$NWX |
565.36 |
-7.61 |
-1.33% |
+15.69% |
| Broker/Dealer |
$XBD |
253.14 |
-2.48 |
-0.97% |
+6.66% |
| Retail |
$RLX |
2,299.81 |
-30.84 |
-1.32% |
+17.85% |
| Gold & Silver |
$XAU |
95.78 |
-1.14 |
-1.18% |
+35.55% |
| Bank |
$BKX |
94.48 |
-0.39 |
-0.41% |
+10.13% |
| Biotech |
$BTK |
4,599.60 |
-70.29 |
-1.51% |
+8.97% |
|
|
|
 |
Consolidating Above 50-Day Average With Earnings News Soon
Kenneth J. Gruneisen - Passed the CAN SLIM® Master's Exam
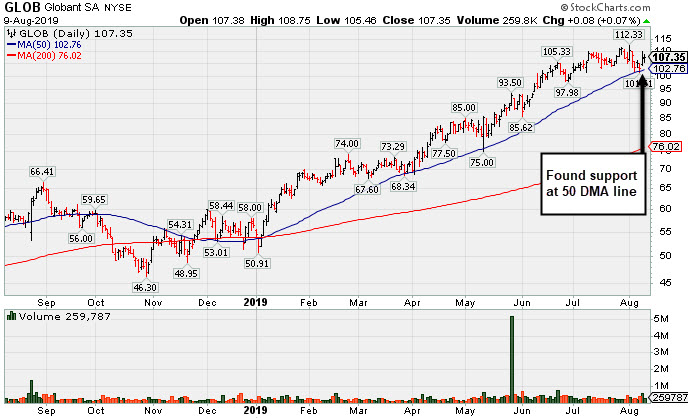
Globant SA (GLOB +$0.08 or +0.07% to $107.35) found support at Its 50-day moving average (DMA) line ($102.76), but it has not formed a sound new base of sufficient length. Keep in mind it is due to report earnings news on 8/15/19. Volume and volatility often increase near earnings news.
Bullish action came after it reported earnings +32% on +22% sales revenues for the quarter ended March 31st, 2019 versus the year ago period, continuing its strong earning track record. GLOB was last shown in this FSU section on 7/11/19 with an annotated graph under the headline, "Extended From Any Sound Base After Wedging Higher". It was highlighted in yellow with pivot point cited based on its 1/30/19 high plus 10 cents in the 2/15/19 mid-day report (read here). Prior quarterly comparisons versus the year ago periods were very near or above the +25% minimum earnings guideline (C criteria). It has a strong annual earnings (A criteria) history and has a 96 Earnings Per Share Rating.
This Luxembourg-based Computer - Tech Services firm completed a Secondary Offering on 6/21/18. The number of top-rated funds owning its shares rose from 235 in Mar '18 to 484 in Jun '19, a reassuring sign concerning the I criteria. Its current Up/Down Volume Ratio of 1.5 is an unbiased indication its shares have been under accumulation over the past 50 days. It has a Timeliness rating of A and Sponsorship Rating of B. Its small supply of 36.3 million shares outstanding (S criteria) can contribute to greater volatility in the event of institutional buying or selling.
Charts courtesy of www.stockcharts.com
|
|
|
Color Codes Explained :
Y - Better candidates highlighted by our
staff of experts.
G - Previously featured
in past reports as yellow but may no longer be buyable under the
guidelines.
***Last / Change / Volume data in this table is the closing quote data***
Symbol/Exchange
Company Name
Industry Group |
PRICE |
CHANGE
(%Change) |
Day High |
Volume
(% DAV)
(% 50 day avg vol) |
52 Wk Hi
% From Hi |
Featured
Date |
Price
Featured |
Pivot Featured |
|
Max Buy |
 SPSC
-
NASDAQ
SPSC
-
NASDAQ
S P S Commerce Inc
COMPUTER SOFTWARE and SERVICES - Application Software
|
$107.91
|
-1.93
-1.76% |
$111.20
|
72,214
54.71% of 50 DAV
50 DAV is 132,000
|
$118.28
-8.77%
|
6/7/2019
|
$107.72
|
PP = $115.10
|
|
MB = $120.86
|
Most Recent Note - 8/8/2019 8:32:11 PM
Y - Found support at its 50 DMA line. Stalled after a gap up and big volume-driven gain noted on 7/26/19. Subsequent gains and a strong close above the pivot point may clinch a convincing new (or add-on) technical buy signal. Reported earnings +22% on +12% sales revenues for the Jun '19 quarter, slightly under the +25% minimum earnings guideline (C criteria), raising fundamental concerns. See the latest FSU analysis for more details and a new annotated graph.
>>> FEATURED STOCK ARTICLE : Found Support at 50-Day Average - 8/8/2019 |
View all notes |
Set NEW NOTE alert |
Company Profile |
SEC
News |
Chart |
Request a new note
C
A
S
I |
EPAM
-
NYSE
Epam Systems Inc
COMPUTER SOFTWARE and SERVICES - Information Technology Service
|
$186.50
|
-3.48
-1.83% |
$188.05
|
624,505
138.47% of 50 DAV
50 DAV is 451,000
|
$201.00
-7.21%
|
5/9/2019
|
$169.25
|
PP = $180.55
|
|
MB = $189.58
|
Most Recent Note - 8/8/2019 12:32:37 PM
Y - Color code was changed to yellow after reporting earnings +27% on +24% sales revenues and rebounding above its 50 DMA line ($182.46) helping its outlook to improve.
>>> FEATURED STOCK ARTICLE : Winning Streak Leaves IT Firm Extended From Prior Base - 7/12/2019 |
View all notes |
Set NEW NOTE alert |
Company Profile |
SEC
News |
Chart |
Request a new note
C
A
S
I |
AUDC
-
NASDAQ
Audiocodes Ltd
ELECTRONICS - Scientific and Technical Instrum
|
$18.58
|
-0.20
-1.06% |
$18.81
|
75,360
43.06% of 50 DAV
50 DAV is 175,000
|
$19.74
-5.88%
|
7/15/2019
|
$17.10
|
PP = $17.54
|
|
MB = $18.42
|
Most Recent Note - 8/5/2019 4:01:44 PM
Y - Color code is changed to yellow after retreating below its "max buy" level amid widespread market weakness (M criteria). Reported earnings +57% on +14% sales revenues for the Jun '19 quarter, continuing its strong earnings track record. Prior highs in the $17 area define initial support above its 50 DMA line ($16.18).
>>> FEATURED STOCK ARTICLE : Posted a Gain With Average Volume for Best Ever Close - 7/15/2019 |
View all notes |
Set NEW NOTE alert |
Company Profile |
SEC
News |
Chart |
Request a new note
C
A
S
I |
LHCG
-
NASDAQ
L H C Group Inc
HEALTH SERVICES - Home Health Care
|
$122.83
|
+0.65
0.53% |
$123.67
|
215,057
97.75% of 50 DAV
50 DAV is 220,000
|
$129.37
-5.06%
|
7/1/2019
|
$110.94
|
PP = $122.20
|
|
MB = $128.31
|
Most Recent Note - 8/8/2019 12:39:01 PM
Y - Reported earnings +27% on +3% sales revenues for the Jun '19 quarter. Prior quarterly comparisons showed much stronger sales revenues growth. Found support above its 50 DMA line ($119.76). Recent gains above its pivot point were not backed by the +40% above average volume needed to trigger a proper new (or add-on) technical buy signal.
>>> FEATURED STOCK ARTICLE : Consolidating Following a Negative Reversal at High - 7/22/2019 |
View all notes |
Set NEW NOTE alert |
Company Profile |
SEC
News |
Chart |
Request a new note
C
A
S
I |
CHDN
-
NASDAQ
Churchill Downs Inc
LEISURE - Gaming Activities
|
$121.02
|
-0.36
-0.30% |
$121.43
|
199,769
72.64% of 50 DAV
50 DAV is 275,000
|
$132.73
-8.82%
|
7/22/2019
|
$118.45
|
PP = $118.89
|
|
MB = $124.83
|
Most Recent Note - 8/6/2019 8:57:41 PM
Y - Found support above its 50 DMA line ($114) with a gain on lighter volume. Reported Jun '19 earnings rose +10% on +26% sales revenues versus the year ago period, below the +25% minimum earnings guideline (C criteria). The prior low ($108.57 on 6/25/19) defines the next important near-term support to watch below its 50 DMA line.
>>> FEATURED STOCK ARTICLE : Volume Light While Hovering at Record High - 7/16/2019 |
View all notes |
Set NEW NOTE alert |
Company Profile |
SEC
News |
Chart |
Request a new note
C
A
S
I |
Symbol/Exchange
Company Name
Industry Group |
PRICE |
CHANGE
(%Change) |
Day High |
Volume
(% DAV)
(% 50 day avg vol) |
52 Wk Hi
% From Hi |
Featured
Date |
Price
Featured |
Pivot Featured |
|
Max Buy |
LULU
-
NASDAQ
Lululemon Athletica
MANUFACTURING - Textile Manufacturing
|
$182.82
|
-3.53
-1.89% |
$186.00
|
930,571
45.15% of 50 DAV
50 DAV is 2,061,000
|
$194.25
-5.88%
|
6/13/2019
|
$174.48
|
PP = $179.60
|
|
MB = $188.58
|
Most Recent Note - 8/8/2019 10:53:10 AM
Y - Color code is changed to yellow after rebounding above its 50 DMA line ($181.65) helping its technical stance improve. Reported Apr '19 quarterly earnings +35% on +20% sales revenues versus the year ago period.
>>> FEATURED STOCK ARTICLE : Quietly Hovering at All-Time High - 7/17/2019 |
View all notes |
Set NEW NOTE alert |
Company Profile |
SEC
News |
Chart |
Request a new note
C
A
S
I |
ULTA
-
NASDAQ
Ulta Beauty Inc
SPECIALTY RETAIL - Specialty Retail, Other
|
$346.70
|
-6.34
-1.80% |
$353.40
|
517,200
70.18% of 50 DAV
50 DAV is 737,000
|
$368.83
-6.00%
|
3/15/2019
|
$341.27
|
PP = $322.59
|
|
MB = $338.72
|
Most Recent Note - 8/7/2019 6:54:44 PM
G - Still sputtering below its 50 DMA line ($346.55). Volume totals have been near average while still hovering near its all-time high. Reported earnings +17% on +13% sales revenues for the Apr '19 quarter, below the +25% minimum earnings guideline (C criteria), raising fundamental concerns. See the latest FSU analysis for more details and a new annotated graph.
>>> FEATURED STOCK ARTICLE : Ulta Beauty Sputtering Below 50-Day Moving Average - 8/7/2019 |
View all notes |
Set NEW NOTE alert |
Company Profile |
SEC
News |
Chart |
Request a new note
C
A
S
I |
CHGG
-
NYSE
Chegg Inc
Consumer Svcs-Education
|
$43.68
|
-1.31
-2.91% |
$45.01
|
1,268,698
84.86% of 50 DAV
50 DAV is 1,495,000
|
$48.22
-9.42%
|
7/8/2019
|
$44.11
|
PP = $41.79
|
|
MB = $43.88
|
 Most Recent Note - 8/9/2019 8:56:08 PM
Y - Consolidating above prior highs in the $40-41 area which define important near-term support to watch along with its 50 DMA line ($41.28). Reported earnings +92% on +26% sales revenues for the Jun '19 quarter.
>>> FEATURED STOCK ARTICLE : Consolidating Above Prior Highs and 50-Day Average - 8/6/2019 |
View all notes |
Set NEW NOTE alert |
Company Profile |
SEC
News |
Chart |
Request a new note
C
A
S
I |
VEEV
-
NYSE
Veeva Systems Inc Cl A
Computer Sftwr-Medical
|
$162.16
|
-1.14
-0.70% |
$163.28
|
662,368
40.59% of 50 DAV
50 DAV is 1,632,000
|
$176.90
-8.33%
|
5/30/2019
|
$154.32
|
PP = $145.80
|
|
MB = $153.09
|
Most Recent Note - 8/5/2019 4:15:49 PM
G - Undercut yet closed above the prior low ($155 on 6/27/19) as it gapped down below its 50 DMA line ($163.58) with today's 3rd consecutive loss raising greater concerns. Fundamentals remain strong.
>>> FEATURED STOCK ARTICLE : Recently Found Support Near 50-Day Moving Average - 8/1/2019 |
View all notes |
Set NEW NOTE alert |
Company Profile |
SEC
News |
Chart |
Request a new note
C
A
S
I |
PAYC
-
NYSE
Paycom Software Inc
COMPUTER SOFTWARE and SERVICES - Application Software
|
$240.62
|
+0.15
0.06% |
$242.31
|
432,247
62.74% of 50 DAV
50 DAV is 689,000
|
$246.85
-2.52%
|
2/6/2019
|
$171.66
|
PP = $164.18
|
|
MB = $172.39
|
Most Recent Note - 8/5/2019 4:09:03 PM
G - Gapped down and violated its 50 DMA line with today's volume-driven loss triggering a technical sell signal. Last week it reported earnings +27% on +31% sales revenues for the Jun '19 quarter, continuing its strong earnings track record. See the latest FSU analysis for more details and an annotated graph.
>>> FEATURED STOCK ARTICLE : Found Support and Gapped Up Following Earnings Report - 8/2/2019 |
View all notes |
Set NEW NOTE alert |
Company Profile |
SEC
News |
Chart |
Request a new note
C
A
S
I |
Symbol/Exchange
Company Name
Industry Group |
PRICE |
CHANGE
(%Change) |
Day High |
Volume
(% DAV)
(% 50 day avg vol) |
52 Wk Hi
% From Hi |
Featured
Date |
Price
Featured |
Pivot Featured |
|
Max Buy |
PLNT
-
NYSE
Planet Fitness Inc Cl A
Leisure-Services
|
$73.77
|
-1.58
-2.10% |
$75.32
|
1,126,325
72.29% of 50 DAV
50 DAV is 1,558,000
|
$81.90
-9.93%
|
7/26/2019
|
$79.15
|
PP = $82.00
|
|
MB = $86.10
|
Most Recent Note - 8/7/2019 12:36:46 PM
G - Color code is changed to green after it gapped down today slumping well below its 50 DMA line ($76.70) with today's big volume-driven loss raising concerns. Reported earnings +32% on +29% sales revenues for the Jun '19 quarter continuing its strong earnings track record.
>>> FEATURED STOCK ARTICLE : Fitness Firm Forming a New Base - 7/26/2019 |
View all notes |
Set NEW NOTE alert |
Company Profile |
SEC
News |
Chart |
Request a new note
C
A
S
I |
BLD
-
NYSE
Topbuild Corp
Bldg-Constr Prds/Misc
|
$89.92
|
-0.64
-0.71% |
$90.85
|
185,112
56.96% of 50 DAV
50 DAV is 325,000
|
$92.07
-2.34%
|
5/17/2019
|
$82.19
|
PP = $87.31
|
|
MB = $91.68
|
Most Recent Note - 8/7/2019 7:00:45 PM
Y - Posted a gain with average volume today for a best-ever close, perched at its all-time high. Bullish action came after it reported earnings +39% on +9% sales revenues for the Jun '19 quarter versus the year ago period, continuing its strong earnings track record. Its gain above the pivot point on 8/02/19 was backed by +81% above average volume clinching a convincing technical buy signal. Its 50 DMA line ($81.43) and recent lows define near-term support to watch on pullbacks.
>>> FEATURED STOCK ARTICLE : Perched Near 52-Week High Finding Support - 7/25/2019 |
View all notes |
Set NEW NOTE alert |
Company Profile |
SEC
News |
Chart |
Request a new note
C
A
S
I |
TEAM
-
NASDAQ
Atlassian Corp Plc Cl A
Comp Sftwr-Spec Enterprs
|
$145.99
|
+0.87
0.60% |
$147.59
|
835,841
62.94% of 50 DAV
50 DAV is 1,328,000
|
$149.80
-2.54%
|
5/24/2019
|
$129.52
|
PP = $132.09
|
|
MB = $138.69
|
Most Recent Note - 8/7/2019 6:56:15 PM
Y - Posted a gain with above average volume, finding support above its 50 DMA line ($133.45). Its prior low ($123.43 on 6/25/19) defines important near-term support to watch where a violation would raise serious concerns and trigger a more worrisome technical sell signal. Reported earnings +43% on +36% sales revenues for the Jun '19 quarter, continuing its strong earnings track record.
>>> FEATURED STOCK ARTICLE : Abrupt Retreat After Getting Very Extended From Prior Base - 7/29/2019 |
View all notes |
Set NEW NOTE alert |
Company Profile |
SEC
News |
Chart |
Request a new note
C
A
S
I |
GLOB
-
NYSE
Globant SA
Computer-Tech Services
|
$107.35
|
+0.08
0.07% |
$108.75
|
259,787
81.18% of 50 DAV
50 DAV is 320,000
|
$112.33
-4.43%
|
2/15/2019
|
$69.35
|
PP = $70.00
|
|
MB = $73.50
|
Most Recent Note - 8/9/2019 8:54:16 PM
G - Found support at Its 50 DMA line ($102.476), but it has not formed a sound new base of sufficient length. Due to report earnings news on 8/15/19. See the latest FSU analysis for more details and a new annotated graph.
>>> FEATURED STOCK ARTICLE : Consolidating Above 50-Day Average With Earnings News Soon - 8/9/2019 |
View all notes |
Set NEW NOTE alert |
Company Profile |
SEC
News |
Chart |
Request a new note
C
A
S
I |
TTD
-
NASDAQ
The Trade Desk Inc Cl A
Comml Svcs-Advertising
|
$271.94
|
-1.73
-0.63% |
$289.51
|
3,561,076
242.91% of 50 DAV
50 DAV is 1,466,000
|
$279.71
-2.78%
|
7/18/2019
|
$240.61
|
PP = $258.10
|
|
MB = $271.01
|
Most Recent Note - 8/9/2019 1:46:43 PM
G - Reported Jun '19 quarterly earnings +58% on +42% sales revenues. Color code is changed to green while hitting a new all-time high, rising above its "max buy" level with today's 4th consecutive volume-driven gain. Its 50 DMA line ($244) defines support.
>>> FEATURED STOCK ARTICLE : Endured Distributional Pressure While Building on New Base - 7/18/2019 |
View all notes |
Set NEW NOTE alert |
Company Profile |
SEC
News |
Chart |
Request a new note
C
A
S
I |
Symbol/Exchange
Company Name
Industry Group |
PRICE |
CHANGE
(%Change) |
Day High |
Volume
(% DAV)
(% 50 day avg vol) |
52 Wk Hi
% From Hi |
Featured
Date |
Price
Featured |
Pivot Featured |
|
Max Buy |
PAGS
-
NYSE
Pagseguro Digital Cl A
Finance-CrdtCard/PmtPr
|
$45.95
|
-1.02
-2.17% |
$46.74
|
2,385,027
106.90% of 50 DAV
50 DAV is 2,231,000
|
$48.88
-5.99%
|
6/25/2019
|
$37.69
|
PP = $40.07
|
|
MB = $42.07
|
Most Recent Note - 8/6/2019 8:54:36 PM
G - Posted a gain today with light volume. Prior high in the $40 area defines initial support to watch along with its 50 DMA line ($39.95).
>>> FEATURED STOCK ARTICLE : Encountering Distributional Pressure After Impressive Sprint - 7/30/2019 |
View all notes |
Set NEW NOTE alert |
Company Profile |
SEC
News |
Chart |
Request a new note
C
A
S
I |
|
|
|
THESE ARE NOT BUY RECOMMENDATIONS!
Comments contained in the body of this report are technical
opinions only. The material herein has been obtained
from sources believed to be reliable and accurate, however,
its accuracy and completeness cannot be guaranteed.
This site is not an investment advisor, hence it does
not endorse or recommend any securities or other investments.
Any recommendation contained in this report may not
be suitable for all investors and it is not to be deemed
an offer or solicitation on our part with respect to
the purchase or sale of any securities. All trademarks,
service marks and trade names appearing in this report
are the property of their respective owners, and are
likewise used for identification purposes only.
This report is a service available
only to active Paid Premium Members.
You may opt-out of receiving report notifications
at any time. Questions or comments may be submitted
by writing to Premium Membership Services 665 S.E. 10 Street, Suite 201 Deerfield Beach, FL 33441-5634 or by calling 1-800-965-8307
or 954-785-1121.
|
|
|

