You are not logged in.
This means you
CAN ONLY VIEW reports that were published prior to Saturday, February 24, 2024.
You
MUST UPGRADE YOUR MEMBERSHIP if you want to see any current reports.
AFTER MARKET UPDATE - FRIDAY, AUGUST 7TH, 2020
Previous After Market Report Next After Market Report >>>
|
|
|
|
DOW |
+46.50 |
27,433.48 |
+0.17% |
|
Volume |
807,880,670 |
+0% |
|
Volume |
4,197,822,500 |
+4% |
|
NASDAQ |
-99.17 |
11,008.90 |
-0.89% |
|
Advancers |
1,885 |
64% |
|
Advancers |
1,901 |
58% |
|
S&P 500 |
+2.12 |
3,351.28 |
+0.06% |
|
Decliners |
1,039 |
36% |
|
Decliners |
1,372 |
42% |
|
Russell 2000 |
+24.56 |
1,569.18 |
+1.59% |
|
52 Wk Highs |
98 |
|
|
52 Wk Highs |
153 |
|
|
S&P 600 |
+15.67 |
911.67 |
+1.75% |
|
52 Wk Lows |
8 |
|
|
52 Wk Lows |
10 |
|
|
 |
Major Indices Were Mixed Friday Yet Unanimously Higher for the Week
Kenneth J. Gruneisen - Passed the CAN SLIM® Master's Exam
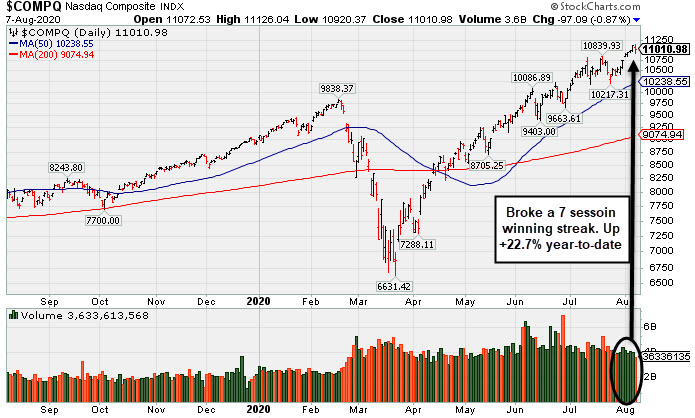
The Dow rose 46 points to extend its weekly gain to 3.8%. The S&P 500 rose 0.1% to end the week up 2.5%. The Nasdaq Composite fell 0.9% to snap a seven-session winning streak, however still managed to rise 2.5% for the week. The reported volume totals were higher than the prior session on the NYSE and on the Nasdaq exchange. Breadth was positive as advancers led decliners by a 9-5 margin on the NYSE and by a 3-2 margin on the Nasdaq exchange. There were 77 high-ranked companies from the Leaders List that hit new 52-week highs and were listed on the BreakOuts Page, versus the total of 75 on the prior session. New 52-week highs totals contracted yet still solidly outnumbered new 52-week lows totals on both the NYSE and the Nasdaq exchange. The major indices are in a confirmed uptrend (M criteria). Any sustainable rally requires a healthy crop of new leaders, so it remains ever-important to see substantial new highs totals. Charts used courtesy of www.stockcharts.com
PICTURED: The Nasdaq Composite Index broke a 7-session winning streak with a loss on Friday. The tech-heavy index is up +22.7% year-to-date. Stocks finished mixed Friday, as investors digested updates on the labor market and assessed escalating U.S.-China tensions. President Trump signed an executive order preventing U.S. residents from doing business with China’s TikTok and WeChat apps in 45 days. Further weighing on sentiment, were reports that White House officials and Democratic lawmakers could not finalize a fifth coronavirus relief bill.
On the data front, the Labor Department revealed 1.76 million jobs were added to the U.S. economy in July, slightly above expectations of a 1.48 million increase, but easing from the prior 4.79 million uptick. The unemployment rate fell to 10.2%, versus estimates of 10.6% and the previous 11.1% figure. Treasuries weakened, with the yield on the 10-year note adding two basis points to 0.56%. COMEX gold lost 1.2% to $2,026.60/ounce, but still capped its ninth- straight week of gains.
Eight of 11 S&P 500 sectors ended the day in positive territory with the Utilities and Financial groups outperforming. In earnings, T-Mobile (TMUS +6.47%) hit a new high after better than expected subscriber growth helped the company surpass AT&T (T +0.60%) as the number two mobile carrier in the United States. Meanwhile, Uber Technologies (UBER -5.21%) fell after missing profit estimates as sluggish demand for ride-hailing services outweighed an upside surprise in food delivery.
|
 Kenneth J. Gruneisen started out as a licensed stockbroker in August 1987, a couple of months prior to the historic stock market crash that took the Dow Jones Industrial Average down -22.6% in a single day. He has published daily fact-based fundamental and technical analysis on high-ranked stocks online for two decades. Through FACTBASEDINVESTING.COM, Kenneth provides educational articles, news, market commentary, and other information regarding proven investment systems that work in good times and bad.
Comments contained in the body of this report are technical opinions only and are not necessarily those of Gruneisen Growth Corp. The material herein has been obtained from sources believed to be reliable and accurate, however, its accuracy and completeness cannot be guaranteed. Our firm, employees, and customers may effect transactions, including transactions contrary to any recommendation herein, or have positions in the securities mentioned herein or options with respect thereto. Any recommendation contained in this report may not be suitable for all investors and it is not to be deemed an offer or solicitation on our part with respect to the purchase or sale of any securities. |
|
 |
Financial and Biotech Indexes Rose
Kenneth J. Gruneisen - Passed the CAN SLIM® Master's Exam
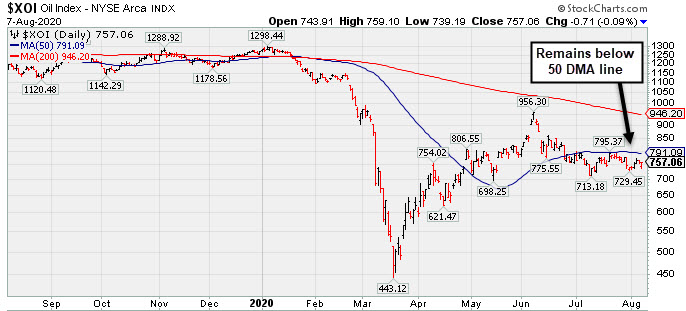
The Retail Index ($RLX -0.63%) edged lower while the Bank Index ($BKX +3.16%) and Broker/Dealer Index ($XBD +1.54%) both posted gains that helped to lift the major indices. The Semiconductor Index ($SOX -1.18%) and Networking Index ($NWX -0.44%) both lost ground while the Biotech Index ($BTK +0.07%) finished flat. The Gold & Silver Index ($XAU -3.42%) was a standout decliner while the Oil Services Index ($OSX -1.18%) and Integrated Oil Index ($XOI -0.85%) each suffered smaller losses.PICTURED: The Integrated Oil Index ($XOI -0.85%) remains below its 50 DMA line which has acted as resistance.
| Oil Services |
$OSX |
38.22 |
+0.42 |
+1.11% |
-51.18% |
| Integrated Oil |
$XOI |
757.06 |
-0.71 |
-0.09% |
-40.41% |
| Semiconductor |
$SOX |
2,178.86 |
-26.08 |
-1.18% |
+17.80% |
| Networking |
$NWX |
620.88 |
-2.76 |
-0.44% |
+6.42% |
| Broker/Dealer |
$XBD |
290.14 |
+4.41 |
+1.54% |
-0.08% |
| Retail |
$RLX |
3,366.41 |
-21.19 |
-0.63% |
+37.45% |
| Gold & Silver |
$XAU |
154.14 |
-5.46 |
-3.42% |
+44.16% |
| Bank |
$BKX |
77.42 |
+2.37 |
+3.16% |
-31.70% |
| Biotech |
$BTK |
5,678.03 |
+4.19 |
+0.07% |
+12.05% |
|
|
|
 |
Hit New Highs Again; EPS Rating Dropped Yet Remains High at 92
Kenneth J. Gruneisen - Passed the CAN SLIM® Master's Exam
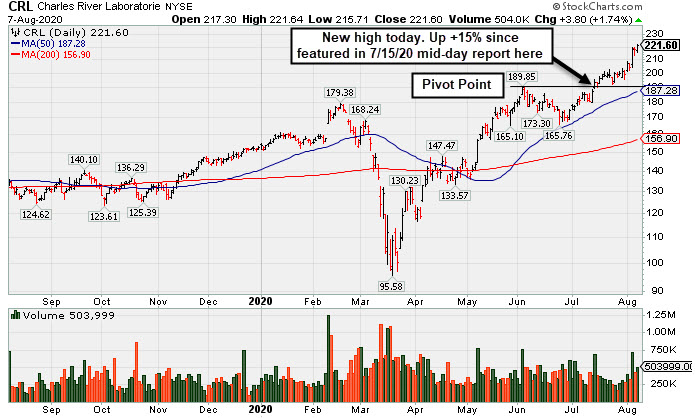
Charles River Labs Intl (CRL +$3.80 or +1.74% to $221.60) hit yet another new all-time high with today's gain backed by +25% above average volume. Bullish action came this week even after it reported Jun '20 quarterly earnings -3% on +4% sales revenues, below the +25% minimum guideline (C criteria), but better than expected while the company also raised its guidance. It now has a 92 Earnings Per Share Rating, down from 96 after the report.
The prior high ($189.85 on 6/03/20) defines initial support to watch above its 50-day moving average (DMA) line ($187.28). CRL is up +15% since it was highlighted in yellow with pivot point cited based on its 6/03/20 high plus 10 cents in the 7/115/20 mid-day report (read here). It was last shown in this FSU section that evening with an annotated graph under the headline, "Volume +71% Above Average Behind Breakout".
The 2 prior quarterly earnings increases were above the +25% minimum guideline (C criteria) of the fact-based investment system. Annual earnings (A criteria) history has been strong and steady.
It hails from the DRUGS - Biotechnology industry group which has an 91 Group Relative Strength Rating (L criteria). The number of top-rated funds owning its shares rose from 681 in Dec '19 to 734 in Jun '20, and its Up/Down Volume Ratio is 1.8, an unbiased indication its shares have been under accumulation over the past 50 days. There is a small number of only 49.5 million shares (S criteria) outstanding, which can contribute to greater price volatility in the event of institutional buying or selling.
|
|
|
Color Codes Explained :
Y - Better candidates highlighted by our
staff of experts.
G - Previously featured
in past reports as yellow but may no longer be buyable under the
guidelines.
***Last / Change / Volume data in this table is the closing quote data***
Symbol/Exchange
Company Name
Industry Group |
PRICE |
CHANGE
(%Change) |
Day High |
Volume
(% DAV)
(% 50 day avg vol) |
52 Wk Hi
% From Hi |
Featured
Date |
Price
Featured |
Pivot Featured |
|
Max Buy |
 FTNT
-
NASDAQ
FTNT
-
NASDAQ
Fortinet Inc
Computer Sftwr-Security
|
$131.00
|
-8.51
-6.10% |
$131.68
|
4,184,821
269.64% of 50 DAV
50 DAV is 1,552,000
|
$151.95
-13.79%
|
6/22/2020
|
$142.68
|
PP = $149.79
|
|
MB = $157.28
|
 Most Recent Note - 8/7/2020 12:47:28 PM
G - Color code is changed to green after it gapped down today, violating its 50 DMA line ($137), following its Jun '20 quarterly report of earnings +41% on +18% sales revenues versus the year ago period. Prior low ($124.24 on 7/15/20) defines the next important support level to watch. Faces resistance due to overhead supply up to the $151 level which may hinder upward price progress.
>>> FEATURED STOCK ARTICLE : Rebounded Above 50-Day Average; Earnings News Due on - 8/3/2020 |
View all notes |
Set NEW NOTE alert |
Company Profile |
SEC
News |
Chart |
Request a new note
C
A
S
I |
CRL
-
NYSE
Charles River Labs Intl
DRUGS - Biotechnology
|
$221.60
|
+3.80
1.74% |
$221.64
|
503,999
128.90% of 50 DAV
50 DAV is 391,000
|
$220.01
0.72%
|
7/15/2020
|
$192.66
|
PP = $189.95
|
|
MB = $199.45
|
Most Recent Note - 8/7/2020 5:53:12 PM
G - Hit yet another new all-time high with today's gain backed by +29% above average volume. Bullish action came after it reported Jun '20 quarterly earnings -3% on +4% sales revenues, below the +25% minimum guideline (C criteria) but better than expected while the company also raised its guidance. The prior high ($189.85 on 6/03/20) defines initial support to watch above its 50 DMA line ($187.28). See the latest FSU analysis for more details and a new annotated graph.
>>> FEATURED STOCK ARTICLE : Hit New Highs Again; EPS Rating Dropped Yet Remains High at 92 - 8/7/2020 |
View all notes |
Set NEW NOTE alert |
Company Profile |
SEC
News |
Chart |
Request a new note
C
A
S
I |
EBS
-
NYSE
Emergent Biosolutions
DRUGS - Biotechnology
|
$130.66
|
+3.70
2.91% |
$131.00
|
785,990
77.21% of 50 DAV
50 DAV is 1,018,000
|
$137.61
-5.05%
|
7/7/2020
|
$89.47
|
PP = $93.68
|
|
MB = $98.36
|
Most Recent Note - 8/6/2020 5:34:04 PM
G - Reversed into the red after hitting yet another new all-time high today following 6 consecutive gains, getting very extended from any sound base. Bullish action came after it reported Jun '20 quarterly earnings +890% on +62% sales revenue for the Jun '20 quarter versus the year ago period. Prior highs in the $93 area define initial support above its 50 DMA line ($88.06).
>>> FEATURED STOCK ARTICLE : Rally Continues Into Record High Territory - 8/4/2020 |
View all notes |
Set NEW NOTE alert |
Company Profile |
SEC
News |
Chart |
Request a new note
C
A
S
I |
NBIX
-
NASDAQ
Neurocrine Biosciences
DRUGS - Biotechnology
|
$115.11
|
-0.91
-0.78% |
$118.32
|
619,954
0.75% of 50 DAV
50 DAV is 82,160,000
|
$136.26
-15.52%
|
5/19/2020
|
$123.71
|
PP = $119.75
|
|
MB = $125.74
|
Most Recent Note - 8/7/2020 5:51:23 PM
Fell for a 4th consecutive loss, slumping further below its 50 DMA line while its Relative Strength rating has slumped to 67, well below the 80+ minimum guideline for buy candidates. It will be dropped from the Featured Stocks list tonight. Recently reported Jun '20 quarterly earnings +100% on +65% sales revenues versus the year ago period. A rebound and close above the 50 DMA line ($124.16) is needed for its outlook to improve.
>>> FEATURED STOCK ARTICLE : Consolidating Near 50-Day Moving Average; Earnings Report Due - 7/27/2020 |
View all notes |
Set NEW NOTE alert |
Company Profile |
SEC
News |
Chart |
Request a new note
C
A
S
I |
BMRN
-
NASDAQ
Biomarin Pharmaceutical
DRUGS - Drug Manufacturers - Other
|
$118.67
|
-0.98
-0.82% |
$120.75
|
734,633
52.85% of 50 DAV
50 DAV is 1,390,000
|
$131.95
-10.06%
|
6/17/2020
|
$110.95
|
PP = $112.67
|
|
MB = $118.30
|
Most Recent Note - 8/5/2020 6:21:07 PM
G - Quietly held its ground today. After Tuesday's close it reported Jun '20 quarterly earnings +220% on +11% sales revenues versus the year ago period. Volume and volatility often increases near earnings news. Consolidating above its "max buy" level and near its 50 DMA line ($118.77) which defines important near-term support to watch. See the latest FSU analysis for more details and a new annotated graph.
>>> FEATURED STOCK ARTICLE : Hovering Above 50-Day Average After Another Strong Earnings Report - 8/5/2020 |
View all notes |
Set NEW NOTE alert |
Company Profile |
SEC
News |
Chart |
Request a new note
C
A
S
I |
Symbol/Exchange
Company Name
Industry Group |
PRICE |
CHANGE
(%Change) |
Day High |
Volume
(% DAV)
(% 50 day avg vol) |
52 Wk Hi
% From Hi |
Featured
Date |
Price
Featured |
Pivot Featured |
|
Max Buy |
AUDC
-
NASDAQ
Audiocodes Ltd
ELECTRONICS - Scientific and Technical Instrum
|
$36.10
|
+0.12
0.33% |
$37.12
|
373,510
44.89% of 50 DAV
50 DAV is 832,000
|
$44.94
-19.67%
|
7/17/2020
|
$37.16
|
PP = $40.16
|
|
MB = $42.17
|
Most Recent Note - 8/6/2020 5:36:06 PM
G - Finding support above its 50 DMA line ($34.79) since its slump back below the pivot point and into the prior base raised concerns. More damaging losses would raise greater concerns and trigger a worrisome technical sell signal. Disciplined investors always limit losses by selling any stock that falls more than 7-8% from their purchase price. Reported Jun '20 quarterly earnings +45% on +8% sales revenues versus the year-ago period.
>>> FEATURED STOCK ARTICLE : Resilient and High-Ranked VOIP Firm Rebounding Near Highs - 7/17/2020 |
View all notes |
Set NEW NOTE alert |
Company Profile |
SEC
News |
Chart |
Request a new note
C
A
S
I |
AMD
-
NASDAQ
Advanced Micro Devices
ELECTRONICS - Semiconductor - Broad Line
|
$84.85
|
-1.86
-2.15% |
$87.29
|
66,352,545
104.49% of 50 DAV
50 DAV is 63,504,000
|
$86.98
-2.45%
|
7/22/2020
|
$61.73
|
PP = $59.10
|
|
MB = $62.06
|
Most Recent Note - 8/4/2020 12:20:29 PM
G - Hitting yet another new all-time high with today's volume-driven gain. Reported earnings +125% on +26% sales revenues for the Jun '20 quarter versus the year ago period. Getting very extended from the previously noted base. Disciplined investors avoid chasing stocks more than +5% above prior highs. The prior highs in the $59 area define initial support to watch on pullbacks.
>>> FEATURED STOCK ARTICLE : Pullback After Breakout Gain Backed by +152% Above Average Volume - 7/23/2020 |
View all notes |
Set NEW NOTE alert |
Company Profile |
SEC
News |
Chart |
Request a new note
C
A
S
I |
TREX
-
NYSE
Trex Company Inc
MATERIALS and CONSTRUCTION - General Building Materials
|
$139.04
|
+0.43
0.31% |
$140.60
|
338,512
35.82% of 50 DAV
50 DAV is 945,000
|
$144.96
-4.08%
|
6/26/2020
|
$109.05
|
PP = $132.94
|
|
MB = $139.59
|
Most Recent Note - 8/4/2020 1:05:17 PM
G - Pulling back today on higher volume after hitting a new all-time high on the prior session with recent gains backed by below average volume. Reported Jun '20 quarterly earnings +27% on +7% sales revenues versus the year ago period. Volume and volatility often increase near earnings news. Important near-term support is at its 50 DMA line ($126.74). See the latest FSU analysis for more details and an annotated graph.
>>> FEATURED STOCK ARTICLE : Perched Near All Time High With Earnings News Due Monday - 7/30/2020 |
View all notes |
Set NEW NOTE alert |
Company Profile |
SEC
News |
Chart |
Request a new note
C
A
S
I |
NFLX
-
NASDAQ
Netflix Inc
SPECIALTY RETAIL - Music and Video Stores
|
$494.73
|
-14.35
-2.82% |
$508.29
|
5,896,028
77.59% of 50 DAV
50 DAV is 7,599,000
|
$575.37
-14.02%
|
5/14/2020
|
$441.95
|
PP = $449.62
|
|
MB = $472.10
|
Most Recent Note - 8/7/2020 5:39:06 PM
G - Consolidating well above its 50 DMA line ($471.56) and the prior low ($467.54) which define important near-term support to watch. Extended from the prior base. Fundamentals remain strong.
>>> FEATURED STOCK ARTICLE : Consolidating After Getting Extended From Prior Base - 7/29/2020 |
View all notes |
Set NEW NOTE alert |
Company Profile |
SEC
News |
Chart |
Request a new note
C
A
S
I |
CHGG
-
NYSE
Chegg Inc
Consumer Svcs-Education
|
$86.98
|
+2.16
2.55% |
$89.82
|
4,202,634
117.23% of 50 DAV
50 DAV is 3,585,000
|
$87.97
-1.13%
|
6/17/2020
|
$63.71
|
PP = $68.08
|
|
MB = $71.48
|
Most Recent Note - 8/6/2020 5:21:47 PM
G - Hovering at its all-time high since a gap up and volume-driven gain on 8/03/20 following earnings news. Very extended from any sound base. Reported Jun '20 quarterly earnings +61% on +63% sales revenues versus the year ago period. Prior high in the $68 area defines support to watch coinciding with its 50 DMA line ($68.96) where any losses leading to violations would raise concerns and trigger technical sell signals. See the latest FSU analysis for more details and a new annotated graph.
>>> FEATURED STOCK ARTICLE : Bullish Action Continued After Latest Strong Earnings Report - 8/6/2020 |
View all notes |
Set NEW NOTE alert |
Company Profile |
SEC
News |
Chart |
Request a new note
C
A
S
I |
Symbol/Exchange
Company Name
Industry Group |
PRICE |
CHANGE
(%Change) |
Day High |
Volume
(% DAV)
(% 50 day avg vol) |
52 Wk Hi
% From Hi |
Featured
Date |
Price
Featured |
Pivot Featured |
|
Max Buy |
LGIH
-
NASDAQ
L G I Homes Inc
Bldg-Resident/Comml
|
$112.04
|
-0.81
-0.72% |
$113.77
|
284,669
82.27% of 50 DAV
50 DAV is 346,000
|
$123.94
-9.60%
|
7/7/2020
|
$99.19
|
PP = $95.82
|
|
MB = $100.61
|
Most Recent Note - 8/3/2020 5:58:47 PM
G - Due to report Jun '20 quarterly earnings news before the open on Tuesday, 8/04/20. Posted a gain today with above average for a new best-ever close, getting very extended from the previously noted base. Prior highs in the $95 area and its 50 DMA line ($96.21) define near-term support to watch on pullbacks.
>>> FEATURED STOCK ARTICLE : Earning News Due Next Week for Homebuilder - 7/31/2020 |
View all notes |
Set NEW NOTE alert |
Company Profile |
SEC
News |
Chart |
Request a new note
C
A
S
I |
NOW
-
NYSE
Servicenow Inc
Computer Sftwr-Enterprse
|
$431.21
|
+0.88
0.20% |
$439.29
|
2,444,589
145.42% of 50 DAV
50 DAV is 1,681,000
|
$454.70
-5.17%
|
4/30/2020
|
$343.05
|
PP = $363.05
|
|
MB = $381.20
|
Most Recent Note - 8/4/2020 5:57:33 PM
G - Still hovering near its all-time high, stubbornly holding its ground. It has not formed a sound base. Its 50 DMA line ($408.65) defines important near-term support to watch where a violation may trigger a technical sell signal. Reported Jun '20 quarterly earnings +73% on +28% sales revenues versus the year ago period.
>>> FEATURED STOCK ARTICLE : Perched Near All-Time High With Earnings News Due Next Week - 7/22/2020 |
View all notes |
Set NEW NOTE alert |
Company Profile |
SEC
News |
Chart |
Request a new note
C
A
S
I |
TEAM
-
NASDAQ
Atlassian Corp Plc
Comp Sftwr-Spec Enterprs
|
$170.93
|
-7.04
-3.96% |
$178.41
|
2,237,305
113.30% of 50 DAV
50 DAV is 1,974,700
|
$198.41
-13.85%
|
7/7/2020
|
$190.44
|
PP = $191.82
|
|
MB = $201.41
|
Most Recent Note - 8/7/2020 5:42:44 PM
Slumped further today with higher volume slightly above average. Its Relative Strength Rating has fallen to 74, below the 80+ minimum guideline for buy candidates. It will be dropped from the Featured Stocks list tonight. After violating its 50 DMA line ($181) on 7/31/20 with a damaging volume-driven loss, triggering a technical sell signal, that short-term average acted as resistance. A rebound above the 50 DMA line is needed for its outlook to improve. The prior low ($169.11 on 7/14/20) defines the next important support where any violation would trigger a more worrisome technical sell signal.
>>> FEATURED STOCK ARTICLE : Consolidating Near High With Earnings News Due Soon - 7/24/2020 |
View all notes |
Set NEW NOTE alert |
Company Profile |
SEC
News |
Chart |
Request a new note
C
A
S
I |
TTD
-
NASDAQ
The Trade Desk Inc Cl A
Comml Svcs-Advertising
|
$493.20
|
+12.45
2.59% |
$510.00
|
2,398,999
148.18% of 50 DAV
50 DAV is 1,619,000
|
$500.00
-1.36%
|
6/3/2020
|
$340.61
|
PP = $327.35
|
|
MB = $343.72
|
Most Recent Note - 8/7/2020 1:18:20 PM
G - Reported Jun '20 quarterly earnings -3% on -13% sales revenues versus the year ago period. Perched at its all-time high, very extended from any sound base of sufficient length. Its 50 DMA line ($412.80) and prior low ($404 on 7/24/20) define near-term support to watch on pullbacks.
>>> FEATURED STOCK ARTICLE : Rebounded Near All-Time High With Gain Backed by Light Volume - 7/20/2020 |
View all notes |
Set NEW NOTE alert |
Company Profile |
SEC
News |
Chart |
Request a new note
C
A
S
I |
DOCU
-
NASDAQ
Docusign Inc
Computer Sftwr-Enterprse
|
$204.76
|
-10.92
-5.06% |
$215.42
|
5,624,358
101.34% of 50 DAV
50 DAV is 5,550,000
|
$229.83
-10.91%
|
6/10/2020
|
$149.73
|
PP = $152.10
|
|
MB = $159.71
|
Most Recent Note - 8/7/2020 5:36:47 PM
G - Pulled back today with higher (near average) volume behind a 2nd consecutive loss while abruptly retreating from its all-time high. Still very extended from any sound base. Its 50 DMA line ($181.65) defines near-term support to watch. DOCU is now priced +88% above its 200 DMA price, and it is taught in the Certification that a stock trading +70-100% or more above the 200 DMA is to be recognized as a "sell signal".
>>> FEATURED STOCK ARTICLE : E-Signature Firm is Extended From Any Sound Base - 7/28/2020 |
View all notes |
Set NEW NOTE alert |
Company Profile |
SEC
News |
Chart |
Request a new note
C
A
S
I |
Symbol/Exchange
Company Name
Industry Group |
PRICE |
CHANGE
(%Change) |
Day High |
Volume
(% DAV)
(% 50 day avg vol) |
52 Wk Hi
% From Hi |
Featured
Date |
Price
Featured |
Pivot Featured |
|
Max Buy |
PING
-
NYSE
Ping Identity Hldg Corp
Computer Sftwr-Security
|
$36.35
|
-0.77
-2.07% |
$37.19
|
1,433,847
108.79% of 50 DAV
50 DAV is 1,318,000
|
$37.80
-3.84%
|
6/1/2020
|
$29.24
|
PP = $29.90
|
|
MB = $31.40
|
Most Recent Note - 8/3/2020 5:32:57 PM
G - Posted a solid gain today with light volume for another new all-time high. Its 50 DMA line ($31.51) and prior highs in the $29 area define important near-term support. It has not formed a sound base of sufficient length. Completed Secondary Offerings on 7/09/20 and 5/15/20.
>>> FEATURED STOCK ARTICLE : Consolidating Above 50-Day Moving Average Following Secondary - 7/16/2020 |
View all notes |
Set NEW NOTE alert |
Company Profile |
SEC
News |
Chart |
Request a new note
C
A
S
I |
ZEN
-
NYSE
Zendesk Inc
Computer Sftwr-Enterprse
|
$88.38
|
-2.49
-2.74% |
$91.00
|
2,007,269
89.77% of 50 DAV
50 DAV is 2,235,900
|
$101.94
-13.30%
|
7/21/2020
|
$94.29
|
PP = $94.97
|
|
MB = $99.72
|
Most Recent Note - 8/7/2020 5:46:47 PM
G - Color code is changed to green while slumping further into the prior base as its Relative Strength Rating has fallen to 74, below the 80+ minimum guideline for buy candidates. Testing the 50 DMA line ($88.57) which defines important near term support, and any loss and subsequent violation may trigger a technical sell signal. Weak action came after it reported Jun '20 quarterly earnings +180% on +27% sales revenues versus the year-ago period.
>>> FEATURED STOCK ARTICLE : Pullback Below Pivot Point Following Breakout Gain - 7/21/2020 |
View all notes |
Set NEW NOTE alert |
Company Profile |
SEC
News |
Chart |
Request a new note
C
A
S
I |
|
|
|
THESE ARE NOT BUY RECOMMENDATIONS!
Comments contained in the body of this report are technical
opinions only. The material herein has been obtained
from sources believed to be reliable and accurate, however,
its accuracy and completeness cannot be guaranteed.
This site is not an investment advisor, hence it does
not endorse or recommend any securities or other investments.
Any recommendation contained in this report may not
be suitable for all investors and it is not to be deemed
an offer or solicitation on our part with respect to
the purchase or sale of any securities. All trademarks,
service marks and trade names appearing in this report
are the property of their respective owners, and are
likewise used for identification purposes only.
This report is a service available
only to active Paid Premium Members.
You may opt-out of receiving report notifications
at any time. Questions or comments may be submitted
by writing to Premium Membership Services 665 S.E. 10 Street, Suite 201 Deerfield Beach, FL 33441-5634 or by calling 1-800-965-8307
or 954-785-1121.
|
|
|