You are not logged in.
This means you
CAN ONLY VIEW reports that were published prior to Sunday, February 18, 2024.
You
MUST UPGRADE YOUR MEMBERSHIP if you want to see any current reports.
AFTER MARKET UPDATE - WEDNESDAY, AUGUST 7TH, 2019
Previous After Market Report Next After Market Report >>>
|
|
|
|
DOW |
-22.45 |
26,007.07 |
-0.09% |
|
Volume |
1,011,173,150 |
+9% |
|
Volume |
2,470,575,290 |
+11% |
|
NASDAQ |
+29.56 |
7,862.83 |
+0.38% |
|
Advancers |
1,328 |
47% |
|
Advancers |
1,525 |
50% |
|
S&P 500 |
+2.21 |
2,883.98 |
+0.08% |
|
Decliners |
1,525 |
53% |
|
Decliners |
1,551 |
50% |
|
Russell 2000 |
-1.40 |
1,500.69 |
-0.09% |
|
52 Wk Highs |
145 |
|
|
52 Wk Highs |
83 |
|
|
S&P 600 |
+0.89 |
922.68 |
+0.10% |
|
52 Wk Lows |
234 |
|
|
52 Wk Lows |
216 |
|
|
 |
Major Indices Rebounded From Deeper Losses
Kenneth J. Gruneisen - Passed the CAN SLIM® Master's Exam
After falling 600 points in early trading, the Dow finished just 22 points lower on the session. The S&P 500 eked out a gain of less than 0.1%, while the Nasdaq Composite advanced 0.4% after each benchmark clawed back a 2% morning retreat. Volume totals reported were higher than the prior session totals on the NYSE and on the Nasdaq exchange. Breadth was slightly negative on the NYSE and on the Nasdaq exchange. There were 33 high-ranked companies from the Leaders List hit new 52-week highs and were listed on the BreakOuts Page, versus the total of 15 on the prior session. New 52-week lows outnumbered new 52-week highs on the NYSE and on the Nasdaq exchange. The major indices (M criteria) have shown distributional action indicative of a market correction. During market corrections new buying efforts are avoided and disciplined investors reduce exposure by selling stocks that trigger sell signals on a case-by-case basis. The Featured Stocks Page provides the most timely analysis on high-ranked leaders.Charts used courtesy of www.stockcharts.com
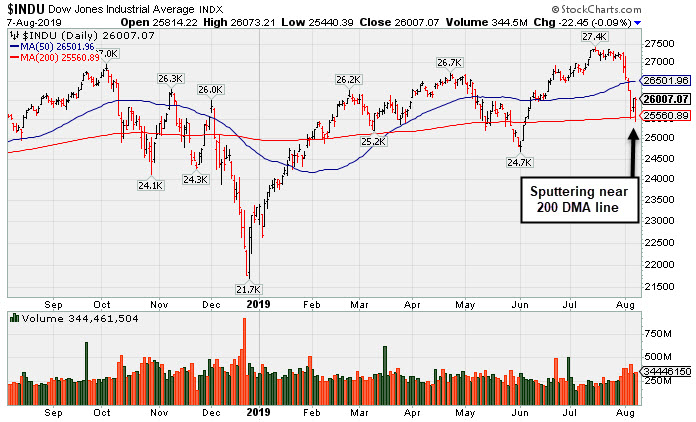
PICTURED: The Dow Jones Industrial Average is sputtering near its 200-day moving average (DMA) line.
Stocks finished little-changed Wednesday, as a rally in traditionally defensive sectors helped the U.S. major averages stage their largest rebound of 2019. Six of 11 S&P 500 sectors finished in positive territory with Real Estate and Consumer Staples shares pacing the gains. Materials also outperformed amid strength in mining shares. COMEX gold added another 1.8% to close near a six-year high of $1498.30/ounce.
Energy stocks lagged, as WTI crude slumped another 3.8% to $51.58/barrel following an unexpected buildup in U.S. stockpiles. In earnings, Disney (DIS -4.9%) had its worst session since 2015 after the media giant missed Wall Street earnings and revenue projections. CVS Health (CVS +5.3%)moved in the other direction after easily topping analyst profit estimates and raising forward guidance. Match Group (MGRP +24.2%) rose after the online dating company posted a larger-than-anticipated jump in subscribers.
Wednesday was also a wild day in fixed income, with the yield on benchmark 10-year notes finishing essentially unchanged at 1.71%. The benchmark yield had fallen below 1.60% for the first time since 2016 earlier in the day, but sentiment seemed to turn following a $27 billion auction of the maturity. On the data front, a report showed mortgage applications jumped 5.3% in the most recent week as consumers react to lower interest rates.
|
 Kenneth J. Gruneisen started out as a licensed stockbroker in August 1987, a couple of months prior to the historic stock market crash that took the Dow Jones Industrial Average down -22.6% in a single day. He has published daily fact-based fundamental and technical analysis on high-ranked stocks online for two decades. Through FACTBASEDINVESTING.COM, Kenneth provides educational articles, news, market commentary, and other information regarding proven investment systems that work in good times and bad.
Comments contained in the body of this report are technical opinions only and are not necessarily those of Gruneisen Growth Corp. The material herein has been obtained from sources believed to be reliable and accurate, however, its accuracy and completeness cannot be guaranteed. Our firm, employees, and customers may effect transactions, including transactions contrary to any recommendation herein, or have positions in the securities mentioned herein or options with respect thereto. Any recommendation contained in this report may not be suitable for all investors and it is not to be deemed an offer or solicitation on our part with respect to the purchase or sale of any securities. |
|
 |
Gold & Silver Index, Retail, and Biotech Indexes Ended Higher
Kenneth J. Gruneisen - Passed the CAN SLIM® Master's Exam
The Broker/Dealer Index ($XBD -1.65%) and Bank Index ($BKX -2.13%) both lost ground while the Retail Index ($RLX +0.17%) eked out a small gain. The Semiconductor Index ($SOX +0.72%) and Biotech Index ($BTK +0.57%) each posted modest gains while the Networking Index ($NWX -0.20%) edged lower. The Gold & Silver Index ($XAU +1.84%) tallied a solid gain, meanwhile, the Integrated Oil Index ($XOI -0.74%) and the Oil Services Index ($OSX -1.79%) both slumped.
Charts courtesy of www.stockcharts.com
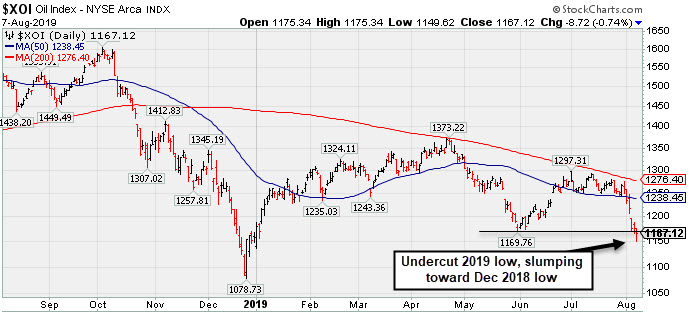
PICTURED: The Integrated Oil Index ($XOI -0.74%) undercut its 2019 low, slumping toward the December 2018 low.
| Oil Services |
$OSX |
67.28 |
-1.22 |
-1.78% |
-16.53% |
| Integrated Oil |
$XOI |
1,167.12 |
-8.72 |
-0.74% |
+0.69% |
| Semiconductor |
$SOX |
1,452.12 |
+10.35 |
+0.72% |
+25.71% |
| Networking |
$NWX |
563.09 |
-1.16 |
-0.20% |
+15.23% |
| Broker/Dealer |
$XBD |
255.27 |
-4.27 |
-1.65% |
+7.56% |
| Retail |
$RLX |
2,278.76 |
+3.77 |
+0.17% |
+16.78% |
| Gold & Silver |
$XAU |
96.05 |
+1.74 |
+1.84% |
+35.93% |
| Bank |
$BKX |
93.38 |
-2.04 |
-2.14% |
+8.85% |
| Biotech |
$BTK |
4,565.35 |
+25.76 |
+0.57% |
+8.16% |
|
|
|
 |
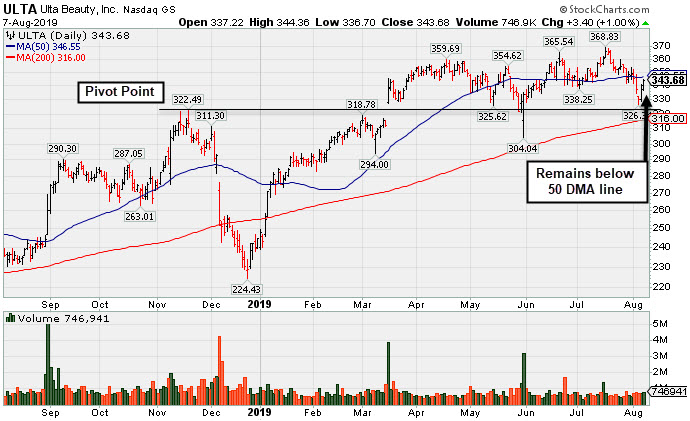
Ulta Beauty Sputtering Below 50-Day Moving Average
Kenneth J. Gruneisen - Passed the CAN SLIM® Master's Exam
Ulta Beauty Inc (ULTA +$3.40 or +1.00% to $343.68) is still sputtering below its 50-day moving average (DMA) line ($346.55). Volume totals have near average and it is still hovering near its all-time high. A rebound above the 50 DMA line would help its outlook improve.
It rebounded from a deep early loss on 5/31/19 after gapping down. It reported earnings +17% on +13% sales revenues for the Apr '19 quarter, below the +25% minimum earnings guideline (C criteria), raising fundamental concerns. Earnings increases were above the +25% minimum guideline (C criteria) in the prior 4 quarterly comparisons. Its solid annual earnings (A criteria) history is very reassuring.
ULTA was last shown in this FSU section on 7/05/19 with an annotated graph under the headline, "Stalled After Recently Wedging to New Record High". It was highlighted in yellow in the 3/15/19 mid-day report with new pivot point based on its 11/19/18 high plus 10 cents (read here). A big "breakaway gap" on 3/15/19 backed by heavy volume triggered a technical buy signal.
It still has a small supply (S criteria) of only 58.5 million shares outstanding. The number of top-rated funds with an ownership interest has grown from 566 funds in Jun '14 to 1,723 funds as of Jun '19, which is a very encouraging sign of increasing institutional interest (the I criteria). Its current Up/Down Volume Ratio of 1.0 is an unbiased indication its shares have been neutral concerning accumulation/distribution over the past 50 days.
|
|
|
Color Codes Explained :
Y - Better candidates highlighted by our
staff of experts.
G - Previously featured
in past reports as yellow but may no longer be buyable under the
guidelines.
***Last / Change / Volume data in this table is the closing quote data***
Symbol/Exchange
Company Name
Industry Group |
PRICE |
CHANGE
(%Change) |
Day High |
Volume
(% DAV)
(% 50 day avg vol) |
52 Wk Hi
% From Hi |
Featured
Date |
Price
Featured |
Pivot Featured |
|
Max Buy |
 SPSC
-
NASDAQ
SPSC
-
NASDAQ
S P S Commerce Inc
COMPUTER SOFTWARE and SERVICES - Application Software
|
$107.34
|
+1.65
1.56% |
$107.74
|
96,226
71.81% of 50 DAV
50 DAV is 134,000
|
$118.28
-9.25%
|
6/7/2019
|
$107.72
|
PP = $115.10
|
|
MB = $120.86
|
Most Recent Note - 8/5/2019 4:23:30 PM
Y - Pulled back near its 50 DMA line ($104.83) which defines important near-term support. Stalled after a gap up and big volume-driven gain noted on 7/26/19. Subsequent gains and a strong close above the pivot point may clinch a convincing new (or add-on) technical buy signal. Reported earnings +22% on +12% sales revenues for the Jun '19 quarter, slightly under the +25% minimum earnings guideline (C criteria), raising fundamental concerns.
>>> FEATURED STOCK ARTICLE : Recently Sputtering Below 50-Day Moving Average - 7/9/2019 |
View all notes |
Set NEW NOTE alert |
Company Profile |
SEC
News |
Chart |
Request a new note
C
A
S
I |
EPAM
-
NYSE
Epam Systems Inc
COMPUTER SOFTWARE and SERVICES - Information Technology Service
|
$179.70
|
-0.21
-0.12% |
$180.79
|
548,680
111.52% of 50 DAV
50 DAV is 492,000
|
$201.00
-10.60%
|
5/9/2019
|
$169.25
|
PP = $180.55
|
|
MB = $189.58
|
Most Recent Note - 8/5/2019 4:05:28 PM
G - Gapped down violating its 50 DMA line ($181.53) and prior highs in the $179-180 area triggering technical sell signals with today's 6th consecutive loss, and its color code is changed to green. Due to report earnings news before the open on Thursday, August 8, 2019. A prompt rebound above its 50 DMA line is needed for its outlook to improve.
>>> FEATURED STOCK ARTICLE : Winning Streak Leaves IT Firm Extended From Prior Base - 7/12/2019 |
View all notes |
Set NEW NOTE alert |
Company Profile |
SEC
News |
Chart |
Request a new note
C
A
S
I |
AUDC
-
NASDAQ
Audiocodes Ltd
ELECTRONICS - Scientific and Technical Instrum
|
$18.61
|
+0.07
0.38% |
$18.73
|
97,006
55.43% of 50 DAV
50 DAV is 175,000
|
$19.74
-5.72%
|
7/15/2019
|
$17.10
|
PP = $17.54
|
|
MB = $18.42
|
Most Recent Note - 8/5/2019 4:01:44 PM
Y - Color code is changed to yellow after retreating below its "max buy" level amid widespread market weakness (M criteria). Reported earnings +57% on +14% sales revenues for the Jun '19 quarter, continuing its strong earnings track record. Prior highs in the $17 area define initial support above its 50 DMA line ($16.18).
>>> FEATURED STOCK ARTICLE : Posted a Gain With Average Volume for Best Ever Close - 7/15/2019 |
View all notes |
Set NEW NOTE alert |
Company Profile |
SEC
News |
Chart |
Request a new note
C
A
S
I |
ENV
-
NYSE
Envestnet Inc
FINANCIAL SERVICES - Diversified Investments
|
$64.82
|
-0.67
-1.02% |
$65.92
|
464,587
170.80% of 50 DAV
50 DAV is 272,000
|
$73.94
-12.33%
|
3/15/2019
|
$66.05
|
PP = $64.90
|
|
MB = $68.15
|
Most Recent Note - 8/5/2019 5:40:28 PM
G - After violating its 50 DMA line and triggering a technical sell signal last week, today's gap down and 6th consecutive loss is tested prior lows in the $65-66 area defining important support. Due to report second quarter financial results on Wednesday, August 7, 2019 after the close. Fundamental concerns were raised after it reported earnings +5% on +1% sales revenues for the Mar '19 quarter, below the +25% minimum earnings guideline (C criteria). See the latest FSU analysis for more details and a new annotated graph.
>>> FEATURED STOCK ARTICLE : Technical Damage Mounts Ahead of Next Quarterly Report - 8/5/2019 |
View all notes |
Set NEW NOTE alert |
Company Profile |
SEC
News |
Chart |
Request a new note
C
A
S
I |
LHCG
-
NASDAQ
L H C Group Inc
HEALTH SERVICES - Home Health Care
|
$123.40
|
+1.67
1.37% |
$124.26
|
176,663
81.79% of 50 DAV
50 DAV is 216,000
|
$129.37
-4.61%
|
7/1/2019
|
$110.94
|
PP = $122.20
|
|
MB = $128.31
|
Most Recent Note - 8/1/2019 5:53:08 PM
Y - Pulled back today with higher volume after quietly touching a new all-time high on the prior session. Recent gains above its pivot point were not backed by the +40% above average volume needed to trigger a proper new (or add-on) technical buy signal. Its 50 DMA line ($118.98) defines near-term support above recent lows. Due to report earnings news on 8/07/19.
>>> FEATURED STOCK ARTICLE : Consolidating Following a Negative Reversal at High - 7/22/2019 |
View all notes |
Set NEW NOTE alert |
Company Profile |
SEC
News |
Chart |
Request a new note
C
A
S
I |
Symbol/Exchange
Company Name
Industry Group |
PRICE |
CHANGE
(%Change) |
Day High |
Volume
(% DAV)
(% 50 day avg vol) |
52 Wk Hi
% From Hi |
Featured
Date |
Price
Featured |
Pivot Featured |
|
Max Buy |
CHDN
-
NASDAQ
Churchill Downs Inc
LEISURE - Gaming Activities
|
$117.28
|
-1.16
-0.98% |
$118.47
|
245,455
89.58% of 50 DAV
50 DAV is 274,000
|
$132.73
-11.64%
|
7/22/2019
|
$118.45
|
PP = $118.89
|
|
MB = $124.83
|
Most Recent Note - 8/6/2019 8:57:41 PM
Y - Found support above its 50 DMA line ($114) with a gain on lighter volume. Reported Jun '19 earnings rose +10% on +26% sales revenues versus the year ago period, below the +25% minimum earnings guideline (C criteria). The prior low ($108.57 on 6/25/19) defines the next important near-term support to watch below its 50 DMA line.
>>> FEATURED STOCK ARTICLE : Volume Light While Hovering at Record High - 7/16/2019 |
View all notes |
Set NEW NOTE alert |
Company Profile |
SEC
News |
Chart |
Request a new note
C
A
S
I |
LULU
-
NASDAQ
Lululemon Athletica
MANUFACTURING - Textile Manufacturing
|
$181.36
|
+1.73
0.96% |
$181.59
|
1,009,329
46.88% of 50 DAV
50 DAV is 2,153,000
|
$194.25
-6.64%
|
6/13/2019
|
$174.48
|
PP = $179.60
|
|
MB = $188.58
|
Most Recent Note - 8/2/2019 1:25:48 PM
G - Pulling back from its all-time high with today's 4th consecutive loss with below average volume, undercutting its 50 DMA line ($180.82) and raising concerns. Reported Apr '19 quarterly earnings +35% on +20% sales revenues versus the year ago period.
>>> FEATURED STOCK ARTICLE : Quietly Hovering at All-Time High - 7/17/2019 |
View all notes |
Set NEW NOTE alert |
Company Profile |
SEC
News |
Chart |
Request a new note
C
A
S
I |
ULTA
-
NASDAQ
Ulta Beauty Inc
SPECIALTY RETAIL - Specialty Retail, Other
|
$343.68
|
+3.40
1.00% |
$344.36
|
756,093
100.54% of 50 DAV
50 DAV is 752,000
|
$368.83
-6.82%
|
3/15/2019
|
$341.27
|
PP = $322.59
|
|
MB = $338.72
|
 Most Recent Note - 8/7/2019 6:54:44 PM
G - Still sputtering below its 50 DMA line ($346.55). Volume totals have been near average while still hovering near its all-time high. Reported earnings +17% on +13% sales revenues for the Apr '19 quarter, below the +25% minimum earnings guideline (C criteria), raising fundamental concerns. See the latest FSU analysis for more details and a new annotated graph.
>>> FEATURED STOCK ARTICLE : Ulta Beauty Sputtering Below 50-Day Moving Average - 8/7/2019 |
View all notes |
Set NEW NOTE alert |
Company Profile |
SEC
News |
Chart |
Request a new note
C
A
S
I |
CHGG
-
NYSE
Chegg Inc
Consumer Svcs-Education
|
$43.46
|
-0.04
-0.09% |
$43.71
|
980,620
64.39% of 50 DAV
50 DAV is 1,523,000
|
$48.22
-9.87%
|
7/8/2019
|
$44.11
|
PP = $41.79
|
|
MB = $43.88
|
Most Recent Note - 8/7/2019 6:57:18 PM
Y - Volume totals have been cooling while consolidating above prior highs in the $40-41 area which define important near-term support to watch along with its 50 DMA line ($40.99). Reported earnings +92% on +26% sales revenues for the Jun '19 quarter. See the latest FSU analysis for more details and an annotated graph.
>>> FEATURED STOCK ARTICLE : Consolidating Above Prior Highs and 50-Day Average - 8/6/2019 |
View all notes |
Set NEW NOTE alert |
Company Profile |
SEC
News |
Chart |
Request a new note
C
A
S
I |
VEEV
-
NYSE
Veeva Systems Inc Cl A
Computer Sftwr-Medical
|
$159.85
|
-0.57
-0.36% |
$161.36
|
963,591
57.70% of 50 DAV
50 DAV is 1,670,000
|
$176.90
-9.64%
|
5/30/2019
|
$154.32
|
PP = $145.80
|
|
MB = $153.09
|
Most Recent Note - 8/5/2019 4:15:49 PM
G - Undercut yet closed above the prior low ($155 on 6/27/19) as it gapped down below its 50 DMA line ($163.58) with today's 3rd consecutive loss raising greater concerns. Fundamentals remain strong.
>>> FEATURED STOCK ARTICLE : Recently Found Support Near 50-Day Moving Average - 8/1/2019 |
View all notes |
Set NEW NOTE alert |
Company Profile |
SEC
News |
Chart |
Request a new note
C
A
S
I |
Symbol/Exchange
Company Name
Industry Group |
PRICE |
CHANGE
(%Change) |
Day High |
Volume
(% DAV)
(% 50 day avg vol) |
52 Wk Hi
% From Hi |
Featured
Date |
Price
Featured |
Pivot Featured |
|
Max Buy |
PAYC
-
NYSE
Paycom Software Inc
COMPUTER SOFTWARE and SERVICES - Application Software
|
$231.20
|
+5.89
2.61% |
$232.50
|
588,157
80.13% of 50 DAV
50 DAV is 734,000
|
$246.85
-6.34%
|
2/6/2019
|
$171.66
|
PP = $164.18
|
|
MB = $172.39
|
Most Recent Note - 8/5/2019 4:09:03 PM
G - Gapped down and violated its 50 DMA line with today's volume-driven loss triggering a technical sell signal. Last week it reported earnings +27% on +31% sales revenues for the Jun '19 quarter, continuing its strong earnings track record. See the latest FSU analysis for more details and an annotated graph.
>>> FEATURED STOCK ARTICLE : Found Support and Gapped Up Following Earnings Report - 8/2/2019 |
View all notes |
Set NEW NOTE alert |
Company Profile |
SEC
News |
Chart |
Request a new note
C
A
S
I |
PLNT
-
NYSE
Planet Fitness Inc Cl A
Leisure-Services
|
$72.25
|
-5.25
-6.77% |
$75.18
|
4,878,593
327.64% of 50 DAV
50 DAV is 1,489,000
|
$81.90
-11.78%
|
7/26/2019
|
$79.15
|
PP = $82.00
|
|
MB = $86.10
|
Most Recent Note - 8/7/2019 12:36:46 PM
G - Color code is changed to green after it gapped down today slumping well below its 50 DMA line ($76.70) with today's big volume-driven loss raising concerns. Reported earnings +32% on +29% sales revenues for the Jun '19 quarter continuing its strong earnings track record.
>>> FEATURED STOCK ARTICLE : Fitness Firm Forming a New Base - 7/26/2019 |
View all notes |
Set NEW NOTE alert |
Company Profile |
SEC
News |
Chart |
Request a new note
C
A
S
I |
BLD
-
NYSE
Topbuild Corp
Bldg-Constr Prds/Misc
|
$90.97
|
+2.63
2.98% |
$91.24
|
322,972
97.57% of 50 DAV
50 DAV is 331,000
|
$91.49
-0.57%
|
5/17/2019
|
$82.19
|
PP = $87.31
|
|
MB = $91.68
|
Most Recent Note - 8/7/2019 7:00:45 PM
Y - Posted a gain with average volume today for a best-ever close, perched at its all-time high. Bullish action came after it reported earnings +39% on +9% sales revenues for the Jun '19 quarter versus the year ago period, continuing its strong earnings track record. Its gain above the pivot point on 8/02/19 was backed by +81% above average volume clinching a convincing technical buy signal. Its 50 DMA line ($81.43) and recent lows define near-term support to watch on pullbacks.
>>> FEATURED STOCK ARTICLE : Perched Near 52-Week High Finding Support - 7/25/2019 |
View all notes |
Set NEW NOTE alert |
Company Profile |
SEC
News |
Chart |
Request a new note
C
A
S
I |
TEAM
-
NASDAQ
Atlassian Corp Plc Cl A
Comp Sftwr-Spec Enterprs
|
$141.90
|
+6.43
4.75% |
$142.82
|
2,390,504
182.20% of 50 DAV
50 DAV is 1,312,000
|
$149.80
-5.27%
|
5/24/2019
|
$129.52
|
PP = $132.09
|
|
MB = $138.69
|
Most Recent Note - 8/7/2019 6:56:15 PM
Y - Posted a gain with above average volume, finding support above its 50 DMA line ($133.45). Its prior low ($123.43 on 6/25/19) defines important near-term support to watch where a violation would raise serious concerns and trigger a more worrisome technical sell signal. Reported earnings +43% on +36% sales revenues for the Jun '19 quarter, continuing its strong earnings track record.
>>> FEATURED STOCK ARTICLE : Abrupt Retreat After Getting Very Extended From Prior Base - 7/29/2019 |
View all notes |
Set NEW NOTE alert |
Company Profile |
SEC
News |
Chart |
Request a new note
C
A
S
I |
GLOB
-
NYSE
Globant SA
Computer-Tech Services
|
$102.89
|
-2.03
-1.93% |
$104.96
|
370,979
89.61% of 50 DAV
50 DAV is 414,000
|
$112.33
-8.40%
|
2/15/2019
|
$69.35
|
PP = $70.00
|
|
MB = $73.50
|
Most Recent Note - 8/5/2019 4:17:25 PM
G - Pulled back from its all-time high with today's 2nd consecutive loss on below average volume. Very extended from any sound base. Its 50 DMA line ($101.55) defines important support to watch. Fundamentals remain strong.
>>> FEATURED STOCK ARTICLE : Extended From Any Sound Base After Wedging Higher - 7/11/2019 |
View all notes |
Set NEW NOTE alert |
Company Profile |
SEC
News |
Chart |
Request a new note
C
A
S
I |
Symbol/Exchange
Company Name
Industry Group |
PRICE |
CHANGE
(%Change) |
Day High |
Volume
(% DAV)
(% 50 day avg vol) |
52 Wk Hi
% From Hi |
Featured
Date |
Price
Featured |
Pivot Featured |
|
Max Buy |
TTD
-
NASDAQ
The Trade Desk Inc Cl A
Comml Svcs-Advertising
|
$257.23
|
+5.36
2.13% |
$259.40
|
997,470
69.17% of 50 DAV
50 DAV is 1,442,000
|
$279.71
-8.04%
|
7/18/2019
|
$240.61
|
PP = $258.10
|
|
MB = $271.01
|
Most Recent Note - 8/5/2019 1:02:06 PM
Y - Amid widespread weakness today it is undercutting the prior high ($258) and negating the recent breakout. The next important support to watch is its 50 DMA line ($238.94). Due to report earnings news on 8/08/19.
>>> FEATURED STOCK ARTICLE : Endured Distributional Pressure While Building on New Base - 7/18/2019 |
View all notes |
Set NEW NOTE alert |
Company Profile |
SEC
News |
Chart |
Request a new note
C
A
S
I |
PAGS
-
NYSE
Pagseguro Digital Cl A
Finance-CrdtCard/PmtPr
|
$44.78
|
-0.01
-0.02% |
$44.92
|
1,542,884
68.30% of 50 DAV
50 DAV is 2,259,000
|
$48.88
-8.39%
|
6/25/2019
|
$37.69
|
PP = $40.07
|
|
MB = $42.07
|
Most Recent Note - 8/6/2019 8:54:36 PM
G - Posted a gain today with light volume. Prior high in the $40 area defines initial support to watch along with its 50 DMA line ($39.95).
>>> FEATURED STOCK ARTICLE : Encountering Distributional Pressure After Impressive Sprint - 7/30/2019 |
View all notes |
Set NEW NOTE alert |
Company Profile |
SEC
News |
Chart |
Request a new note
C
A
S
I |
|
|
|
THESE ARE NOT BUY RECOMMENDATIONS!
Comments contained in the body of this report are technical
opinions only. The material herein has been obtained
from sources believed to be reliable and accurate, however,
its accuracy and completeness cannot be guaranteed.
This site is not an investment advisor, hence it does
not endorse or recommend any securities or other investments.
Any recommendation contained in this report may not
be suitable for all investors and it is not to be deemed
an offer or solicitation on our part with respect to
the purchase or sale of any securities. All trademarks,
service marks and trade names appearing in this report
are the property of their respective owners, and are
likewise used for identification purposes only.
This report is a service available
only to active Paid Premium Members.
You may opt-out of receiving report notifications
at any time. Questions or comments may be submitted
by writing to Premium Membership Services 665 S.E. 10 Street, Suite 201 Deerfield Beach, FL 33441-5634 or by calling 1-800-965-8307
or 954-785-1121.
|
|
|