You are not logged in.
This means you
CAN ONLY VIEW reports that were published prior to Monday, February 19, 2024.
You
MUST UPGRADE YOUR MEMBERSHIP if you want to see any current reports.
AFTER MARKET UPDATE - THURSDAY, AUGUST 6TH, 2020
Previous After Market Report Next After Market Report >>>
|
|
|
|
DOW |
+185.46 |
27,386.98 |
+0.68% |
|
Volume |
806,731,613 |
-10% |
|
Volume |
4,047,218,400 |
-2% |
|
NASDAQ |
+106.76 |
11,105.16 |
+0.97% |
|
Advancers |
1,458 |
50% |
|
Advancers |
1,487 |
46% |
|
S&P 500 |
+21.39 |
3,349.16 |
+0.64% |
|
Decliners |
1,479 |
50% |
|
Decliners |
1,766 |
54% |
|
Russell 2000 |
-1.61 |
1,544.62 |
-0.10% |
|
52 Wk Highs |
113 |
|
|
52 Wk Highs |
213 |
|
|
S&P 600 |
-4.61 |
896.00 |
-0.51% |
|
52 Wk Lows |
6 |
|
|
52 Wk Lows |
8 |
|
|
 |
Major Indices Rose With Less Volume and Less Leadership
Kenneth J. Gruneisen - Passed the CAN SLIM® Master's Exam
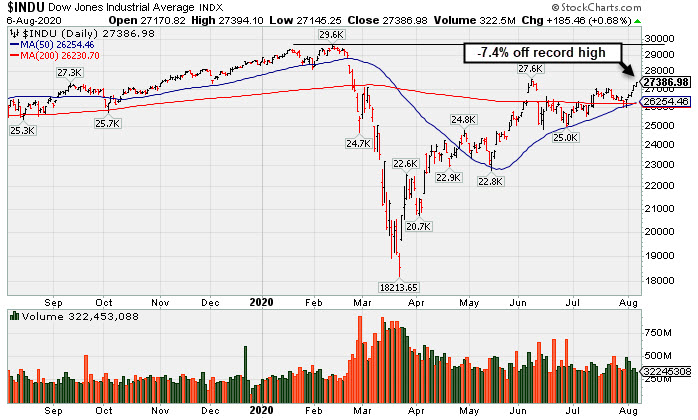
The Dow rose 185 points, while the S&P 500 advanced 0.6%. The Nasdaq Composite rallied 1% to its 32nd all-time high this year. The reported volume totals were lighter than the prior session on the NYSE and on the Nasdaq exchange, indicative of less buying conviction from the institutional crowd. Decliners and advancers were evenly mixed on the NYSE and decliners led advancers by a 6-5 margin on the Nasdaq exchange. Leadership waned as there were 75 high-ranked companies from the Leaders List that hit new 52-week highs and were listed on the BreakOuts Page, versus the total of 124 on the prior session. New 52-week highs totals contracted yet still solidly outnumbered new 52-week lows totals which were in the single digits on both the NYSE and the Nasdaq exchange. The major indices are in a confirmed uptrend (M criteria). Any sustainable rally requires a healthy crop of new leaders, so it remains ever-important to see substantial new highs totals. Charts used courtesy of www.stockcharts.com
PICTURED: The Dow Jones Industrial Average is consolidating -7.4% off its record high. Stocks advanced on Thursday, as investors remained hopeful that Washington would reach a consensus on a fifth coronavirus relief bill. President Trump told reporters that he expects to sign an executive order this weekend to extend federal unemployment benefits and enact a payroll tax holiday amid the stalemate. However, analysts are skeptical of the action due to the legal challenges it would face.
A better-than-anticipated weekly initial jobless claims update also buoyed sentiment. The report showed roughly 1.2 million Americans filed for unemployment in the week ending August 1, which was lower than consensus expectations of 1.4 million. This comes ahead of Friday’s more comprehensive non-farm payrolls report, with President Trump boosting expectations on Wednesday by saying, "a big number coming out Friday on jobs." Treasuries strengthened with the yield on the 10-year note off one basis point to 0.54%. COMEX gold extend its recent rally, rising 1.2% to $2,054.70/ounce.
Seven of 11 S&P 500 sectors finished in positive territory. Communication Services paced the gains, with Facebook (FB +6.49%) rallying to an all-time high after launching a feature on its Instagram application that would rival social medial platform TikTok. In earnings, Western Digital Corp. (WDC -16.12%) fell following disappointing revenue figures and weak current-quarter guidance. ViacomCBS (VIAC +3.42%) rose after citing strong growth in its streaming segment following an earnings beat. Meanwhile, Roku (ROKU -6.98%) slumped after providing a downbeat outlook around advertising uncertainty.
|
 Kenneth J. Gruneisen started out as a licensed stockbroker in August 1987, a couple of months prior to the historic stock market crash that took the Dow Jones Industrial Average down -22.6% in a single day. He has published daily fact-based fundamental and technical analysis on high-ranked stocks online for two decades. Through FACTBASEDINVESTING.COM, Kenneth provides educational articles, news, market commentary, and other information regarding proven investment systems that work in good times and bad.
Comments contained in the body of this report are technical opinions only and are not necessarily those of Gruneisen Growth Corp. The material herein has been obtained from sources believed to be reliable and accurate, however, its accuracy and completeness cannot be guaranteed. Our firm, employees, and customers may effect transactions, including transactions contrary to any recommendation herein, or have positions in the securities mentioned herein or options with respect thereto. Any recommendation contained in this report may not be suitable for all investors and it is not to be deemed an offer or solicitation on our part with respect to the purchase or sale of any securities. |
|
 |
Retail and Networking Indexes Posted Gains
Kenneth J. Gruneisen - Passed the CAN SLIM® Master's Exam
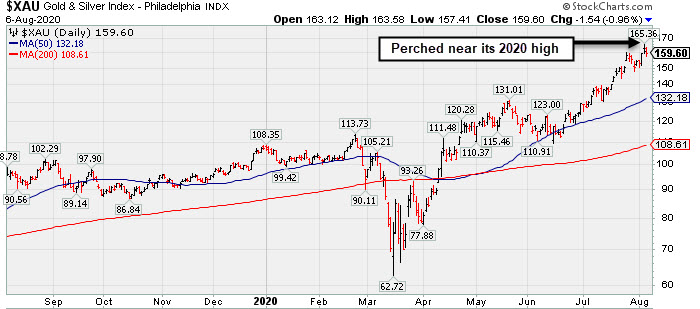
The Retail Index ($RLX +0.42%) posted a small gain while the Bank Index ($BKX -0.48%) and Broker/Dealer Index ($XBD -0.88%) both created a slight drag on the major indices. The Oil Services Index ($OSX -2.55%), Integrated Oil Index ($XOI -0.85%), and the Gold & Silver Index ($XAU -0.92%) finished unanimously lower. The Networking Index ($NWX +2.69%) led the tech sector, meanwhile the Semiconductor Index ($SOX -0.13%) inched lower and the Biotech Index ($BTK -0.57%) suffered a modest loss.
PICTURED: The Gold & Silver Index ($XAU -0.92%) is perched near its 2020 high.
| Oil Services |
$OSX |
37.80 |
-0.99 |
-2.55% |
-51.72% |
| Integrated Oil |
$XOI |
757.77 |
-6.51 |
-0.85% |
-40.36% |
| Semiconductor |
$SOX |
2,204.80 |
-2.76 |
-0.13% |
+19.20% |
| Networking |
$NWX |
623.64 |
+16.34 |
+2.69% |
+6.90% |
| Broker/Dealer |
$XBD |
285.72 |
-2.54 |
-0.88% |
-1.60% |
| Retail |
$RLX |
3,387.60 |
+14.02 |
+0.42% |
+38.31% |
| Gold & Silver |
$XAU |
159.65 |
-1.49 |
-0.92% |
+49.32% |
| Bank |
$BKX |
75.03 |
-0.36 |
-0.48% |
-33.81% |
| Biotech |
$BTK |
5,673.84 |
-32.53 |
-0.57% |
+11.97% |
|
|
|
 |
Bullish Action Continued After Latest Strong Earnings Report
Kenneth J. Gruneisen - Passed the CAN SLIM® Master's Exam
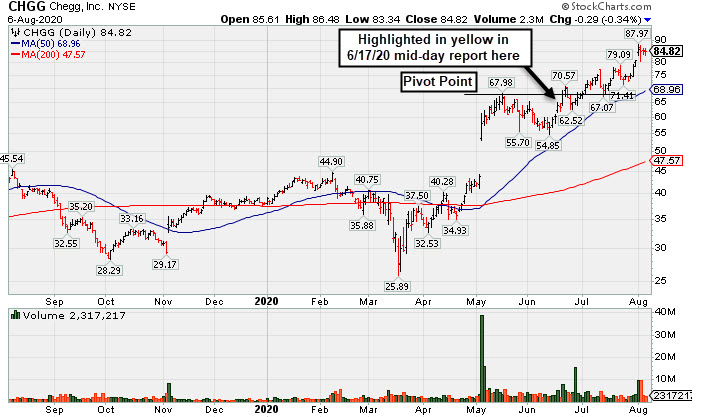
Chegg Inc (CHGG -$0.29 or -0.34% to $84.82) has been hovering near its all-time high since gapping up on 8/03/20. It is very extended from any sound base. Bullish action came after it reported Jun '20 quarterly earnings +61% on +63% sales revenues versus the year ago period, maintaining its long streak of earnings increases well above the +25% minimum earnings guideline (C criteria). Annual earnings (A criteria) have been growing at a strong pace since turning profitable in FY '16 following years of losses.
The prior high in the $68 area defines support to watch coinciding with its 50-day moving average (DMA) line ($68.96) where any losses leading to violations would raise concerns and trigger technical sell signals.
It completed its $13 IPO in November of 2013 and another new Public Offering in August of 2017. It has 123.6 million shares outstanding. The number of high-ranked funds owning its shares rose from 360 in Sep '18 to 586 in Jun '20, a reassuring sign concerning the I criteria. Its current Up/Down Volume Ratio of 1.7 is an unbiased indication its shares have been under accumulation over the past 50 days. It has earned a Timeliness Rating of B and Sponsorship Rating of C. |
|
|
Color Codes Explained :
Y - Better candidates highlighted by our
staff of experts.
G - Previously featured
in past reports as yellow but may no longer be buyable under the
guidelines.
***Last / Change / Volume data in this table is the closing quote data***
Symbol/Exchange
Company Name
Industry Group |
PRICE |
CHANGE
(%Change) |
Day High |
Volume
(% DAV)
(% 50 day avg vol) |
52 Wk Hi
% From Hi |
Featured
Date |
Price
Featured |
Pivot Featured |
|
Max Buy |
 FTNT
-
NASDAQ
FTNT
-
NASDAQ
Fortinet Inc
Computer Sftwr-Security
|
$139.51
|
-0.61
-0.44% |
$140.79
|
1,511,110
95.28% of 50 DAV
50 DAV is 1,586,000
|
$151.95
-8.19%
|
6/22/2020
|
$142.68
|
PP = $149.79
|
|
MB = $157.28
|
Most Recent Note - 8/3/2020 5:29:27 PM
Y - Due to report earnings news on 8/06/20. Consolidating just above its 50 DMA line ($137). Faces some near-term resistance due to overhead supply up to the $151 level. See the latest FSU analysis for more details and a new annotated graph.
>>> FEATURED STOCK ARTICLE : Rebounded Above 50-Day Average; Earnings News Due on - 8/3/2020 |
View all notes |
Set NEW NOTE alert |
Company Profile |
SEC
News |
Chart |
Request a new note
C
A
S
I |
CRL
-
NYSE
Charles River Labs Intl
DRUGS - Biotechnology
|
$217.80
|
-0.17
-0.08% |
$220.00
|
425,108
109.00% of 50 DAV
50 DAV is 390,000
|
$220.01
-1.00%
|
7/15/2020
|
$192.66
|
PP = $189.95
|
|
MB = $199.45
|
Most Recent Note - 8/5/2020 6:23:58 PM
G - Hit another new all-time high with today's big gain backed by +86% above average volume. Bullish action came after it reported Jun '20 quarterly earnings -3% on +4% sales revenues, below the +25% minimum guideline (C criteria) but better than expected while the company also raised its guidance. The prior high ($189.85 on 6/03/20) defines initial support to watch above its 50 DMA line ($185.50).
>>> FEATURED STOCK ARTICLE : Volume +71% Above Average Behind Breakout - 7/15/2020 |
View all notes |
Set NEW NOTE alert |
Company Profile |
SEC
News |
Chart |
Request a new note
C
A
S
I |
EBS
-
NYSE
Emergent Biosolutions
DRUGS - Biotechnology
|
$126.96
|
-7.50
-5.58% |
$137.61
|
1,276,383
126.63% of 50 DAV
50 DAV is 1,008,000
|
$136.39
-6.91%
|
7/7/2020
|
$89.47
|
PP = $93.68
|
|
MB = $98.36
|
 Most Recent Note - 8/6/2020 5:34:04 PM
G - Reversed into the red after hitting yet another new all-time high today following 6 consecutive gains, getting very extended from any sound base. Bullish action came after it reported Jun '20 quarterly earnings +890% on +62% sales revenue for the Jun '20 quarter versus the year ago period. Prior highs in the $93 area define initial support above its 50 DMA line ($88.06).
>>> FEATURED STOCK ARTICLE : Rally Continues Into Record High Territory - 8/4/2020 |
View all notes |
Set NEW NOTE alert |
Company Profile |
SEC
News |
Chart |
Request a new note
C
A
S
I |
NBIX
-
NASDAQ
Neurocrine Biosciences
DRUGS - Biotechnology
|
$116.02
|
-2.91
-2.45% |
$118.95
|
661,582
79.37% of 50 DAV
50 DAV is 833,500
|
$136.26
-14.85%
|
5/19/2020
|
$123.71
|
PP = $119.75
|
|
MB = $125.74
|
Most Recent Note - 8/4/2020 12:41:18 PM
G - Reported Jun '20 quarterly earnings +100% on +65% sales revenues versus the year ago period. Traded up earlier, but reversed into the red. A rebound and close above the 50 DMA line ($124.34) is needed for its outlook to improve.
>>> FEATURED STOCK ARTICLE : Consolidating Near 50-Day Moving Average; Earnings Report Due - 7/27/2020 |
View all notes |
Set NEW NOTE alert |
Company Profile |
SEC
News |
Chart |
Request a new note
C
A
S
I |
BMRN
-
NASDAQ
Biomarin Pharmaceutical
DRUGS - Drug Manufacturers - Other
|
$119.65
|
-0.18
-0.15% |
$120.66
|
642,541
45.06% of 50 DAV
50 DAV is 1,426,000
|
$131.95
-9.32%
|
6/17/2020
|
$110.95
|
PP = $112.67
|
|
MB = $118.30
|
Most Recent Note - 8/5/2020 6:21:07 PM
G - Quietly held its ground today. After Tuesday's close it reported Jun '20 quarterly earnings +220% on +11% sales revenues versus the year ago period. Volume and volatility often increases near earnings news. Consolidating above its "max buy" level and near its 50 DMA line ($118.77) which defines important near-term support to watch. See the latest FSU analysis for more details and a new annotated graph.
>>> FEATURED STOCK ARTICLE : Hovering Above 50-Day Average After Another Strong Earnings Report - 8/5/2020 |
View all notes |
Set NEW NOTE alert |
Company Profile |
SEC
News |
Chart |
Request a new note
C
A
S
I |
Symbol/Exchange
Company Name
Industry Group |
PRICE |
CHANGE
(%Change) |
Day High |
Volume
(% DAV)
(% 50 day avg vol) |
52 Wk Hi
% From Hi |
Featured
Date |
Price
Featured |
Pivot Featured |
|
Max Buy |
AUDC
-
NASDAQ
Audiocodes Ltd
ELECTRONICS - Scientific and Technical Instrum
|
$35.98
|
-1.61
-4.28% |
$37.90
|
628,624
76.01% of 50 DAV
50 DAV is 827,000
|
$44.94
-19.94%
|
7/17/2020
|
$37.16
|
PP = $40.16
|
|
MB = $42.17
|
Most Recent Note - 8/6/2020 5:36:06 PM
G - Finding support above its 50 DMA line ($34.79) since its slump back below the pivot point and into the prior base raised concerns. More damaging losses would raise greater concerns and trigger a worrisome technical sell signal. Disciplined investors always limit losses by selling any stock that falls more than 7-8% from their purchase price. Reported Jun '20 quarterly earnings +45% on +8% sales revenues versus the year-ago period.
>>> FEATURED STOCK ARTICLE : Resilient and High-Ranked VOIP Firm Rebounding Near Highs - 7/17/2020 |
View all notes |
Set NEW NOTE alert |
Company Profile |
SEC
News |
Chart |
Request a new note
C
A
S
I |
AMD
-
NASDAQ
Advanced Micro Devices
ELECTRONICS - Semiconductor - Broad Line
|
$86.71
|
+1.40
1.64% |
$86.98
|
53,726,924
83.33% of 50 DAV
50 DAV is 64,473,000
|
$86.32
0.45%
|
7/22/2020
|
$61.73
|
PP = $59.10
|
|
MB = $62.06
|
Most Recent Note - 8/4/2020 12:20:29 PM
G - Hitting yet another new all-time high with today's volume-driven gain. Reported earnings +125% on +26% sales revenues for the Jun '20 quarter versus the year ago period. Getting very extended from the previously noted base. Disciplined investors avoid chasing stocks more than +5% above prior highs. The prior highs in the $59 area define initial support to watch on pullbacks.
>>> FEATURED STOCK ARTICLE : Pullback After Breakout Gain Backed by +152% Above Average Volume - 7/23/2020 |
View all notes |
Set NEW NOTE alert |
Company Profile |
SEC
News |
Chart |
Request a new note
C
A
S
I |
TREX
-
NYSE
Trex Company Inc
MATERIALS and CONSTRUCTION - General Building Materials
|
$138.61
|
+0.29
0.21% |
$139.58
|
578,914
60.94% of 50 DAV
50 DAV is 950,000
|
$144.96
-4.38%
|
6/26/2020
|
$109.05
|
PP = $132.94
|
|
MB = $139.59
|
Most Recent Note - 8/4/2020 1:05:17 PM
G - Pulling back today on higher volume after hitting a new all-time high on the prior session with recent gains backed by below average volume. Reported Jun '20 quarterly earnings +27% on +7% sales revenues versus the year ago period. Volume and volatility often increase near earnings news. Important near-term support is at its 50 DMA line ($126.74). See the latest FSU analysis for more details and an annotated graph.
>>> FEATURED STOCK ARTICLE : Perched Near All Time High With Earnings News Due Monday - 7/30/2020 |
View all notes |
Set NEW NOTE alert |
Company Profile |
SEC
News |
Chart |
Request a new note
C
A
S
I |
NFLX
-
NASDAQ
Netflix Inc
SPECIALTY RETAIL - Music and Video Stores
|
$509.08
|
+6.97
1.39% |
$510.82
|
3,708,865
47.96% of 50 DAV
50 DAV is 7,733,000
|
$575.37
-11.52%
|
5/14/2020
|
$441.95
|
PP = $449.62
|
|
MB = $472.10
|
Most Recent Note - 8/4/2020 5:56:17 PM
G - Found support well above its 50 DMA line ($466) and prior highs in the $458 area during the recent consolidation. Extended from the prior base, and consolidating after reporting Jun '20 earnings +165% on +25% sales revenues versus the year ago period.
>>> FEATURED STOCK ARTICLE : Consolidating After Getting Extended From Prior Base - 7/29/2020 |
View all notes |
Set NEW NOTE alert |
Company Profile |
SEC
News |
Chart |
Request a new note
C
A
S
I |
CHGG
-
NYSE
Chegg Inc
Consumer Svcs-Education
|
$84.82
|
-0.29
-0.34% |
$86.48
|
2,264,180
62.48% of 50 DAV
50 DAV is 3,624,000
|
$87.97
-3.58%
|
6/17/2020
|
$63.71
|
PP = $68.08
|
|
MB = $71.48
|
Most Recent Note - 8/6/2020 5:21:47 PM
G - Hovering at its all-time high since a gap up and volume-driven gain on 8/03/20 following earnings news. Very extended from any sound base. Reported Jun '20 quarterly earnings +61% on +63% sales revenues versus the year ago period. Prior high in the $68 area defines support to watch coinciding with its 50 DMA line ($68.96) where any losses leading to violations would raise concerns and trigger technical sell signals. See the latest FSU analysis for more details and a new annotated graph.
>>> FEATURED STOCK ARTICLE : Bullish Action Continued After Latest Strong Earnings Report - 8/6/2020 |
View all notes |
Set NEW NOTE alert |
Company Profile |
SEC
News |
Chart |
Request a new note
C
A
S
I |
Symbol/Exchange
Company Name
Industry Group |
PRICE |
CHANGE
(%Change) |
Day High |
Volume
(% DAV)
(% 50 day avg vol) |
52 Wk Hi
% From Hi |
Featured
Date |
Price
Featured |
Pivot Featured |
|
Max Buy |
LGIH
-
NASDAQ
L G I Homes Inc
Bldg-Resident/Comml
|
$112.85
|
-3.81
-3.27% |
$117.77
|
276,820
78.20% of 50 DAV
50 DAV is 354,000
|
$123.94
-8.95%
|
7/7/2020
|
$99.19
|
PP = $95.82
|
|
MB = $100.61
|
Most Recent Note - 8/3/2020 5:58:47 PM
G - Due to report Jun '20 quarterly earnings news before the open on Tuesday, 8/04/20. Posted a gain today with above average for a new best-ever close, getting very extended from the previously noted base. Prior highs in the $95 area and its 50 DMA line ($96.21) define near-term support to watch on pullbacks.
>>> FEATURED STOCK ARTICLE : Earning News Due Next Week for Homebuilder - 7/31/2020 |
View all notes |
Set NEW NOTE alert |
Company Profile |
SEC
News |
Chart |
Request a new note
C
A
S
I |
NOW
-
NYSE
Servicenow Inc
Computer Sftwr-Enterprse
|
$430.33
|
-5.41
-1.24% |
$439.57
|
2,223,201
129.94% of 50 DAV
50 DAV is 1,711,000
|
$454.70
-5.36%
|
4/30/2020
|
$343.05
|
PP = $363.05
|
|
MB = $381.20
|
Most Recent Note - 8/4/2020 5:57:33 PM
G - Still hovering near its all-time high, stubbornly holding its ground. It has not formed a sound base. Its 50 DMA line ($408.65) defines important near-term support to watch where a violation may trigger a technical sell signal. Reported Jun '20 quarterly earnings +73% on +28% sales revenues versus the year ago period.
>>> FEATURED STOCK ARTICLE : Perched Near All-Time High With Earnings News Due Next Week - 7/22/2020 |
View all notes |
Set NEW NOTE alert |
Company Profile |
SEC
News |
Chart |
Request a new note
C
A
S
I |
TEAM
-
NASDAQ
Atlassian Corp Plc Cl A
Comp Sftwr-Spec Enterprs
|
$177.97
|
-2.53
-1.40% |
$181.46
|
1,913,831
95.03% of 50 DAV
50 DAV is 2,014,000
|
$198.41
-10.30%
|
7/7/2020
|
$190.44
|
PP = $191.82
|
|
MB = $201.41
|
Most Recent Note - 8/6/2020 5:28:08 PM
G - After violating its 50 DMA line ($181) on 7/31/20 with a damaging volume-driven loss, triggering a technical sell signal, that short-term average has been acting as resistance. A rebound above it is needed for its outlook to improve. The prior low ($169.11 on 7/14/20) defines the next important support where any violation would trigger a more worrisome technical sell signal.
>>> FEATURED STOCK ARTICLE : Consolidating Near High With Earnings News Due Soon - 7/24/2020 |
View all notes |
Set NEW NOTE alert |
Company Profile |
SEC
News |
Chart |
Request a new note
C
A
S
I |
TTD
-
NASDAQ
The Trade Desk Inc Cl A
Comml Svcs-Advertising
|
$480.75
|
-15.24
-3.07% |
$494.10
|
1,811,271
110.98% of 50 DAV
50 DAV is 1,632,000
|
$500.00
-3.85%
|
6/3/2020
|
$340.61
|
PP = $327.35
|
|
MB = $343.72
|
Most Recent Note - 8/3/2020 5:35:05 PM
G - Due to report earnings news after the close on Thursday, 8/06/20. Posted a big gain today backed by below average volume and hit a new all-time high, getting very extended from any sound base. Its 50 DMA line ($397.62) defines near-term support to watch.
>>> FEATURED STOCK ARTICLE : Rebounded Near All-Time High With Gain Backed by Light Volume - 7/20/2020 |
View all notes |
Set NEW NOTE alert |
Company Profile |
SEC
News |
Chart |
Request a new note
C
A
S
I |
DOCU
-
NASDAQ
Docusign Inc
Computer Sftwr-Enterprse
|
$215.68
|
-10.34
-4.57% |
$228.50
|
4,483,294
80.81% of 50 DAV
50 DAV is 5,548,000
|
$229.83
-6.16%
|
6/10/2020
|
$149.73
|
PP = $152.10
|
|
MB = $159.71
|
Most Recent Note - 8/6/2020 5:32:38 PM
G - Pulled back from its all-time high with today's loss on higher (near average) volume. Still very extended from any sound base. Its 50 DMA line ($180) defines near-term support to watch. DOCU is now priced +100% above its 200 DMA price, and it is taught in the Certification that a stock trading +70-100% or more above the 200 DMA is to be recognized as a "sell signal".
>>> FEATURED STOCK ARTICLE : E-Signature Firm is Extended From Any Sound Base - 7/28/2020 |
View all notes |
Set NEW NOTE alert |
Company Profile |
SEC
News |
Chart |
Request a new note
C
A
S
I |
Symbol/Exchange
Company Name
Industry Group |
PRICE |
CHANGE
(%Change) |
Day High |
Volume
(% DAV)
(% 50 day avg vol) |
52 Wk Hi
% From Hi |
Featured
Date |
Price
Featured |
Pivot Featured |
|
Max Buy |
PING
-
NYSE
Ping Identity Hldg Corp
Computer Sftwr-Security
|
$37.12
|
+0.11
0.30% |
$37.54
|
1,184,492
88.93% of 50 DAV
50 DAV is 1,332,000
|
$37.80
-1.80%
|
6/1/2020
|
$29.24
|
PP = $29.90
|
|
MB = $31.40
|
Most Recent Note - 8/3/2020 5:32:57 PM
G - Posted a solid gain today with light volume for another new all-time high. Its 50 DMA line ($31.51) and prior highs in the $29 area define important near-term support. It has not formed a sound base of sufficient length. Completed Secondary Offerings on 7/09/20 and 5/15/20.
>>> FEATURED STOCK ARTICLE : Consolidating Above 50-Day Moving Average Following Secondary - 7/16/2020 |
View all notes |
Set NEW NOTE alert |
Company Profile |
SEC
News |
Chart |
Request a new note
C
A
S
I |
ZEN
-
NYSE
Zendesk Inc
Computer Sftwr-Enterprse
|
$90.87
|
-0.61
-0.67% |
$91.89
|
2,270,149
100.72% of 50 DAV
50 DAV is 2,254,000
|
$101.94
-10.86%
|
7/21/2020
|
$94.29
|
PP = $94.97
|
|
MB = $99.72
|
Most Recent Note - 8/6/2020 5:30:20 PM
Y - The 50 DMA line ($88.49) defines important near term support to watch. Weak action came after it reported Jun '20 quarterly earnings +180% on +27% sales revenues versus the year-ago period. The slump below its pivot point into the prior base raised concerns.
>>> FEATURED STOCK ARTICLE : Pullback Below Pivot Point Following Breakout Gain - 7/21/2020 |
View all notes |
Set NEW NOTE alert |
Company Profile |
SEC
News |
Chart |
Request a new note
C
A
S
I |
|
|
|
THESE ARE NOT BUY RECOMMENDATIONS!
Comments contained in the body of this report are technical
opinions only. The material herein has been obtained
from sources believed to be reliable and accurate, however,
its accuracy and completeness cannot be guaranteed.
This site is not an investment advisor, hence it does
not endorse or recommend any securities or other investments.
Any recommendation contained in this report may not
be suitable for all investors and it is not to be deemed
an offer or solicitation on our part with respect to
the purchase or sale of any securities. All trademarks,
service marks and trade names appearing in this report
are the property of their respective owners, and are
likewise used for identification purposes only.
This report is a service available
only to active Paid Premium Members.
You may opt-out of receiving report notifications
at any time. Questions or comments may be submitted
by writing to Premium Membership Services 665 S.E. 10 Street, Suite 201 Deerfield Beach, FL 33441-5634 or by calling 1-800-965-8307
or 954-785-1121.
|
|
|