You are not logged in.
This means you
CAN ONLY VIEW reports that were published prior to Sunday, February 25, 2024.
You
MUST UPGRADE YOUR MEMBERSHIP if you want to see any current reports.
AFTER MARKET UPDATE - TUESDAY, AUGUST 6TH, 2019
Previous After Market Report Next After Market Report >>>
|
|
|
|
DOW |
+311.78 |
26,029.52 |
+1.21% |
|
Volume |
925,596,350 |
-16% |
|
Volume |
2,217,934,180 |
-15% |
|
NASDAQ |
+107.23 |
7,833.27 |
+1.39% |
|
Advancers |
1,986 |
68% |
|
Advancers |
1,998 |
65% |
|
S&P 500 |
+37.03 |
2,881.77 |
+1.30% |
|
Decliners |
918 |
32% |
|
Decliners |
1,095 |
35% |
|
Russell 2000 |
+14.67 |
1,502.09 |
+0.99% |
|
52 Wk Highs |
73 |
|
|
52 Wk Highs |
49 |
|
|
S&P 600 |
+10.08 |
921.79 |
+1.11% |
|
52 Wk Lows |
179 |
|
|
52 Wk Lows |
213 |
|
|
 |
Major Indices Rose With Less Volume Conviction Behind Gains
Kenneth J. Gruneisen - Passed the CAN SLIM® Master's Exam
The major averages rebounded Tuesday after suffering the worst trading day of 2019 Monday. The Dow added 311 points and finished higher for the first time in five sessions. The S&P 500 and Nasdaq Composite both snapped six day losing streaks, advancing 1.3% and 1.4% respectively. Volume totals reported Monday were lighter than the prior session totals on the NYSE and on the Nasdaq exchange, indicating lackluster buying demand from the institutional crowd. Advancers led decliners by a 2-1 margin on the NYSE and nearly 2-1 on the Nasdaq exchange. Leadership remained thin as there were 15 high-ranked companies from the Leaders List hit new 52-week highs and were listed on the BreakOuts Page, versus the total of 10 on the prior session. New 52-week lows outnumbered new 52-week highs on the NYSE and on the Nasdaq exchange. The major indices (M criteria) have shown distributional action indicative of a market correction. During market corrections new buying efforts are avoided and disciplined investors reduce exposure by selling stocks that trigger sell signals on a case-by-case basis. The Featured Stocks Page provides the most timely analysis on high-ranked leaders.Charts used courtesy of www.stockcharts.com
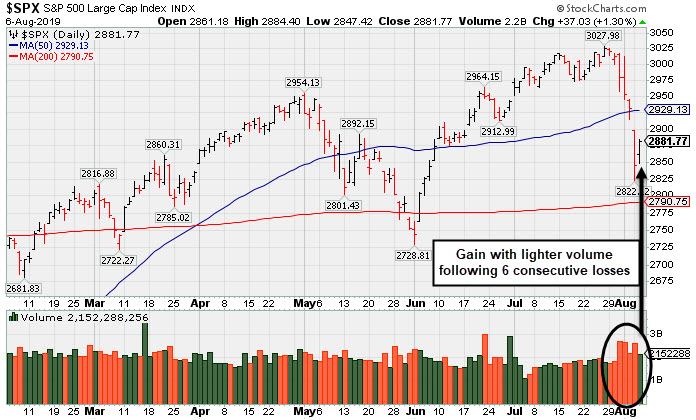
PICTURED: The S&P 500 Index posted a gain with lighter volume following 6 consecutive losses as it slumped below its 50-day moving average (DMA) line.
Investor sentiment was lifted overnight after China’s central bank expressed a willingness to stabilize the Yuan a day after the currency breached a key psychological level against the U.S. dollar. This move came after the U.S. Treasury Department labeled the Chinese as currency manipulators, underscoring the escalating trade tensions between Washington and Beijing. A separate update from White House Chief Economic Adviser Larry Kudlow suggested President Trump would be “flexible” with tariffs on Chinese goods.
Treasuries were mixed, with the yield on the benchmark 10-year note down two basis points to 1.71%. On the data front, the lone update revealed the U.S. economy had 7.3 million jobs openings in June, in-line with estimates and the prior month’s reading. In commodities, WTI crude slipped 1.9% to $53.92/barrel while COMEX gold gained 0.5% to $1471.90/ounce.
Ten of 11 S&P 500 sectors finished in positive territory with Technology stocks pacing the gains. The Consumer Discretionary and Industrials sectors also outperformed as both groups advanced roughly 1.5%. In earnings, Take-Two Interactive (TTWO +7.96%) rose after the video-game maker easily topped analyst earnings and revenue estimates. In M&A news, MasterCard (MA +3.05%) rose after announcing it had acquired a portion of electronic billing platform company Nets for $3.19 billion.
|
 Kenneth J. Gruneisen started out as a licensed stockbroker in August 1987, a couple of months prior to the historic stock market crash that took the Dow Jones Industrial Average down -22.6% in a single day. He has published daily fact-based fundamental and technical analysis on high-ranked stocks online for two decades. Through FACTBASEDINVESTING.COM, Kenneth provides educational articles, news, market commentary, and other information regarding proven investment systems that work in good times and bad.
Comments contained in the body of this report are technical opinions only and are not necessarily those of Gruneisen Growth Corp. The material herein has been obtained from sources believed to be reliable and accurate, however, its accuracy and completeness cannot be guaranteed. Our firm, employees, and customers may effect transactions, including transactions contrary to any recommendation herein, or have positions in the securities mentioned herein or options with respect thereto. Any recommendation contained in this report may not be suitable for all investors and it is not to be deemed an offer or solicitation on our part with respect to the purchase or sale of any securities. |
|
 |
Retail, Financial, and Tech Indexes Rose
Kenneth J. Gruneisen - Passed the CAN SLIM® Master's Exam
The Broker/Dealer Index ($XBD +1.33%), Bank Index ($BKX +1.05%), and the Retail Index ($RLX +1.51%) posted gains that helped the major indices rebound. The Semiconductor Index ($SOX +1.28%), Networking Index ($NWX +0.86%), and Biotech Index ($BTK +1.68%) each posted gains. The Gold & Silver Index ($XAU +0.25%) inched higher, meanwhile, the Integrated Oil Index ($XOI -0.13%) inched lower and the Oil Services Index ($OSX -0.97%) was a standout decliner.
Charts courtesy of www.stockcharts.com
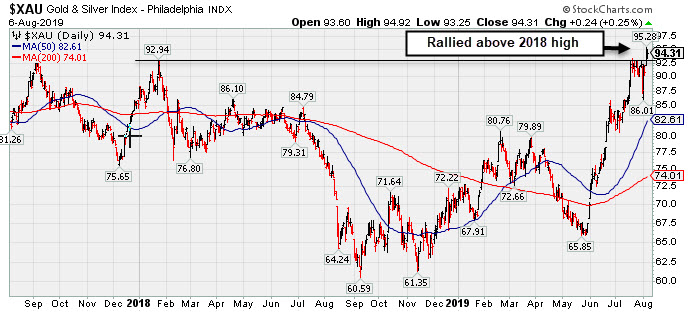
PICTURED: The Gold & Silver Index ($XAU +0.25%) rallied above its 2018 high.
| Oil Services |
$OSX |
68.50 |
-0.68 |
-0.98% |
-15.01% |
| Integrated Oil |
$XOI |
1,175.84 |
-1.48 |
-0.13% |
+1.44% |
| Semiconductor |
$SOX |
1,441.77 |
+18.25 |
+1.28% |
+24.81% |
| Networking |
$NWX |
564.24 |
+4.79 |
+0.86% |
+15.47% |
| Broker/Dealer |
$XBD |
259.54 |
+3.42 |
+1.33% |
+9.36% |
| Retail |
$RLX |
2,274.99 |
+33.77 |
+1.51% |
+16.58% |
| Gold & Silver |
$XAU |
94.31 |
+0.23 |
+0.24% |
+33.47% |
| Bank |
$BKX |
95.42 |
+0.99 |
+1.05% |
+11.23% |
| Biotech |
$BTK |
4,539.58 |
+74.93 |
+1.68% |
+7.55% |
|
|
|
 |
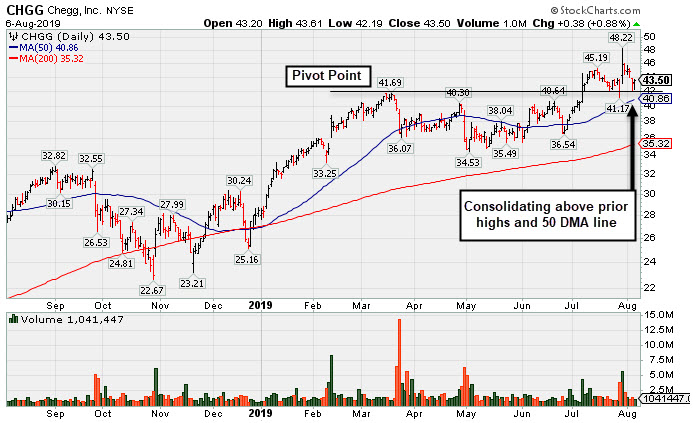
Consolidating Above Prior Highs and 50-Day Average
Kenneth J. Gruneisen - Passed the CAN SLIM® Master's Exam
Chegg Inc (CHGG +$0.38 or +0.88% to $43.50) is consolidating above prior highs in the $40-41 area with define important near-term support to watch along with its 50-day moving average (DMA) line ($40.72).
It reported earnings +92% on +26% sales revenues for the Jun '19 quarter, continuing its strong earnings track record of earnings increases well above the +25% minimum earnings guideline (C criteria). Annual earnings (A criteria) have been growing at a strong pace since turning profitable in FY '16 following years of losses. It completed its $13 IPO in November of 2013 and another new Public Offering in August of 2017. It has 118.5 million shares outstanding.
It was highlighted in yellow with pivot point cited based on its 3/19/19 high plus 10 cents (read here). It triggered a technical buy signal as it hit a new 52-week high with +165% above average volume behind a big gain capping an 8-day winning streak. It was last shown in this FSU section on 7/08/19 with an annotated graph under the headline, "Tallied a Big Volume-Driven Breakout Gain for a New High".
The number of high-ranked funds owning its shares rose from 360 in Sep '18 to 481 in Jun '19, a reassuring sign concerning the I criteria. Its current Up/Down Volume Ratio of 1.5 is an unbiased indication its shares have been under slight accumulation over the past 50 days. It has earned a Timeliness Rating of A and Sponsorship Rating of B.
Charts courtesy of www.stockcharts.com
|
|
|
Color Codes Explained :
Y - Better candidates highlighted by our
staff of experts.
G - Previously featured
in past reports as yellow but may no longer be buyable under the
guidelines.
***Last / Change / Volume data in this table is the closing quote data***
Symbol/Exchange
Company Name
Industry Group |
PRICE |
CHANGE
(%Change) |
Day High |
Volume
(% DAV)
(% 50 day avg vol) |
52 Wk Hi
% From Hi |
Featured
Date |
Price
Featured |
Pivot Featured |
|
Max Buy |
 SPSC
-
NASDAQ
SPSC
-
NASDAQ
S P S Commerce Inc
COMPUTER SOFTWARE and SERVICES - Application Software
|
$105.69
|
-0.32
-0.30% |
$108.49
|
113,782
84.28% of 50 DAV
50 DAV is 135,000
|
$118.28
-10.64%
|
6/7/2019
|
$107.72
|
PP = $115.10
|
|
MB = $120.86
|
Most Recent Note - 8/5/2019 4:23:30 PM
Y - Pulled back near its 50 DMA line ($104.83) which defines important near-term support. Stalled after a gap up and big volume-driven gain noted on 7/26/19. Subsequent gains and a strong close above the pivot point may clinch a convincing new (or add-on) technical buy signal. Reported earnings +22% on +12% sales revenues for the Jun '19 quarter, slightly under the +25% minimum earnings guideline (C criteria), raising fundamental concerns.
>>> FEATURED STOCK ARTICLE : Recently Sputtering Below 50-Day Moving Average - 7/9/2019 |
View all notes |
Set NEW NOTE alert |
Company Profile |
SEC
News |
Chart |
Request a new note
C
A
S
I |
EPAM
-
NYSE
Epam Systems Inc
COMPUTER SOFTWARE and SERVICES - Information Technology Service
|
$179.91
|
+3.53
2.00% |
$180.92
|
441,754
89.79% of 50 DAV
50 DAV is 492,000
|
$201.00
-10.49%
|
5/9/2019
|
$169.25
|
PP = $180.55
|
|
MB = $189.58
|
Most Recent Note - 8/5/2019 4:05:28 PM
G - Gapped down violating its 50 DMA line ($181.53) and prior highs in the $179-180 area triggering technical sell signals with today's 6th consecutive loss, and its color code is changed to green. Due to report earnings news before the open on Thursday, August 8, 2019. A prompt rebound above its 50 DMA line is needed for its outlook to improve.
>>> FEATURED STOCK ARTICLE : Winning Streak Leaves IT Firm Extended From Prior Base - 7/12/2019 |
View all notes |
Set NEW NOTE alert |
Company Profile |
SEC
News |
Chart |
Request a new note
C
A
S
I |
AUDC
-
NASDAQ
Audiocodes Ltd
ELECTRONICS - Scientific and Technical Instrum
|
$18.54
|
+0.43
2.37% |
$18.78
|
110,735
63.28% of 50 DAV
50 DAV is 175,000
|
$19.74
-6.08%
|
7/15/2019
|
$17.10
|
PP = $17.54
|
|
MB = $18.42
|
Most Recent Note - 8/5/2019 4:01:44 PM
Y - Color code is changed to yellow after retreating below its "max buy" level amid widespread market weakness (M criteria). Reported earnings +57% on +14% sales revenues for the Jun '19 quarter, continuing its strong earnings track record. Prior highs in the $17 area define initial support above its 50 DMA line ($16.18).
>>> FEATURED STOCK ARTICLE : Posted a Gain With Average Volume for Best Ever Close - 7/15/2019 |
View all notes |
Set NEW NOTE alert |
Company Profile |
SEC
News |
Chart |
Request a new note
C
A
S
I |
ENV
-
NYSE
Envestnet Inc
FINANCIAL SERVICES - Diversified Investments
|
$65.49
|
-0.14
-0.21% |
$67.02
|
273,755
101.77% of 50 DAV
50 DAV is 269,000
|
$73.94
-11.43%
|
3/15/2019
|
$66.05
|
PP = $64.90
|
|
MB = $68.15
|
Most Recent Note - 8/5/2019 5:40:28 PM
G - After violating its 50 DMA line and triggering a technical sell signal last week, today's gap down and 6th consecutive loss is tested prior lows in the $65-66 area defining important support. Due to report second quarter financial results on Wednesday, August 7, 2019 after the close. Fundamental concerns were raised after it reported earnings +5% on +1% sales revenues for the Mar '19 quarter, below the +25% minimum earnings guideline (C criteria). See the latest FSU analysis for more details and a new annotated graph.
>>> FEATURED STOCK ARTICLE : Technical Damage Mounts Ahead of Next Quarterly Report - 8/5/2019 |
View all notes |
Set NEW NOTE alert |
Company Profile |
SEC
News |
Chart |
Request a new note
C
A
S
I |
LHCG
-
NASDAQ
L H C Group Inc
HEALTH SERVICES - Home Health Care
|
$121.73
|
+1.50
1.25% |
$122.30
|
154,280
71.10% of 50 DAV
50 DAV is 217,000
|
$129.37
-5.91%
|
7/1/2019
|
$110.94
|
PP = $122.20
|
|
MB = $128.31
|
Most Recent Note - 8/1/2019 5:53:08 PM
Y - Pulled back today with higher volume after quietly touching a new all-time high on the prior session. Recent gains above its pivot point were not backed by the +40% above average volume needed to trigger a proper new (or add-on) technical buy signal. Its 50 DMA line ($118.98) defines near-term support above recent lows. Due to report earnings news on 8/07/19.
>>> FEATURED STOCK ARTICLE : Consolidating Following a Negative Reversal at High - 7/22/2019 |
View all notes |
Set NEW NOTE alert |
Company Profile |
SEC
News |
Chart |
Request a new note
C
A
S
I |
Symbol/Exchange
Company Name
Industry Group |
PRICE |
CHANGE
(%Change) |
Day High |
Volume
(% DAV)
(% 50 day avg vol) |
52 Wk Hi
% From Hi |
Featured
Date |
Price
Featured |
Pivot Featured |
|
Max Buy |
CHDN
-
NASDAQ
Churchill Downs Inc
LEISURE - Gaming Activities
|
$118.44
|
+3.55
3.09% |
$118.98
|
235,759
86.36% of 50 DAV
50 DAV is 273,000
|
$132.73
-10.77%
|
7/22/2019
|
$118.45
|
PP = $118.89
|
|
MB = $124.83
|
 Most Recent Note - 8/6/2019 8:57:41 PM
Y - Found support above its 50 DMA line ($114) with a gain on lighter volume. Reported Jun '19 earnings rose +10% on +26% sales revenues versus the year ago period, below the +25% minimum earnings guideline (C criteria). The prior low ($108.57 on 6/25/19) defines the next important near-term support to watch below its 50 DMA line.
>>> FEATURED STOCK ARTICLE : Volume Light While Hovering at Record High - 7/16/2019 |
View all notes |
Set NEW NOTE alert |
Company Profile |
SEC
News |
Chart |
Request a new note
C
A
S
I |
WWD
-
NASDAQ
Woodward Inc
MANUFACTURING - Diversified Machinery
|
$105.15
|
-1.79
-1.67% |
$108.00
|
809,250
159.30% of 50 DAV
50 DAV is 508,000
|
$119.20
-11.79%
|
6/18/2019
|
$112.34
|
PP = $114.65
|
|
MB = $120.38
|
Most Recent Note - 8/6/2019 9:01:05 PM
Slumped further below its 50 DMA line ($113.23) with today's 5th consecutive loss on ever increasing volume. Reported earnings +16% on +28%v sales revenues for the Jun '19 quarter, below the +25% minimum earnings guideline (C criteria) raising fundamental concerns. It will be dropped from the Featured Stocks list tonight.
>>> FEATURED STOCK ARTICLE : Perched Near All-Time High After Gains Lacking Great Volume - 7/24/2019 |
View all notes |
Set NEW NOTE alert |
Company Profile |
SEC
News |
Chart |
Request a new note
C
A
S
I |
LULU
-
NASDAQ
Lululemon Athletica
MANUFACTURING - Textile Manufacturing
|
$179.63
|
+5.17
2.96% |
$180.46
|
1,371,568
63.65% of 50 DAV
50 DAV is 2,155,000
|
$194.25
-7.53%
|
6/13/2019
|
$174.48
|
PP = $179.60
|
|
MB = $188.58
|
Most Recent Note - 8/2/2019 1:25:48 PM
G - Pulling back from its all-time high with today's 4th consecutive loss with below average volume, undercutting its 50 DMA line ($180.82) and raising concerns. Reported Apr '19 quarterly earnings +35% on +20% sales revenues versus the year ago period.
>>> FEATURED STOCK ARTICLE : Quietly Hovering at All-Time High - 7/17/2019 |
View all notes |
Set NEW NOTE alert |
Company Profile |
SEC
News |
Chart |
Request a new note
C
A
S
I |
ULTA
-
NASDAQ
Ulta Beauty Inc
SPECIALTY RETAIL - Specialty Retail, Other
|
$340.28
|
+10.14
3.07% |
$340.95
|
688,204
91.76% of 50 DAV
50 DAV is 750,000
|
$368.83
-7.74%
|
3/15/2019
|
$341.27
|
PP = $322.59
|
|
MB = $338.72
|
Most Recent Note - 8/1/2019 5:51:09 PM
G - Sputtering near its 50 DMA line ($346.67). Volume totals have been mostly light while still hovering near its all-time high. Reported earnings +17% on +13% sales revenues for the Apr '19 quarter, below the +25% minimum earnings guideline (C criteria), raising fundamental concerns.
>>> FEATURED STOCK ARTICLE : Stalled After Recently Wedging to New Record High - 7/5/2019 |
View all notes |
Set NEW NOTE alert |
Company Profile |
SEC
News |
Chart |
Request a new note
C
A
S
I |
CHGG
-
NYSE
Chegg Inc
Consumer Svcs-Education
|
$43.50
|
+0.38
0.88% |
$43.61
|
1,048,632
69.13% of 50 DAV
50 DAV is 1,517,000
|
$48.22
-9.79%
|
7/8/2019
|
$44.11
|
PP = $41.79
|
|
MB = $43.88
|
Most Recent Note - 8/6/2019 8:53:15 PM
Y - Consolidating above prior highs in the $40-41 area which define important near-term support to watch along with its 50 DMA line ($40.86). Reported earnings +92% on +26% sales revenues for the Jun '19 quarter. See the latest FSU analysis for more details and a new annotated graph.
>>> FEATURED STOCK ARTICLE : Consolidating Above Prior Highs and 50-Day Average - 8/6/2019 |
View all notes |
Set NEW NOTE alert |
Company Profile |
SEC
News |
Chart |
Request a new note
C
A
S
I |
Symbol/Exchange
Company Name
Industry Group |
PRICE |
CHANGE
(%Change) |
Day High |
Volume
(% DAV)
(% 50 day avg vol) |
52 Wk Hi
% From Hi |
Featured
Date |
Price
Featured |
Pivot Featured |
|
Max Buy |
VEEV
-
NYSE
Veeva Systems Inc Cl A
Computer Sftwr-Medical
|
$160.42
|
+4.43
2.84% |
$161.65
|
1,199,306
71.60% of 50 DAV
50 DAV is 1,675,000
|
$176.90
-9.32%
|
5/30/2019
|
$154.32
|
PP = $145.80
|
|
MB = $153.09
|
Most Recent Note - 8/5/2019 4:15:49 PM
G - Undercut yet closed above the prior low ($155 on 6/27/19) as it gapped down below its 50 DMA line ($163.58) with today's 3rd consecutive loss raising greater concerns. Fundamentals remain strong.
>>> FEATURED STOCK ARTICLE : Recently Found Support Near 50-Day Moving Average - 8/1/2019 |
View all notes |
Set NEW NOTE alert |
Company Profile |
SEC
News |
Chart |
Request a new note
C
A
S
I |
PAYC
-
NYSE
Paycom Software Inc
COMPUTER SOFTWARE and SERVICES - Application Software
|
$225.31
|
+4.14
1.87% |
$228.28
|
677,668
92.70% of 50 DAV
50 DAV is 731,000
|
$246.85
-8.73%
|
2/6/2019
|
$171.66
|
PP = $164.18
|
|
MB = $172.39
|
Most Recent Note - 8/5/2019 4:09:03 PM
G - Gapped down and violated its 50 DMA line with today's volume-driven loss triggering a technical sell signal. Last week it reported earnings +27% on +31% sales revenues for the Jun '19 quarter, continuing its strong earnings track record. See the latest FSU analysis for more details and an annotated graph.
>>> FEATURED STOCK ARTICLE : Found Support and Gapped Up Following Earnings Report - 8/2/2019 |
View all notes |
Set NEW NOTE alert |
Company Profile |
SEC
News |
Chart |
Request a new note
C
A
S
I |
PLNT
-
NYSE
Planet Fitness Inc Cl A
Leisure-Services
|
$77.50
|
+2.76
3.69% |
$77.73
|
1,843,327
125.14% of 50 DAV
50 DAV is 1,473,000
|
$81.90
-5.37%
|
7/26/2019
|
$79.15
|
PP = $82.00
|
|
MB = $86.10
|
Most Recent Note - 8/6/2019 8:56:30 PM
Y - Rebounded above its 50 DMA line ($76.76) with today's solid gain on slightly higher volume. Volume-driven gains above the pivot point are needed to trigger a new (or add-on) technical buy signal. Reported earnings +32% on +29% sales revenues for the Jun '19 quarter continuing its strong earnings track record.
>>> FEATURED STOCK ARTICLE : Fitness Firm Forming a New Base - 7/26/2019 |
View all notes |
Set NEW NOTE alert |
Company Profile |
SEC
News |
Chart |
Request a new note
C
A
S
I |
BLD
-
NYSE
Topbuild Corp
Bldg-Constr Prds/Misc
|
$88.34
|
+0.49
0.56% |
$91.49
|
476,824
144.93% of 50 DAV
50 DAV is 329,000
|
$90.05
-1.90%
|
5/17/2019
|
$82.19
|
PP = $87.31
|
|
MB = $91.68
|
Most Recent Note - 8/2/2019 1:17:37 PM
Y - Trading up today near all-time high following a considerable volume-driven gain on the prior session. Bullish action came after it reported earnings +39% on +9% sales revenues for the Jun '19 quarter versus the year ago period, continuing its strong earnings track record. Members were reminded - "Volume and volatility often increase near earnings news. A gain and strong close above the pivot point backed by at least +40% above average volume may clinch a convincing technical buy signal. Its 50 DMA line and recent lows define near-term support to watch on pullbacks."
>>> FEATURED STOCK ARTICLE : Perched Near 52-Week High Finding Support - 7/25/2019 |
View all notes |
Set NEW NOTE alert |
Company Profile |
SEC
News |
Chart |
Request a new note
C
A
S
I |
TEAM
-
NASDAQ
Atlassian Corp Plc Cl A
Comp Sftwr-Spec Enterprs
|
$135.47
|
+2.28
1.71% |
$139.47
|
1,282,345
97.15% of 50 DAV
50 DAV is 1,320,000
|
$149.80
-9.57%
|
5/24/2019
|
$129.52
|
PP = $132.09
|
|
MB = $138.69
|
Most Recent Note - 8/5/2019 4:27:26 PM
Y - Color code is changed to yellow after gapping down and slumping below its "max buy" level as it also undercut the 50 DMA line ($133.07). Its prior low ($123.43 on 6/25/19) defines important near-term support to watch where a violation would raise serious concerns and trigger a more worrisome technical sell signal. Reported earnings +43% on +36% sales revenues for the Jun '19 quarter, continuing its strong earnings track record.
>>> FEATURED STOCK ARTICLE : Abrupt Retreat After Getting Very Extended From Prior Base - 7/29/2019 |
View all notes |
Set NEW NOTE alert |
Company Profile |
SEC
News |
Chart |
Request a new note
C
A
S
I |
Symbol/Exchange
Company Name
Industry Group |
PRICE |
CHANGE
(%Change) |
Day High |
Volume
(% DAV)
(% 50 day avg vol) |
52 Wk Hi
% From Hi |
Featured
Date |
Price
Featured |
Pivot Featured |
|
Max Buy |
GLOB
-
NYSE
Globant SA
Computer-Tech Services
|
$104.92
|
+1.54
1.49% |
$106.28
|
223,111
53.38% of 50 DAV
50 DAV is 418,000
|
$112.33
-6.60%
|
2/15/2019
|
$69.35
|
PP = $70.00
|
|
MB = $73.50
|
Most Recent Note - 8/5/2019 4:17:25 PM
G - Pulled back from its all-time high with today's 2nd consecutive loss on below average volume. Very extended from any sound base. Its 50 DMA line ($101.55) defines important support to watch. Fundamentals remain strong.
>>> FEATURED STOCK ARTICLE : Extended From Any Sound Base After Wedging Higher - 7/11/2019 |
View all notes |
Set NEW NOTE alert |
Company Profile |
SEC
News |
Chart |
Request a new note
C
A
S
I |
TTD
-
NASDAQ
The Trade Desk Inc Cl A
Comml Svcs-Advertising
|
$251.87
|
+2.09
0.84% |
$260.50
|
1,272,577
88.31% of 50 DAV
50 DAV is 1,441,000
|
$279.71
-9.95%
|
7/18/2019
|
$240.61
|
PP = $258.10
|
|
MB = $271.01
|
Most Recent Note - 8/5/2019 1:02:06 PM
Y - Amid widespread weakness today it is undercutting the prior high ($258) and negating the recent breakout. The next important support to watch is its 50 DMA line ($238.94). Due to report earnings news on 8/08/19.
>>> FEATURED STOCK ARTICLE : Endured Distributional Pressure While Building on New Base - 7/18/2019 |
View all notes |
Set NEW NOTE alert |
Company Profile |
SEC
News |
Chart |
Request a new note
C
A
S
I |
PAGS
-
NYSE
Pagseguro Digital Cl A
Finance-CrdtCard/PmtPr
|
$44.79
|
+1.52
3.51% |
$44.94
|
1,303,351
57.34% of 50 DAV
50 DAV is 2,273,000
|
$48.88
-8.37%
|
6/25/2019
|
$37.69
|
PP = $40.07
|
|
MB = $42.07
|
Most Recent Note - 8/6/2019 8:54:36 PM
G - Posted a gain today with light volume. Prior high in the $40 area defines initial support to watch along with its 50 DMA line ($39.95).
>>> FEATURED STOCK ARTICLE : Encountering Distributional Pressure After Impressive Sprint - 7/30/2019 |
View all notes |
Set NEW NOTE alert |
Company Profile |
SEC
News |
Chart |
Request a new note
C
A
S
I |
|
|
|
THESE ARE NOT BUY RECOMMENDATIONS!
Comments contained in the body of this report are technical
opinions only. The material herein has been obtained
from sources believed to be reliable and accurate, however,
its accuracy and completeness cannot be guaranteed.
This site is not an investment advisor, hence it does
not endorse or recommend any securities or other investments.
Any recommendation contained in this report may not
be suitable for all investors and it is not to be deemed
an offer or solicitation on our part with respect to
the purchase or sale of any securities. All trademarks,
service marks and trade names appearing in this report
are the property of their respective owners, and are
likewise used for identification purposes only.
This report is a service available
only to active Paid Premium Members.
You may opt-out of receiving report notifications
at any time. Questions or comments may be submitted
by writing to Premium Membership Services 665 S.E. 10 Street, Suite 201 Deerfield Beach, FL 33441-5634 or by calling 1-800-965-8307
or 954-785-1121.
|
|
|

