You are not logged in.
This means you
CAN ONLY VIEW reports that were published prior to Friday, February 23, 2024.
You
MUST UPGRADE YOUR MEMBERSHIP if you want to see any current reports.
AFTER MARKET UPDATE - MONDAY, AUGUST 5TH, 2019
Previous After Market Report Next After Market Report >>>
|
|
|
|
DOW |
-767.27 |
25,717.74 |
-2.90% |
|
Volume |
1,100,469,240 |
+25% |
|
Volume |
2,618,111,410 |
+18% |
|
NASDAQ |
-278.03 |
7,726.04 |
-3.47% |
|
Advancers |
304 |
11% |
|
Advancers |
415 |
13% |
|
S&P 500 |
-87.31 |
2,844.74 |
-2.98% |
|
Decliners |
2,573 |
89% |
|
Decliners |
2,741 |
87% |
|
Russell 2000 |
-46.25 |
1,487.41 |
-3.02% |
|
52 Wk Highs |
103 |
|
|
52 Wk Highs |
54 |
|
|
S&P 600 |
-26.43 |
911.71 |
-2.82% |
|
52 Wk Lows |
275 |
|
|
52 Wk Lows |
281 |
|
|
 |
Mounting Damage to Major Indices Signals a Correction
Kenneth J. Gruneisen - Passed the CAN SLIM® Master's Exam
A perceived “risk-off” tone prompted the Dow to slide 767 points. The S&P 500 retreated 3.0%, leaving the benchmark 6% below its July 26th record high. Volume totals reported Monday were higher than the prior session totals on the NYSE and on the Nasdaq exchange, indicating more serious selling pressure from the institutional crowd. Decliners decisively led advancers by an 8-1 margin on the NYSE and 6-1 on the Nasdaq exchange. Leadership thinned as there were only 10 high-ranked companies from the Leaders List hit new 52-week highs and were listed on the BreakOuts Page, versus the total of 17 on the prior session, down from 78 on the prior Monday. New 52-week lows totals swelled and outnumbered new 52-week highs on the NYSE and on the Nasdaq exchange. The major indices (M criteria) have shown distributional action indicative of a market correction. During market corrections new buying efforts are avoided and disciplined investors reduce exposure by selling stocks that trigger sell signals on a case-by-case basis. The Featured Stocks Page provides the most timely analysis on high-ranked leaders.Charts used courtesy of www.stockcharts.com
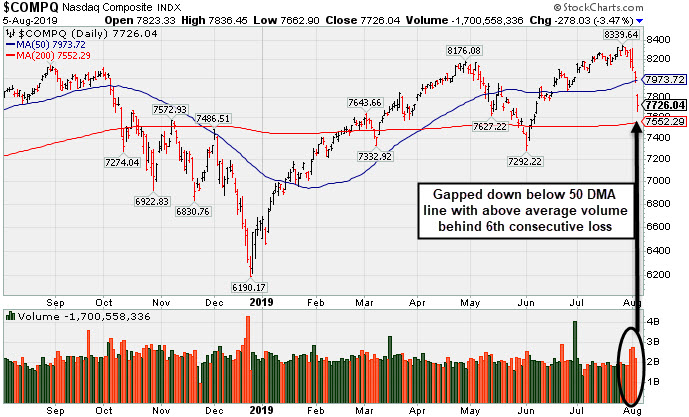
PICTURED: The Nasdaq Composite Index tumbled -3.5% for its 6th consecutive loss as it gapped down below its 50-day moving average (DMA) line.
Stocks experienced the worst trading session of 2019 on Monday as escalating trade tensions between the U.S. and China renewed fears of a global economic slowdown. Following intervention from the central government, the Chinese Yuan tumbled to the lowest level since 2008, leading to President Trump calling the depreciation a “currency manipulation.” Further, Chinese officials have reportedly asked state-owned companies to halt imports of U.S. agricultural goods in response to the White House’s tariff announcement last week. Elsewhere, a report showed ISM’s July gauge of U.S. service sector activity fell to the weakest level since August 2016. Amid the uncertainty, the CBOE Volatility Index (VIX) surged more than 30% and perceived “safe-haven” assets rallied. The yield on the benchmark 10-year Treasury note tumbled 12 basis points to 1.73%, the lowest level since October 2016. COMEX gold added 1.0% to $1,460.00/ounce, near a six-year high.
All 11 S&P 500 sectors finished in negative territory, with nine groups falling at least 2%. Weakness in chipmakers inspired a 4% drop in Technology shares, while lower Treasury yields weighed on Financials. Energy stocks also underperformed as WTI crude lost 1.4% to $54.86/barrel. Meanwhile, the oft-cited FAANG stocks tumbled 3.8% with Apple (AAPL -5.23%) leading the retreat. In earnings, Berkshire Hathaway Class B (BRKB -2.44%) fell after the conglomerate missed analyst profit expectations.
|
 Kenneth J. Gruneisen started out as a licensed stockbroker in August 1987, a couple of months prior to the historic stock market crash that took the Dow Jones Industrial Average down -22.6% in a single day. He has published daily fact-based fundamental and technical analysis on high-ranked stocks online for two decades. Through FACTBASEDINVESTING.COM, Kenneth provides educational articles, news, market commentary, and other information regarding proven investment systems that work in good times and bad.
Comments contained in the body of this report are technical opinions only and are not necessarily those of Gruneisen Growth Corp. The material herein has been obtained from sources believed to be reliable and accurate, however, its accuracy and completeness cannot be guaranteed. Our firm, employees, and customers may effect transactions, including transactions contrary to any recommendation herein, or have positions in the securities mentioned herein or options with respect thereto. Any recommendation contained in this report may not be suitable for all investors and it is not to be deemed an offer or solicitation on our part with respect to the purchase or sale of any securities. |
|
 |
Gold & Silver Index Rose Amid Widespread Group Losses
Kenneth J. Gruneisen - Passed the CAN SLIM® Master's Exam
The Broker/Dealer Index ($XBD -3.16%), Bank Index ($BKX -3.63%), and the Retail Index ($RLX -2.96%) suffered unanimous big losses that weighed on the major indices. The Semiconductor Index ($SOX -4.63%), Networking Index ($NWX -2.72%), and Biotech Index ($BTK -3.24%) each lost ground. Commodity-linked groups were mixed as the Gold & Silver Index ($XAU +3.59%) posted a standout gain, meanwhile, the Oil Services Index ($OSX -4.83%) and the Integrated Oil Index ($XOI -3.34%) both finished solidly lower.
Charts courtesy of www.stockcharts.com
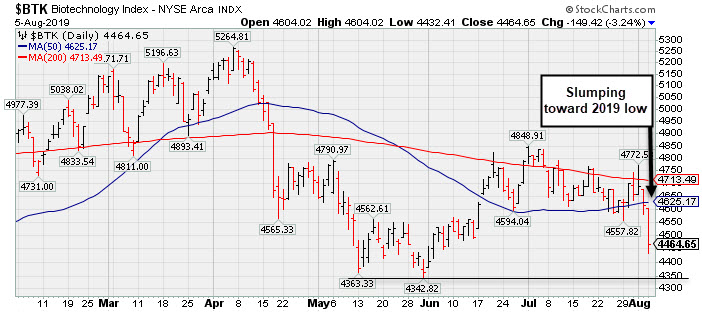
PICTURED: The Biotech Index ($BTK -3.24%) is slumping toward its 2019 low.
| Oil Services |
$OSX |
69.18 |
-3.51 |
-4.83% |
-14.17% |
| Integrated Oil |
$XOI |
1,177.32 |
-40.72 |
-3.34% |
+1.57% |
| Semiconductor |
$SOX |
1,423.52 |
-64.91 |
-4.36% |
+23.23% |
| Networking |
$NWX |
559.45 |
-15.65 |
-2.72% |
+14.48% |
| Broker/Dealer |
$XBD |
256.13 |
-8.35 |
-3.16% |
+7.92% |
| Retail |
$RLX |
2,241.22 |
-68.40 |
-2.96% |
+14.85% |
| Gold & Silver |
$XAU |
94.08 |
+3.26 |
+3.59% |
+33.14% |
| Bank |
$BKX |
94.43 |
-3.56 |
-3.63% |
+10.07% |
| Biotech |
$BTK |
4,464.65 |
-149.42 |
-3.24% |
+5.78% |
|
|
|
 |
Technical Damage Mounts Ahead of Next Quarterly Report
Kenneth J. Gruneisen - Passed the CAN SLIM® Master's Exam
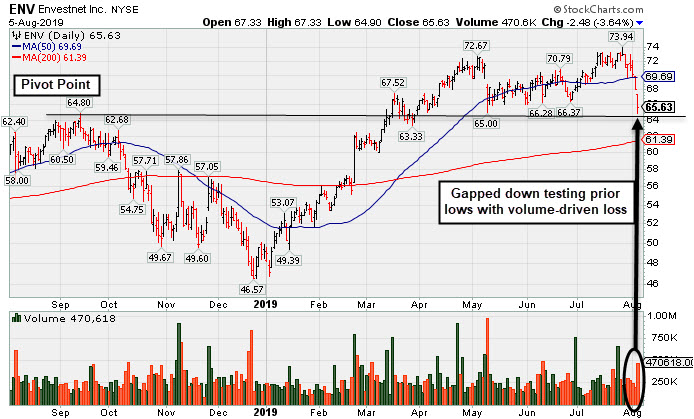
Envestnet Inc (ENV -$2.48 or -3.64% to $65.63) gapped down today and its 6th consecutive loss is tested prior lows in the $65-66 area defining important support. It violated its 50-day moving average (DMA) line and triggered a technical sell signal last week.
ENV is due to report second quarter financial results on Wednesday, August 7, 2019 after the close. Fundamental concerns were raised after it reported earnings +5% on +1% sales revenues for the Mar '19 quarter. That report broke a streak to 8 consecutive quarterly comparisons above the +25% minimum earnings guideline (C criteria). Annual earnings growth was flat in FY '16 but it has otherwise been strong. It still has a 92 Earnings Per Share Rating.
The high-ranked Financial Services - Specialty firm was last shown in this FSU section on 7/02/19 with an annotated graph under the headline, "Rebounded Above 50-Day Moving Average Line". It was highlighted in yellow with pivot point cited based on its 9/14/18 high plus 10 cents in the 3/15/19 mid-day report (read here).
The number of top-rated funds owning its shares rose from 284 in Jun '17 to 374 in Jun '19, a reassuring sign concerning the I criteria. Its current Up/Down Volume Ratio of 1.1 is an unbiased indication its shares have been under slight accumulation over the past 50 days. It has Timeliness Rating of A and Sponsorship Rating of C. Charts courtesy of www.stockcharts.com
|
|
|
Color Codes Explained :
Y - Better candidates highlighted by our
staff of experts.
G - Previously featured
in past reports as yellow but may no longer be buyable under the
guidelines.
***Last / Change / Volume data in this table is the closing quote data***
Symbol/Exchange
Company Name
Industry Group |
PRICE |
CHANGE
(%Change) |
Day High |
Volume
(% DAV)
(% 50 day avg vol) |
52 Wk Hi
% From Hi |
Featured
Date |
Price
Featured |
Pivot Featured |
|
Max Buy |
 SPSC
-
NASDAQ
SPSC
-
NASDAQ
S P S Commerce Inc
COMPUTER SOFTWARE and SERVICES - Application Software
|
$106.01
|
-4.29
-3.89% |
$108.63
|
164,967
122.20% of 50 DAV
50 DAV is 135,000
|
$118.28
-10.37%
|
6/7/2019
|
$107.72
|
PP = $115.10
|
|
MB = $120.86
|
 Most Recent Note - 8/5/2019 4:23:30 PM
Y - Pulled back near its 50 DMA line ($104.83) which defines important near-term support. Stalled after a gap up and big volume-driven gain noted on 7/26/19. Subsequent gains and a strong close above the pivot point may clinch a convincing new (or add-on) technical buy signal. Reported earnings +22% on +12% sales revenues for the Jun '19 quarter, slightly under the +25% minimum earnings guideline (C criteria), raising fundamental concerns.
>>> FEATURED STOCK ARTICLE : Recently Sputtering Below 50-Day Moving Average - 7/9/2019 |
View all notes |
Set NEW NOTE alert |
Company Profile |
SEC
News |
Chart |
Request a new note
C
A
S
I |
EPAM
-
NYSE
Epam Systems Inc
COMPUTER SOFTWARE and SERVICES - Information Technology Service
|
$176.38
|
-11.45
-6.10% |
$181.50
|
516,932
105.71% of 50 DAV
50 DAV is 489,000
|
$201.00
-12.25%
|
5/9/2019
|
$169.25
|
PP = $180.55
|
|
MB = $189.58
|
Most Recent Note - 8/5/2019 4:05:28 PM
G - Gapped down violating its 50 DMA line ($181.53) and prior highs in the $179-180 area triggering technical sell signals with today's 6th consecutive loss, and its color code is changed to green. Due to report earnings news before the open on Thursday, August 8, 2019. A prompt rebound above its 50 DMA line is needed for its outlook to improve.
>>> FEATURED STOCK ARTICLE : Winning Streak Leaves IT Firm Extended From Prior Base - 7/12/2019 |
View all notes |
Set NEW NOTE alert |
Company Profile |
SEC
News |
Chart |
Request a new note
C
A
S
I |
AUDC
-
NASDAQ
Audiocodes Ltd
ELECTRONICS - Scientific and Technical Instrum
|
$18.11
|
-0.54
-2.90% |
$18.35
|
223,814
128.63% of 50 DAV
50 DAV is 174,000
|
$19.74
-8.26%
|
7/15/2019
|
$17.10
|
PP = $17.54
|
|
MB = $18.42
|
Most Recent Note - 8/5/2019 4:01:44 PM
Y - Color code is changed to yellow after retreating below its "max buy" level amid widespread market weakness (M criteria). Reported earnings +57% on +14% sales revenues for the Jun '19 quarter, continuing its strong earnings track record. Prior highs in the $17 area define initial support above its 50 DMA line ($16.18).
>>> FEATURED STOCK ARTICLE : Posted a Gain With Average Volume for Best Ever Close - 7/15/2019 |
View all notes |
Set NEW NOTE alert |
Company Profile |
SEC
News |
Chart |
Request a new note
C
A
S
I |
ENV
-
NYSE
Envestnet Inc
FINANCIAL SERVICES - Diversified Investments
|
$65.63
|
-2.48
-3.64% |
$67.33
|
470,618
178.94% of 50 DAV
50 DAV is 263,000
|
$73.94
-11.24%
|
3/15/2019
|
$66.05
|
PP = $64.90
|
|
MB = $68.15
|
Most Recent Note - 8/5/2019 5:40:28 PM
G - After violating its 50 DMA line and triggering a technical sell signal last week, today's gap down and 6th consecutive loss is tested prior lows in the $65-66 area defining important support. Due to report second quarter financial results on Wednesday, August 7, 2019 after the close. Fundamental concerns were raised after it reported earnings +5% on +1% sales revenues for the Mar '19 quarter, below the +25% minimum earnings guideline (C criteria). See the latest FSU analysis for more details and a new annotated graph.
>>> FEATURED STOCK ARTICLE : Technical Damage Mounts Ahead of Next Quarterly Report - 8/5/2019 |
View all notes |
Set NEW NOTE alert |
Company Profile |
SEC
News |
Chart |
Request a new note
C
A
S
I |
LHCG
-
NASDAQ
L H C Group Inc
HEALTH SERVICES - Home Health Care
|
$120.23
|
-3.39
-2.74% |
$123.59
|
320,828
147.85% of 50 DAV
50 DAV is 217,000
|
$129.37
-7.07%
|
7/1/2019
|
$110.94
|
PP = $122.20
|
|
MB = $128.31
|
Most Recent Note - 8/1/2019 5:53:08 PM
Y - Pulled back today with higher volume after quietly touching a new all-time high on the prior session. Recent gains above its pivot point were not backed by the +40% above average volume needed to trigger a proper new (or add-on) technical buy signal. Its 50 DMA line ($118.98) defines near-term support above recent lows. Due to report earnings news on 8/07/19.
>>> FEATURED STOCK ARTICLE : Consolidating Following a Negative Reversal at High - 7/22/2019 |
View all notes |
Set NEW NOTE alert |
Company Profile |
SEC
News |
Chart |
Request a new note
C
A
S
I |
Symbol/Exchange
Company Name
Industry Group |
PRICE |
CHANGE
(%Change) |
Day High |
Volume
(% DAV)
(% 50 day avg vol) |
52 Wk Hi
% From Hi |
Featured
Date |
Price
Featured |
Pivot Featured |
|
Max Buy |
CHDN
-
NASDAQ
Churchill Downs Inc
LEISURE - Gaming Activities
|
$114.89
|
-5.46
-4.54% |
$118.75
|
302,934
110.56% of 50 DAV
50 DAV is 274,000
|
$132.73
-13.44%
|
7/22/2019
|
$118.45
|
PP = $118.89
|
|
MB = $124.83
|
Most Recent Note - 8/5/2019 4:12:29 PM
Y - Abruptly retreating from its all-time high hit on 8/01/19 with today's 2nd consecutive loss nearly testing its 50 DMA line ($113.58). Reported Jun '19 earnings rose +10% on +26% sales revenues versus the year ago period, below the +25% minimum earnings guideline (C criteria). The prior low ($108.57 on 6/25/19) defines the next important near-term support to watch below its 50 DMA line.
>>> FEATURED STOCK ARTICLE : Volume Light While Hovering at Record High - 7/16/2019 |
View all notes |
Set NEW NOTE alert |
Company Profile |
SEC
News |
Chart |
Request a new note
C
A
S
I |
WWD
-
NASDAQ
Woodward Inc
MANUFACTURING - Diversified Machinery
|
$106.94
|
-2.90
-2.64% |
$107.90
|
699,273
137.38% of 50 DAV
50 DAV is 509,000
|
$119.20
-10.29%
|
6/18/2019
|
$112.34
|
PP = $114.65
|
|
MB = $120.38
|
Most Recent Note - 8/2/2019 1:28:39 PM
G - Slumping further below its 50 DMA line ($113.38) and raising concerns with below average volume behind today's 7th loss in the span of 8 sessions. A rebound above the 50 DMA line is needed for its outlook to improve. Subsequent gains for new highs backed by at least +40% above average volume may clinch a convincing technical buy signal. Due to report financial results after the close on Monday, August 5, 2019. Volume and volatility often increase near earnings news.
>>> FEATURED STOCK ARTICLE : Perched Near All-Time High After Gains Lacking Great Volume - 7/24/2019 |
View all notes |
Set NEW NOTE alert |
Company Profile |
SEC
News |
Chart |
Request a new note
C
A
S
I |
LULU
-
NASDAQ
Lululemon Athletica
MANUFACTURING - Textile Manufacturing
|
$174.46
|
-4.47
-2.50% |
$176.55
|
2,326,352
108.66% of 50 DAV
50 DAV is 2,141,000
|
$194.25
-10.19%
|
6/13/2019
|
$174.48
|
PP = $179.60
|
|
MB = $188.58
|
Most Recent Note - 8/2/2019 1:25:48 PM
G - Pulling back from its all-time high with today's 4th consecutive loss with below average volume, undercutting its 50 DMA line ($180.82) and raising concerns. Reported Apr '19 quarterly earnings +35% on +20% sales revenues versus the year ago period.
>>> FEATURED STOCK ARTICLE : Quietly Hovering at All-Time High - 7/17/2019 |
View all notes |
Set NEW NOTE alert |
Company Profile |
SEC
News |
Chart |
Request a new note
C
A
S
I |
ULTA
-
NASDAQ
Ulta Beauty Inc
SPECIALTY RETAIL - Specialty Retail, Other
|
$330.14
|
-6.88
-2.04% |
$331.98
|
717,432
94.90% of 50 DAV
50 DAV is 756,000
|
$368.83
-10.49%
|
3/15/2019
|
$341.27
|
PP = $322.59
|
|
MB = $338.72
|
Most Recent Note - 8/1/2019 5:51:09 PM
G - Sputtering near its 50 DMA line ($346.67). Volume totals have been mostly light while still hovering near its all-time high. Reported earnings +17% on +13% sales revenues for the Apr '19 quarter, below the +25% minimum earnings guideline (C criteria), raising fundamental concerns.
>>> FEATURED STOCK ARTICLE : Stalled After Recently Wedging to New Record High - 7/5/2019 |
View all notes |
Set NEW NOTE alert |
Company Profile |
SEC
News |
Chart |
Request a new note
C
A
S
I |
CHGG
-
NYSE
Chegg Inc
Consumer Svcs-Education
|
$43.12
|
-1.64
-3.66% |
$43.77
|
1,414,837
93.33% of 50 DAV
50 DAV is 1,516,000
|
$48.22
-10.58%
|
7/8/2019
|
$44.11
|
PP = $41.79
|
|
MB = $43.88
|
Most Recent Note - 8/5/2019 3:59:48 PM
Y - Gapped down today amid widespread market weakness (M criteria). Color code is changed to yellow after pulling back below the previously cited "max buy" level. Prior highs in the $40-41 area define important near-term support to watch along with its 50 DMA line ($40.72). Reported earnings +92% on +26% sales revenues for the Jun '19 quarter.
>>> FEATURED STOCK ARTICLE : Tallied a Big Volume-Driven Breakout Gain for a New High - 7/8/2019 |
View all notes |
Set NEW NOTE alert |
Company Profile |
SEC
News |
Chart |
Request a new note
C
A
S
I |
Symbol/Exchange
Company Name
Industry Group |
PRICE |
CHANGE
(%Change) |
Day High |
Volume
(% DAV)
(% 50 day avg vol) |
52 Wk Hi
% From Hi |
Featured
Date |
Price
Featured |
Pivot Featured |
|
Max Buy |
VEEV
-
NYSE
Veeva Systems Inc Cl A
Computer Sftwr-Medical
|
$155.99
|
-6.82
-4.19% |
$158.58
|
1,753,121
105.48% of 50 DAV
50 DAV is 1,662,000
|
$176.90
-11.82%
|
5/30/2019
|
$154.32
|
PP = $145.80
|
|
MB = $153.09
|
Most Recent Note - 8/5/2019 4:15:49 PM
G - Undercut yet closed above the prior low ($155 on 6/27/19) as it gapped down below its 50 DMA line ($163.58) with today's 3rd consecutive loss raising greater concerns. Fundamentals remain strong.
>>> FEATURED STOCK ARTICLE : Recently Found Support Near 50-Day Moving Average - 8/1/2019 |
View all notes |
Set NEW NOTE alert |
Company Profile |
SEC
News |
Chart |
Request a new note
C
A
S
I |
PAYC
-
NYSE
Paycom Software Inc
COMPUTER SOFTWARE and SERVICES - Application Software
|
$221.17
|
-15.35
-6.49% |
$228.43
|
1,059,741
146.78% of 50 DAV
50 DAV is 722,000
|
$246.85
-10.40%
|
2/6/2019
|
$171.66
|
PP = $164.18
|
|
MB = $172.39
|
Most Recent Note - 8/5/2019 4:09:03 PM
G - Gapped down and violated its 50 DMA line with today's volume-driven loss triggering a technical sell signal. Last week it reported earnings +27% on +31% sales revenues for the Jun '19 quarter, continuing its strong earnings track record. See the latest FSU analysis for more details and an annotated graph.
>>> FEATURED STOCK ARTICLE : Found Support and Gapped Up Following Earnings Report - 8/2/2019 |
View all notes |
Set NEW NOTE alert |
Company Profile |
SEC
News |
Chart |
Request a new note
C
A
S
I |
PYPL
-
NASDAQ
Paypal Holdings Inc
Finance-CrdtCard/PmtPr
|
$103.60
|
-3.49
-3.26% |
$105.39
|
11,317,090
179.21% of 50 DAV
50 DAV is 6,315,000
|
$121.48
-14.72%
|
1/24/2019
|
$92.56
|
PP = $93.80
|
|
MB = $98.49
|
Most Recent Note - 8/5/2019 4:21:46 PM
Slumped further below its 50 DMA line ($114.90) and the prior low today with above average volume while adding to a damaging spurt of losses. It will be dropped from the Featured Stocks list tonight. A rebound above the 50 DMA line is needed for its outlook to improve. Reported Jun '19 quarterly earnings +48% on +12% sales revenues versus the year ago period.
>>> FEATURED STOCK ARTICLE : Perched Near Record High Ahead of Earnings News - 7/23/2019 |
View all notes |
Set NEW NOTE alert |
Company Profile |
SEC
News |
Chart |
Request a new note
C
A
S
I |
PLNT
-
NYSE
Planet Fitness Inc Cl A
Leisure-Services
|
$74.74
|
-1.86
-2.43% |
$76.14
|
1,384,117
94.29% of 50 DAV
50 DAV is 1,468,000
|
$81.90
-8.74%
|
7/26/2019
|
$79.15
|
PP = $82.00
|
|
MB = $86.10
|
Most Recent Note - 8/1/2019 5:49:23 PM
Y - Volume totals have been cooling while still consolidating above its 50 DMA line ($76.69). Volume-driven gains above the pivot point are needed to trigger a new (or add-on) technical buy signal. Due to report earnings news on 8/06/19.
>>> FEATURED STOCK ARTICLE : Fitness Firm Forming a New Base - 7/26/2019 |
View all notes |
Set NEW NOTE alert |
Company Profile |
SEC
News |
Chart |
Request a new note
C
A
S
I |
BLD
-
NYSE
Topbuild Corp
Bldg-Constr Prds/Misc
|
$87.85
|
-1.63
-1.82% |
$90.05
|
452,779
138.89% of 50 DAV
50 DAV is 326,000
|
$89.96
-2.35%
|
5/17/2019
|
$82.19
|
PP = $87.31
|
|
MB = $91.68
|
Most Recent Note - 8/2/2019 1:17:37 PM
Y - Trading up today near all-time high following a considerable volume-driven gain on the prior session. Bullish action came after it reported earnings +39% on +9% sales revenues for the Jun '19 quarter versus the year ago period, continuing its strong earnings track record. Members were reminded - "Volume and volatility often increase near earnings news. A gain and strong close above the pivot point backed by at least +40% above average volume may clinch a convincing technical buy signal. Its 50 DMA line and recent lows define near-term support to watch on pullbacks."
>>> FEATURED STOCK ARTICLE : Perched Near 52-Week High Finding Support - 7/25/2019 |
View all notes |
Set NEW NOTE alert |
Company Profile |
SEC
News |
Chart |
Request a new note
C
A
S
I |
Symbol/Exchange
Company Name
Industry Group |
PRICE |
CHANGE
(%Change) |
Day High |
Volume
(% DAV)
(% 50 day avg vol) |
52 Wk Hi
% From Hi |
Featured
Date |
Price
Featured |
Pivot Featured |
|
Max Buy |
TEAM
-
NASDAQ
Atlassian Corp Plc Cl A
Comp Sftwr-Spec Enterprs
|
$133.19
|
-8.01
-5.67% |
$136.96
|
1,829,157
138.68% of 50 DAV
50 DAV is 1,319,000
|
$149.80
-11.09%
|
5/24/2019
|
$129.52
|
PP = $132.09
|
|
MB = $138.69
|
Most Recent Note - 8/5/2019 4:27:26 PM
Y - Color code is changed to yellow after gapping down and slumping below its "max buy" level as it also undercut the 50 DMA line ($133.07). Its prior low ($123.43 on 6/25/19) defines important near-term support to watch where a violation would raise serious concerns and trigger a more worrisome technical sell signal. Reported earnings +43% on +36% sales revenues for the Jun '19 quarter, continuing its strong earnings track record.
>>> FEATURED STOCK ARTICLE : Abrupt Retreat After Getting Very Extended From Prior Base - 7/29/2019 |
View all notes |
Set NEW NOTE alert |
Company Profile |
SEC
News |
Chart |
Request a new note
C
A
S
I |
GLOB
-
NYSE
Globant SA
Computer-Tech Services
|
$103.38
|
-4.79
-4.43% |
$105.75
|
267,592
63.41% of 50 DAV
50 DAV is 422,000
|
$112.33
-7.97%
|
2/15/2019
|
$69.35
|
PP = $70.00
|
|
MB = $73.50
|
Most Recent Note - 8/5/2019 4:17:25 PM
G - Pulled back from its all-time high with today's 2nd consecutive loss on below average volume. Very extended from any sound base. Its 50 DMA line ($101.55) defines important support to watch. Fundamentals remain strong.
>>> FEATURED STOCK ARTICLE : Extended From Any Sound Base After Wedging Higher - 7/11/2019 |
View all notes |
Set NEW NOTE alert |
Company Profile |
SEC
News |
Chart |
Request a new note
C
A
S
I |
TTD
-
NASDAQ
The Trade Desk Inc Cl A
Comml Svcs-Advertising
|
$249.78
|
-11.20
-4.29% |
$255.49
|
1,981,413
138.46% of 50 DAV
50 DAV is 1,431,000
|
$279.71
-10.70%
|
7/18/2019
|
$240.61
|
PP = $258.10
|
|
MB = $271.01
|
Most Recent Note - 8/5/2019 1:02:06 PM
Y - Amid widespread weakness today it is undercutting the prior high ($258) and negating the recent breakout. The next important support to watch is its 50 DMA line ($238.94). Due to report earnings news on 8/08/19.
>>> FEATURED STOCK ARTICLE : Endured Distributional Pressure While Building on New Base - 7/18/2019 |
View all notes |
Set NEW NOTE alert |
Company Profile |
SEC
News |
Chart |
Request a new note
C
A
S
I |
PAGS
-
NYSE
Pagseguro Digital Cl A
Finance-CrdtCard/PmtPr
|
$43.27
|
-2.37
-5.19% |
$44.78
|
2,310,231
101.95% of 50 DAV
50 DAV is 2,266,000
|
$48.88
-11.48%
|
6/25/2019
|
$37.69
|
PP = $40.07
|
|
MB = $42.07
|
Most Recent Note - 8/5/2019 4:07:08 PM
G - Gapped down today for a loss with higher (near average) volume amid widespread market weakness (M criteria). Prior high in the $40 area defines initial support to watch above its 50 DMA line ($39.70).
>>> FEATURED STOCK ARTICLE : Encountering Distributional Pressure After Impressive Sprint - 7/30/2019 |
View all notes |
Set NEW NOTE alert |
Company Profile |
SEC
News |
Chart |
Request a new note
C
A
S
I |
|
|
|
THESE ARE NOT BUY RECOMMENDATIONS!
Comments contained in the body of this report are technical
opinions only. The material herein has been obtained
from sources believed to be reliable and accurate, however,
its accuracy and completeness cannot be guaranteed.
This site is not an investment advisor, hence it does
not endorse or recommend any securities or other investments.
Any recommendation contained in this report may not
be suitable for all investors and it is not to be deemed
an offer or solicitation on our part with respect to
the purchase or sale of any securities. All trademarks,
service marks and trade names appearing in this report
are the property of their respective owners, and are
likewise used for identification purposes only.
This report is a service available
only to active Paid Premium Members.
You may opt-out of receiving report notifications
at any time. Questions or comments may be submitted
by writing to Premium Membership Services 665 S.E. 10 Street, Suite 201 Deerfield Beach, FL 33441-5634 or by calling 1-800-965-8307
or 954-785-1121.
|
|
|

