You are not logged in.
This means you
CAN ONLY VIEW reports that were published prior to Sunday, February 18, 2024.
You
MUST UPGRADE YOUR MEMBERSHIP if you want to see any current reports.
AFTER MARKET UPDATE - THURSDAY, AUGUST 4TH, 2022
Previous After Market Report Next After Market Report >>>
|
|
|
|
DOW |
-85.68 |
32,726.82 |
-0.26% |
|
Volume |
879,047,650 |
+2% |
|
Volume |
5,417,581,300 |
-4% |
|
NASDAQ |
+52.42 |
12,720.58 |
+0.41% |
|
Advancers |
1,472 |
48% |
|
Advancers |
2,564 |
58% |
|
S&P 500 |
-3.23 |
4,151.94 |
-0.08% |
|
Decliners |
1,619 |
52% |
|
Decliners |
1,824 |
42% |
|
Russell 2000 |
-2.47 |
1,906.46 |
-0.13% |
|
52 Wk Highs |
29 |
|
|
52 Wk Highs |
70 |
|
|
S&P 600 |
-10.07 |
1,233.30 |
-0.81% |
|
52 Wk Lows |
37 |
|
|
52 Wk Lows |
51 |
|
|
 |
Leadership Improved but Major Indices Ended Mixed
Kenneth J. Gruneisen - Passed the CAN SLIM® Master's Exam
The S&P 500 shed less than 0.1%, while the Nasdaq Composite rose 0.4%. Both indexes are aiming for their first three-week winning streak since the end of the first quarter. The Dow lost 85 points, positioned for a modest weekly decline. The volume totals reported were mixed, higher than the prior session on the NYSE and lighter on the Nasdaq exchange. Advancers led decliners by a 4-3 margin on the Nasdaq exchange but decliners narrowly outnumbered advancers on the NYSE. There were 22 high-ranked companies from the Leaders List that hit new 52-week highs and were listed on the BreakOuts Page, doubling the total of 11 on the prior session. New 52-week highs were outnumbered by new 52-week lows on the NYSE, meanwhile news highs outnumbered new lows on the Nasdaq exchange for the first time since April 4th. The market is in a confirmed uptrend (M criteria). Any sustainable rally requires a healthy crop of leading stocks hitting new highs, so the recent improvement in leadership was a reassuring sign.
Chart courtesy of www.stockcharts.com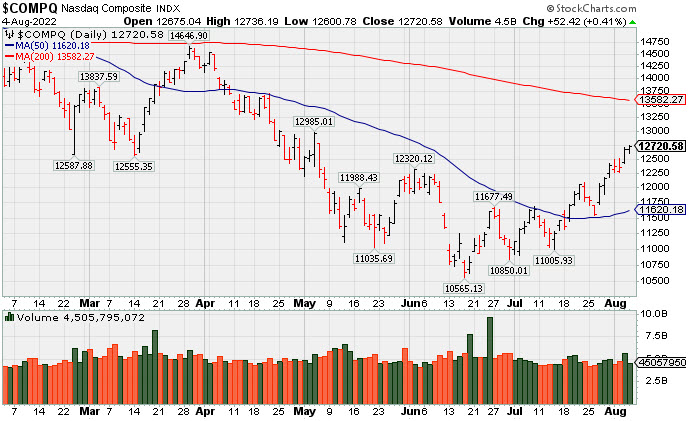 PICTURED: The Nasdaq Composite Index posted a gain with lighter volume. It has recently been making progress above its June high but still remains well below its 200 DMA line.
U.S. stocks finished mixed on Thursday in largely uneventful trading as investors await tomorrow’s jobs report and next week’s Consumer Price Index (CPI) reading. West Texas Intermediate dropped 2.4% to $88.50/barrel, dipping below $90/barrel for the first time since February amid concerns over the economic outlook and weakening demand.
Meanwhile, shorter-term Treasuries strengthened as market participants continued to assess the path of future Federal Reserve (Fed) tightening. The yield on the 10-year note ended four basis points (0.04%) lower at 2.66%. Yesterday, commentary from San Francisco Fed President Mary Daly said a 0.50% rate increase at its September meeting seems to be “a reasonable thing to do,” dampening expectations for a more aggressive 0.75% rate hike. Across the pond, the Bank of England opted for its first 0.50% rate hike since 1995, with policymakers offering a downbeat economic assessment. Meanwhile, the 30-year U.S. fixed-rate mortgage fell below 5.00% for the first time since early April. On the data front, weekly initial jobless claims came in at 260,000, in-line with estimates and back near the highest level since November.
In earnings, Clorox Co. (CLX -4.71%) fell on disappointing guidance highlighting the looming impact of inflation. Eli Lilly and Co. (LLY -2.56%) fell after its revenue missed consensus estimates, with the drug maker also slashing its full-year outlook. In other corporate news, Walmart Inc. (WMT -3.78%) slumped on plans to cut roughly 200 corporate jobs.
|
 Kenneth J. Gruneisen started out as a licensed stockbroker in August 1987, a couple of months prior to the historic stock market crash that took the Dow Jones Industrial Average down -22.6% in a single day. He has published daily fact-based fundamental and technical analysis on high-ranked stocks online for two decades. Through FACTBASEDINVESTING.COM, Kenneth provides educational articles, news, market commentary, and other information regarding proven investment systems that work in good times and bad.
Comments contained in the body of this report are technical opinions only and are not necessarily those of Gruneisen Growth Corp. The material herein has been obtained from sources believed to be reliable and accurate, however, its accuracy and completeness cannot be guaranteed. Our firm, employees, and customers may effect transactions, including transactions contrary to any recommendation herein, or have positions in the securities mentioned herein or options with respect thereto. Any recommendation contained in this report may not be suitable for all investors and it is not to be deemed an offer or solicitation on our part with respect to the purchase or sale of any securities. |
|
 |
Retail, Tech, Broker/Dealer, and Gold & Silver Indexes Rose
Kenneth J. Gruneisen - Passed the CAN SLIM® Master's Exam
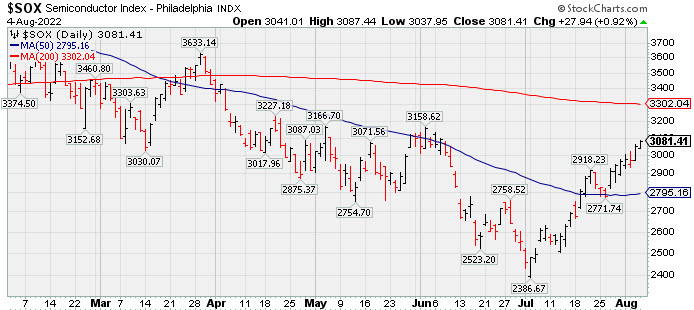
The Retail Index ($RLX +1.15%) and Broker/Dealer Index ($XBD +1.60%) both posted influential gains but the Bank Index ($BKX -1.09%) ended lower. The Biotech Index ($BTK +2.71%) led the tech sector while the Semiconductor Index ($SOX +0.92%) notched a smaller gain but the Networking Index ($NWX -0.28%) edged lower. Commodity-linked groups were mixed as the Gold & Silver Index ($XAU +3.46%) posted a solid gain while the Oil Services Index ($OSX -4.73%) and Integrated Oil Index ($XOI -3.27%) both suffered big losses.
PICTURED: The Semiconductor Index ($SOX +0.92%) has been rebounding toward its 200-day moving average (DMA) line.
| Oil Services |
$OSX |
62.72 |
-3.11 |
-4.73% |
+18.96% |
| Integrated Oil |
$XOI |
1,470.67 |
-49.72 |
-3.27% |
+24.82% |
| Semiconductor |
$SOX |
3,081.41 |
+27.94 |
+0.92% |
-21.91% |
| Networking |
$NWX |
806.83 |
-2.25 |
-0.28% |
-16.91% |
| Broker/Dealer |
$XBD |
450.91 |
+7.11 |
+1.60% |
-7.38% |
| Retail |
$RLX |
3,495.60 |
+39.59 |
+1.15% |
-17.29% |
| Gold & Silver |
$XAU |
108.18 |
+3.62 |
+3.46% |
-18.32% |
| Bank |
$BKX |
107.18 |
-1.18 |
-1.09% |
-18.94% |
| Biotech |
$BTK |
5,065.84 |
+133.48 |
+2.71% |
-8.20% |
|
|
|
 |
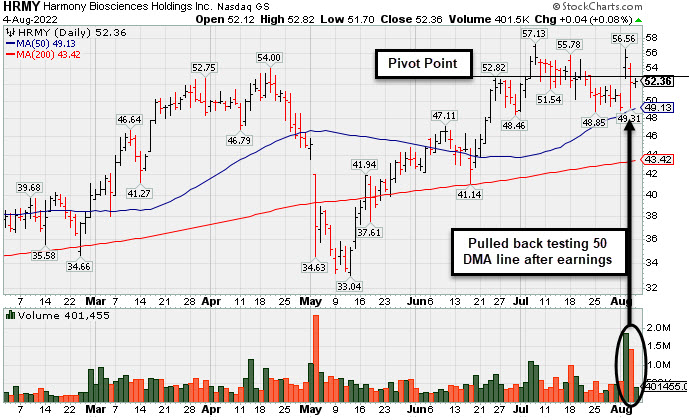
Churning Higher Volume While Perched Near High After Earnings News
Kenneth J. Gruneisen - Passed the CAN SLIM® Master's Exam
Harmony Biosciences Hldg (HRMY +$0.04 or +0.08% to $52.36) held its ground today. On the prior session its intra-day low tested its 50-day moving average (DMA) line ($49.13) and prior low. It had challenged its all-time high with above average volume behind a big gain on Tuesday's session after it reported Jun '22 quarterly earnings +54% on +45% sales revenues versus the year ago period. Volume and volatility often increase near earnings news.
HRMY has made little headway since highlighted in yellow with pivot point cited based on its 6/27/22 high in the 7/06/22 mid-day report (read here). It stalled after hitting a new all-time high (N criteria) back then with a gain and close above the pivot point backed by +118% above average volume triggering a technical buy signal. It was last shown in this FSU section on 7/18/22 with detailed analysis and an annotated graph under the headline, "Harmony Has Been Encountering Distributional Pressure".
The high-ranked Medical-Biomed/Biotech firm's annual earnings history (A criteria) is limited, however it has an 80 Earnings Per Share Rating. It completed its $24 IPO on 8/19/20. Its small supply of only 23.6 million shares (S criteria) in the public float can contribute to greater price volatility in the event of institutional buying or selling. The number of top-rated funds owning its shares rose from 208 in Sep '21 to 406 in Jun '22, a reassuring sign concerning the I criteria. Its current Up/Down Volume Ratio of 1.2 is an unbiased indication its shares have been under accumulation over the past 50 days.
|
|
|
Color Codes Explained :
Y - Better candidates highlighted by our
staff of experts.
G - Previously featured
in past reports as yellow but may no longer be buyable under the
guidelines.
***Last / Change / Volume data in this table is the closing quote data***
Symbol/Exchange
Company Name
Industry Group |
PRICE |
CHANGE
(%Change) |
Day High |
Volume
(% DAV)
(% 50 day avg vol) |
52 Wk Hi
% From Hi |
Featured
Date |
Price
Featured |
Pivot Featured |
|
Max Buy |
 LLY
-
NYSE
LLY
-
NYSE
Eli Lilly & Co
Medical-Diversified
|
$305.79
|
-8.04
-2.56% |
$310.25
|
4,693,713
163.26% of 50 DAV
50 DAV is 2,875,000
|
$335.33
-8.81%
|
5/16/2022
|
$302.46
|
PP = $314.10
|
|
MB = $329.81
|
 Most Recent Note - 8/4/2022 1:00:48 PM
G - Color code is changed to green while today's 5th consecutive loss is clearly violating its 50 DMA line ($316.24) raising concerns and triggering a technical sell signal. Only a prompt rebound above the 50 DMA line would help its outlook improve.
>>> FEATURED STOCK ARTICLE : Hovering Near "Max Buy" Level With Volume Totals Cooling - 7/22/2022 |
View all notes |
Set NEW NOTE alert |
Company Profile |
SEC
News |
Chart |
Request a new note
C
A
S
I |
IMXI
-
NASDAQ
International Money Exp
Financial Svcs-Specialty
|
$24.38
|
-0.61
-2.44% |
$25.25
|
432,945
96.64% of 50 DAV
50 DAV is 448,000
|
$25.14
-3.02%
|
7/1/2022
|
$21.27
|
PP = $21.38
|
|
MB = $22.45
|
Most Recent Note - 8/3/2022 12:32:01 PM
G - Reported Jun '22 quarterly earnings +26% on +21% sales revenues versus the year ago period. Volume and volatility often increase near earnings news. Perched at its 52-week high. Its 50 DMA line ($21.26) defines important near-term support to watch on pullbacks.
>>> FEATURED STOCK ARTICLE : Finished Strong With Another Volume-Driven Gain After Earnings - 8/3/2022 |
View all notes |
Set NEW NOTE alert |
Company Profile |
SEC
News |
Chart |
Request a new note
C
A
S
I |
HRMY
-
NASDAQ
Harmony Biosciences Hldg
Medical-Biomed/Biotech
|
$52.36
|
+0.04
0.08% |
$52.82
|
401,455
76.91% of 50 DAV
50 DAV is 522,000
|
$57.13
-8.35%
|
7/6/2022
|
$54.12
|
PP = $52.85
|
|
MB = $55.49
|
Most Recent Note - 8/4/2022 6:39:45 PM
Y - Held its ground today with lighter volume. On the prior session it tested support near its 50 DMA line ($49.13) and prior low. Challenged its all-time high with above average volume behind a big gain on Tuesday after reporting Jun '22 quarterly earnings +54% on +45% sales revenues versus the year ago period. Volume and volatility often increase near earnings news. See the latest FSU analysis for more details and a new annotated graph.
>>> FEATURED STOCK ARTICLE : Churning Higher Volume While Perched Near High After Earnings News - 8/4/2022 |
View all notes |
Set NEW NOTE alert |
Company Profile |
SEC
News |
Chart |
Request a new note
C
A
S
I |
CI
-
NYSE
Cigna Corp
Medical-Managed Care
|
$280.10
|
+8.36
3.08% |
$284.46
|
3,654,315
186.06% of 50 DAV
50 DAV is 1,964,000
|
$282.33
-0.79%
|
7/7/2022
|
$276.55
|
PP = $273.68
|
|
MB = $287.36
|
Most Recent Note - 8/4/2022 12:20:33 PM
Y - Gapped up today for a gain hitting a new all-time high, however it is still below its "max buy" level. Reported earnings news for the Jun '22 quarter +19% on +5% sales revenues versus the year ago period, breaking a streak of 3 quarterly earnings increases above the +25% minimum guideline (C criteria). Volume and volatility often increase near earnings news. Near-term support to watch is at its 50 DMA line ($265.69).
>>> FEATURED STOCK ARTICLE : Pulled Back and Tested Support at 50-Day Moving Average - 7/19/2022 |
View all notes |
Set NEW NOTE alert |
Company Profile |
SEC
News |
Chart |
Request a new note
C
A
S
I |
AN
-
NYSE
Autonation Inc
SPECIALTY RETAIL - Auto Dealerships
|
$119.71
|
-0.37
-0.31% |
$121.28
|
436,677
59.41% of 50 DAV
50 DAV is 735,000
|
$133.48
-10.32%
|
7/20/2022
|
$122.03
|
PP = $126.49
|
|
MB = $132.81
|
Most Recent Note - 8/3/2022 6:56:48 PM
Y - Posted a small gain backed by lighter than average volume today. Recent rebound above its 200 DMA line and 50 DMA line ($116) helped its outlook to improve. Subsequent volume-driven gains above the pivot point may trigger a technical buy signal. Reported Jun '22 quarterly earnings +34% on -2% sales revenues versus the year ago period. Faces some resistance due to overhead supply up to the $133 level.
>>> FEATURED STOCK ARTICLE : Autonation Earnings Due While Perched Near Pivot Point - 7/20/2022 |
View all notes |
Set NEW NOTE alert |
Company Profile |
SEC
News |
Chart |
Request a new note
C
A
S
I |
Symbol/Exchange
Company Name
Industry Group |
PRICE |
CHANGE
(%Change) |
Day High |
Volume
(% DAV)
(% 50 day avg vol) |
52 Wk Hi
% From Hi |
Featured
Date |
Price
Featured |
Pivot Featured |
|
Max Buy |
ESQ
-
NASDAQ
Esquire Financial Hldgs
Finance-Commercial Loans
|
$36.64
|
+0.08
0.22% |
$36.95
|
14,673
24.46% of 50 DAV
50 DAV is 60,000
|
$39.09
-6.27%
|
7/26/2022
|
$37.74
|
PP = $39.19
|
|
MB = $41.15
|
Most Recent Note - 8/4/2022 6:49:31 PM
Y - Posted 2 gains with lighter volume since briefly undercutting its 50 DMA line ($35.29) but showing resilience on Tuesday. Subsequent gains above the pivot point backed by at least +40% above average volume may trigger a technical buy signal. Its 50 DMA line defines initial support above its 200 DMA line ($34).
>>> FEATURED STOCK ARTICLE : Volume Driven Gains Approaching Prior High - 7/26/2022 |
View all notes |
Set NEW NOTE alert |
Company Profile |
SEC
News |
Chart |
Request a new note
C
A
S
I |
GPK
-
NYSE
Graphic Packaging Hldg
CONSUMER NON-DURABLES - Packaging and Containers
|
$21.57
|
-0.34
-1.55% |
$22.01
|
2,542,985
87.78% of 50 DAV
50 DAV is 2,897,000
|
$22.99
-6.18%
|
7/26/2022
|
$22.63
|
PP = $23.09
|
|
MB = $24.24
|
Most Recent Note - 8/3/2022 6:51:47 PM
Y - Volume totals have been cooling while hovering near its 52-week high. Highlighted in yellow in the 7/26/22 mid-day report with pivot point cited based on its 6/06/22 high plus 10 cents. Subsequent gains above the pivot point backed by at least +40% above average volume are needed to trigger a proper technical buy signal.
>>> FEATURED STOCK ARTICLE : Negative Reversal After Matching 52-Week High - 7/27/2022 |
View all notes |
Set NEW NOTE alert |
Company Profile |
SEC
News |
Chart |
Request a new note
C
A
S
I |
CSL
-
NYSE
Carlisle Cos Inc
Diversified Operations
|
$289.05
|
+1.10
0.38% |
$291.47
|
506,590
138.79% of 50 DAV
50 DAV is 365,000
|
$297.34
-2.79%
|
7/28/2022
|
$282.31
|
PP = $275.23
|
|
MB = $288.99
|
Most Recent Note - 8/4/2022 6:45:47 PM
G - Holding its ground stubbornly perched near its all-time high following noted volume-driven gains. Prior highs in the $275 area define initial support to watch on pullbacks.
>>> FEATURED STOCK ARTICLE : Carlisle Perched at All-Time High After Noted Breakout - 8/2/2022 |
View all notes |
Set NEW NOTE alert |
Company Profile |
SEC
News |
Chart |
Request a new note
C
A
S
I |
ENPH
-
NASDAQ
Enphase Energy Inc
Energy-Solar
|
$295.82
|
+5.57
1.92% |
$298.24
|
2,952,061
93.15% of 50 DAV
50 DAV is 3,169,000
|
$298.97
-1.05%
|
7/28/2022
|
$276.66
|
PP = $282.55
|
|
MB = $296.68
|
Most Recent Note - 8/4/2022 6:47:22 PM
Y - Posted a gain today with near average volume rising near its "max buy" level. The prior high in the $282 area was noted as initial support to watch. Fundamentals remain strong after reporting solid Jun '22 quarterly results, continuing its strong earnings history.
>>> FEATURED STOCK ARTICLE : Pullback Following 3 Consecutive Gains With Heavier Volume - 8/1/2022 |
View all notes |
Set NEW NOTE alert |
Company Profile |
SEC
News |
Chart |
Request a new note
C
A
S
I |
PWR
-
NYSE
Quanta Services Inc
MATERIALS and CONSTRUCTION - General Contractors
|
$133.41
|
-3.65
-2.66% |
$136.11
|
1,779,095
115.00% of 50 DAV
50 DAV is 1,547,000
|
$146.84
-9.15%
|
7/28/2022
|
$141.83
|
PP = $140.14
|
|
MB = $147.15
|
Most Recent Note - 8/4/2022 6:52:11 PM
Y - Pulled by today with higher volume for a 5th consecutive loss following a noted "negative reversal" on 7/29/22 at its all-time high. Slumped below its pivot point raising some concerns following the recently noted breakout. Reported Jun '22 quarterly earnings +45% on +41% sales revenues versus the year ago period. Volume and volatility often increase near earnings news.
>>> FEATURED STOCK ARTICLE : Volume-Driven Breakout for Quanta Services - 7/28/2022 |
View all notes |
Set NEW NOTE alert |
Company Profile |
SEC
News |
Chart |
Request a new note
C
A
S
I |
Symbol/Exchange
Company Name
Industry Group |
PRICE |
CHANGE
(%Change) |
Day High |
Volume
(% DAV)
(% 50 day avg vol) |
52 Wk Hi
% From Hi |
Featured
Date |
Price
Featured |
Pivot Featured |
|
Max Buy |
CLFD
-
NASDAQ
Clearfield Inc
TELECOMMUNICATIONS - Cables / Satalite Equipment
|
$103.21
|
+0.19
0.18% |
$108.93
|
487,287
257.82% of 50 DAV
50 DAV is 189,000
|
$105.36
-2.04%
|
7/29/2022
|
$94.10
|
PP = $86.81
|
|
MB = $91.15
|
Most Recent Note - 8/4/2022 12:20:59 PM
G - Powering further into new high territory today with yet another gain backed by above average volume, rallying well above its "max buy" level. Prior high in the $86 area defines initial support to watch on pullbacks. Fundamentals remain strong after it reported Jun '22 quarterly earnings +109% on +84% sales revenues above the year ago period.
>>> FEATURED STOCK ARTICLE : Volume Heavy Behind Technical Breakout - 7/29/2022 |
View all notes |
Set NEW NOTE alert |
Company Profile |
SEC
News |
Chart |
Request a new note
C
A
S
I |
|
|
|
THESE ARE NOT BUY RECOMMENDATIONS!
Comments contained in the body of this report are technical
opinions only. The material herein has been obtained
from sources believed to be reliable and accurate, however,
its accuracy and completeness cannot be guaranteed.
This site is not an investment advisor, hence it does
not endorse or recommend any securities or other investments.
Any recommendation contained in this report may not
be suitable for all investors and it is not to be deemed
an offer or solicitation on our part with respect to
the purchase or sale of any securities. All trademarks,
service marks and trade names appearing in this report
are the property of their respective owners, and are
likewise used for identification purposes only.
This report is a service available
only to active Paid Premium Members.
You may opt-out of receiving report notifications
at any time. Questions or comments may be submitted
by writing to Premium Membership Services 665 S.E. 10 Street, Suite 201 Deerfield Beach, FL 33441-5634 or by calling 1-800-965-8307
or 954-785-1121.
|
|
|