You are not logged in.
This means you
CAN ONLY VIEW reports that were published prior to Tuesday, February 20, 2024.
You
MUST UPGRADE YOUR MEMBERSHIP if you want to see any current reports.
AFTER MARKET UPDATE - TUESDAY, AUGUST 2ND, 2022
Previous After Market Report Next After Market Report >>>
|
|
|
|
DOW |
-402.23 |
32,396.17 |
-1.23% |
|
Volume |
894,386,571 |
+3% |
|
Volume |
4,710,602,300 |
+7% |
|
NASDAQ |
-20.22 |
12,348.76 |
-0.16% |
|
Advancers |
1,393 |
45% |
|
Advancers |
2,260 |
51% |
|
S&P 500 |
-27.44 |
4,091.19 |
-0.67% |
|
Decliners |
1,685 |
55% |
|
Decliners |
2,134 |
49% |
|
Russell 2000 |
-0.86 |
1,882.45 |
-0.05% |
|
52 Wk Highs |
35 |
|
|
52 Wk Highs |
54 |
|
|
S&P 600 |
-10.40 |
1,232.17 |
-0.84% |
|
52 Wk Lows |
32 |
|
|
52 Wk Lows |
95 |
|
|
 |
Mixed Breadth as Major Indices Pulled Back
Kenneth J. Gruneisen - Passed the CAN SLIM® Master's Exam
The Dow lost 402 points, while the S&P 500 shed 0.7%. The Nasdaq Composite ended just below the flat line. The volume totals reported were higher than the prior session on the NYSE and on the Nasdaq exchange, indicative of distributional pressure. Breadth was fairly even as advancers led decliners by a narrow margin on the Nasdaq exchange while decliners led advancers by a narrow margin on the NYSE. There were 20 high-ranked companies from the Leaders List that hit new 52-week highs and were listed on the BreakOuts Page, down from the total of 27 on the prior session. New 52-week highs just outnumbered new 52-week lows on the NYSE, but new lows still outnumbered new highs on the Nasdaq exchange. The market is in a confirmed uptrend (M criteria). Any sustainable rally requires a healthy crop of leading stocks hitting new highs, so the recent improvement in leadership was a reassuring sign.
Chart courtesy of www.stockcharts.com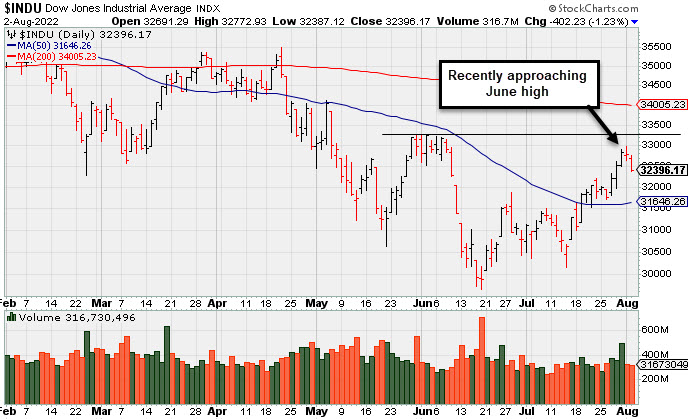 PICTURED: The Dow Jones Industrial Average pulled back for a 2nd consecutive session with lighter volume. It has recently been approaching its June high and still remains well below its 200 DMA line.
U.S. stocks finished lower Tuesday as market participants remained cautious amid rising geopolitical tensions. Capturing headlines today was the fact that U.S. House Speaker Nancy Pelosi became the highest-ranking American politician to visit Taiwan in 25 years--a controversial move, as China considers the nation its territory. In response to her arrival, China announced missile tests and military drills in the Taiwan Strait, marking its most provocative actions in decades. A gauge of the U.S. dollar jumped 0.8%.
Despite the perceived risk off tone in equity markets, Treasuries erased early session gains following central bank rhetoric. The yield on the 10-year note advanced for the first time in five sessions, spiking 17 basis points (0.17%) to 2.76%. San Francisco Federal Reserve (Fed) President Mary Daly stated that policymakers’ work to pacify inflation was “nowhere near almost done.” Meanwhile, the tone from Chicago Fed President Charles Evans was less hawkish than Daly’s, as he suggested the pace of rate hikes could slow later this year. On the data front, the Jobs Openings and Labor Turnover Survey (JOLTS) fell to a nine-month low in June, serving as a sign of softening demand for labor amid growing economic pressures.
In earnings, Caterpillar Inc. (CAT -5.82%) fell following mixed results that included a revenue miss and a decline in sales in Asia, as the heavy equipment maker grappled with headwinds including higher input costs and ongoing supply chain issues. In Energy, Marathon Petroleum Corp. (MPC +3.65%) rose as the largest U.S. refiner delivered record profit in the second quarter.
|
 Kenneth J. Gruneisen started out as a licensed stockbroker in August 1987, a couple of months prior to the historic stock market crash that took the Dow Jones Industrial Average down -22.6% in a single day. He has published daily fact-based fundamental and technical analysis on high-ranked stocks online for two decades. Through FACTBASEDINVESTING.COM, Kenneth provides educational articles, news, market commentary, and other information regarding proven investment systems that work in good times and bad.
Comments contained in the body of this report are technical opinions only and are not necessarily those of Gruneisen Growth Corp. The material herein has been obtained from sources believed to be reliable and accurate, however, its accuracy and completeness cannot be guaranteed. Our firm, employees, and customers may effect transactions, including transactions contrary to any recommendation herein, or have positions in the securities mentioned herein or options with respect thereto. Any recommendation contained in this report may not be suitable for all investors and it is not to be deemed an offer or solicitation on our part with respect to the purchase or sale of any securities. |
|
 |
Oil Services, Broker/Dealer, and Biotech Indexes Led Group Gainers
Kenneth J. Gruneisen - Passed the CAN SLIM® Master's Exam
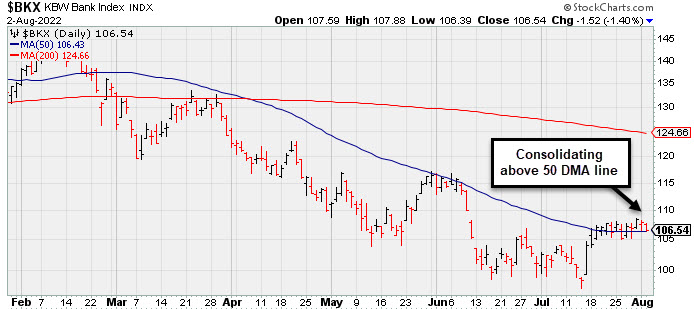
The Broker/Dealer Index ($XBD +0.40%) edged higher but the Retail Index ($RLX -1.22%) and Bank Index ($BKX -1.40%) both lost ground. The Semiconductor Index ($SOX -0.12%) ended slightly in the red while the Networking Index ($NWX +0.20%) and Biotech Index ($BTK +0.49%) each posted a small gain. Commodity-linked groups were mixed as the Oil Services Index ($OSX +1.55%) outpaced the Integrated Oil Index ($XOI +0.29%) to the upside, but the Gold & Silver Index ($XAU -1.39%) ended lower.
PICTURED: The Bank Index ($BKX -1.40%) has been consolidating above its 50-day moving average (DMA) line.
| Oil Services |
$OSX |
67.39 |
+1.03 |
+1.55% |
+27.83% |
| Integrated Oil |
$XOI |
1,566.24 |
+4.58 |
+0.29% |
+32.93% |
| Semiconductor |
$SOX |
2,974.75 |
-3.57 |
-0.12% |
-24.62% |
| Networking |
$NWX |
799.15 |
+1.56 |
+0.20% |
-17.71% |
| Broker/Dealer |
$XBD |
433.34 |
+1.71 |
+0.40% |
-10.99% |
| Retail |
$RLX |
3,354.25 |
-41.45 |
-1.22% |
-20.64% |
| Gold & Silver |
$XAU |
106.48 |
-1.50 |
-1.39% |
-19.61% |
| Bank |
$BKX |
106.54 |
-1.52 |
-1.40% |
-19.42% |
| Biotech |
$BTK |
4,750.12 |
+23.03 |
+0.49% |
-13.92% |
|
|
|
 |
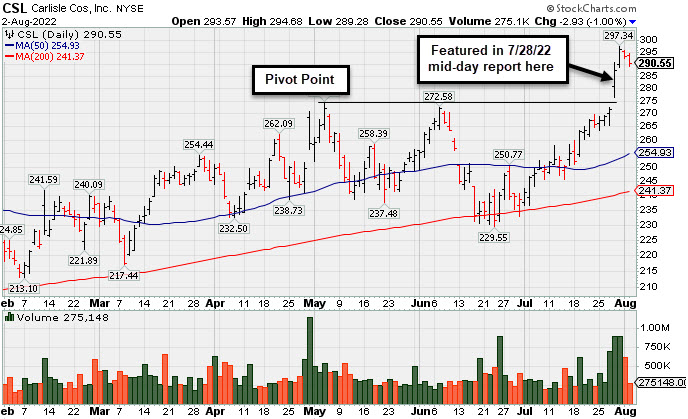
Carlisle Perched at All-Time High After Noted Breakout
Kenneth J. Gruneisen - Passed the CAN SLIM® Master's Exam
Carlisle Cos Inc (CSL -$2.93 or -1.00% to $290.55) saw light volume behind today's small loss while remaining perched near its all-time high. It rallied above its "max buy" level with 5 consecutive volume-driven gains. Bullish action continued since highlighted in yellow in the 7/28/22 mid-day report with pivot point cited based on its 5/04/22 high plus 10 cents. It found support in recent weeks at its 200 DMA line ($241).
CSL has a 98 Earnings Per Share Rating. It recently reported Jun '22 quarterly earnings +185% on +57% sales revenues versus the year ago period, its 4th very strong quarter well above the +25% minimum earnings guideline (C criteria). Annual earnings (A criteria) history included a small downturn in FY '20 that was previously noted.
There are 51.7 million shares outstanding, which can contribute to greater price volatility in the event of institutional buying or selling. The number of top-rated funds owning its shares rose from 772 in Sep '21 to 814 in Jun '22, a reassuring sign concerning the I criteria. Its current Up/Down Volume Ratio of 2.2 is an unbiased indication its shares have been under accumulation over the past 50 days. |
|
|
Color Codes Explained :
Y - Better candidates highlighted by our
staff of experts.
G - Previously featured
in past reports as yellow but may no longer be buyable under the
guidelines.
***Last / Change / Volume data in this table is the closing quote data***
Symbol/Exchange
Company Name
Industry Group |
PRICE |
CHANGE
(%Change) |
Day High |
Volume
(% DAV)
(% 50 day avg vol) |
52 Wk Hi
% From Hi |
Featured
Date |
Price
Featured |
Pivot Featured |
|
Max Buy |
 LLY
-
NYSE
LLY
-
NYSE
Eli Lilly & Co
Medical-Diversified
|
$320.20
|
-3.95
-1.22% |
$328.98
|
3,396,256
120.01% of 50 DAV
50 DAV is 2,830,000
|
$335.33
-4.51%
|
5/16/2022
|
$302.46
|
PP = $314.10
|
|
MB = $329.81
|
Most Recent Note - 8/1/2022 8:08:33 PM
Y - Pulled back with light volume today and its color code is changed to yellow after pulling back below its "max buy" level. Its 50 DMA line ($315.25) defines near-term support to watch.
>>> FEATURED STOCK ARTICLE : Hovering Near "Max Buy" Level With Volume Totals Cooling - 7/22/2022 |
View all notes |
Set NEW NOTE alert |
Company Profile |
SEC
News |
Chart |
Request a new note
C
A
S
I |
IMXI
-
NASDAQ
International Money Exp
Financial Svcs-Specialty
|
$24.93
|
+0.49
2.00% |
$25.14
|
699,782
160.13% of 50 DAV
50 DAV is 437,000
|
$24.43
2.05%
|
7/1/2022
|
$21.27
|
PP = $21.38
|
|
MB = $22.45
|
Most Recent Note - 8/1/2022 8:07:09 PM
G - Posted another gain today with above average volume hitting a new 52-week high, rising further above its "max buy" level. Its 50 DMA line ($21.04) defines important near-term support to watch on pullbacks. Due to report Jun '22 quarterly results on 8/03/22. Volume and volatility often increase near earnings news.
>>> FEATURED STOCK ARTICLE : Stalled Since Clearing Double Bottom Base - 7/15/2022 |
View all notes |
Set NEW NOTE alert |
Company Profile |
SEC
News |
Chart |
Request a new note
C
A
S
I |
HRMY
-
NASDAQ
Harmony Biosciences Holdings
Medical-Biomed/Biotech
|
$55.42
|
+6.19
12.57% |
$56.59
|
1,856,753
395.64% of 50 DAV
50 DAV is 469,300
|
$57.13
-2.99%
|
7/6/2022
|
$54.12
|
PP = $52.85
|
|
MB = $55.49
|
 Most Recent Note - 8/2/2022 12:35:00 PM
Y - Gapped up today challenging its all-time high with above average volume behind a big gain. Found support above its 50 DMA line ($48.66). Bullish action came after it reported Jun '22 quarterly earnings +54% on +45% sales revenues versus the year ago period.
>>> FEATURED STOCK ARTICLE : Harmony Has Been Encountering Distributional Pressure - 7/18/2022 |
View all notes |
Set NEW NOTE alert |
Company Profile |
SEC
News |
Chart |
Request a new note
C
A
S
I |
CI
-
NYSE
Cigna Corp
Medical-Managed Care
|
$271.44
|
-1.97
-0.72% |
$275.03
|
1,414,351
73.24% of 50 DAV
50 DAV is 1,931,000
|
$282.33
-3.86%
|
7/7/2022
|
$276.55
|
PP = $273.68
|
|
MB = $287.36
|
Most Recent Note - 8/1/2022 8:10:44 PM
Y - Pulled back with lighter than average volume today. Tested support at its 50 DMA line ($264) twice following a recent technical breakout. More damaging losses would raise greater concerns.
>>> FEATURED STOCK ARTICLE : Pulled Back and Tested Support at 50-Day Moving Average - 7/19/2022 |
View all notes |
Set NEW NOTE alert |
Company Profile |
SEC
News |
Chart |
Request a new note
C
A
S
I |
AN
-
NYSE
Autonation Inc
SPECIALTY RETAIL - Auto Dealerships
|
$116.23
|
-4.25
-3.53% |
$119.51
|
785,941
105.21% of 50 DAV
50 DAV is 747,000
|
$133.48
-12.92%
|
7/20/2022
|
$122.03
|
PP = $126.49
|
|
MB = $132.81
|
Most Recent Note - 8/2/2022 5:41:41 PM
Y - Pulled back today with near average volume following 4 consecutive gains. Recent rebound above its 200 DMA line and 50 DMA line ($115.77) helped its outlook to improve. Subsequent volume-driven gains above the pivot point may trigger a technical buy signal. Reported Jun '22 quarterly earnings +34% on -2% sales revenues versus the year ago period. Faces some resistance due to overhead supply up to the $133 level.
>>> FEATURED STOCK ARTICLE : Autonation Earnings Due While Perched Near Pivot Point - 7/20/2022 |
View all notes |
Set NEW NOTE alert |
Company Profile |
SEC
News |
Chart |
Request a new note
C
A
S
I |
Symbol/Exchange
Company Name
Industry Group |
PRICE |
CHANGE
(%Change) |
Day High |
Volume
(% DAV)
(% 50 day avg vol) |
52 Wk Hi
% From Hi |
Featured
Date |
Price
Featured |
Pivot Featured |
|
Max Buy |
ESQ
-
NASDAQ
Esquire Financial Hldgs
Finance-Commercial Loans
|
$36.13
|
-0.28
-0.77% |
$36.33
|
58,140
95.31% of 50 DAV
50 DAV is 61,000
|
$39.09
-7.57%
|
7/26/2022
|
$37.74
|
PP = $39.19
|
|
MB = $41.15
|
Most Recent Note - 8/2/2022 5:45:52 PM
Y - Pulled back today and undercut its 50 DMA line ($35.26) then rebounded to close in the upper third of its intra-day range for a small loss. Subsequent gains above the pivot point backed by at least +40% above average volume may trigger a technical buy signal. Its 50 DMA line defines initial support above its 200 DMA line ($33.96).
>>> FEATURED STOCK ARTICLE : Volume Driven Gains Approaching Prior High - 7/26/2022 |
View all notes |
Set NEW NOTE alert |
Company Profile |
SEC
News |
Chart |
Request a new note
C
A
S
I |
GPK
-
NYSE
Graphic Packaging Hldg
CONSUMER NON-DURABLES - Packaging and Containers
|
$22.01
|
-0.32
-1.43% |
$22.30
|
2,396,062
82.62% of 50 DAV
50 DAV is 2,900,000
|
$22.99
-4.26%
|
7/26/2022
|
$22.63
|
PP = $23.09
|
|
MB = $24.24
|
Most Recent Note - 8/1/2022 8:04:29 PM
Y - Stubbornly holding its ground perched near its 52-week high. Highlighted in yellow in the 7/26/22 mid-day report with pivot point cited based on its 6/06/22 high plus 10 cents. Subsequent gains above the pivot point backed by at least +40% above average volume are needed to trigger a proper technical buy signal.
>>> FEATURED STOCK ARTICLE : Negative Reversal After Matching 52-Week High - 7/27/2022 |
View all notes |
Set NEW NOTE alert |
Company Profile |
SEC
News |
Chart |
Request a new note
C
A
S
I |
CSL
-
NYSE
Carlisle Cos Inc
Diversified Operations
|
$290.55
|
-2.93
-1.00% |
$294.68
|
275,148
76.43% of 50 DAV
50 DAV is 360,000
|
$297.34
-2.28%
|
7/28/2022
|
$282.31
|
PP = $275.23
|
|
MB = $288.99
|
Most Recent Note - 8/2/2022 5:29:21 PM
G - Volume cooled today while perched near its all-time high following volume-driven gains. Bullish action has continued since highlighted in yellow in the 7/28/22 mid-day report with pivot point cited based on its 5/04/22 high plus 10 cents. Prior highs in the $275 area define initial support to watch on pullbacks. See the latest FSU analysis for more details and a new annotated graph.
>>> FEATURED STOCK ARTICLE : Carlisle Perched at All-Time High After Noted Breakout - 8/2/2022 |
View all notes |
Set NEW NOTE alert |
Company Profile |
SEC
News |
Chart |
Request a new note
C
A
S
I |
ENPH
-
NASDAQ
Enphase Energy Inc
Energy-Solar
|
$292.26
|
+11.37
4.05% |
$298.97
|
4,353,406
140.48% of 50 DAV
50 DAV is 3,099,000
|
$287.38
1.70%
|
7/28/2022
|
$276.66
|
PP = $282.55
|
|
MB = $296.68
|
Most Recent Note - 8/2/2022 12:27:01 PM
G - Hitting another new high, rising above its "max buy" level with today's gain and its color code is changed to green. Prior high in the $282 area defines initial support to watch on pullbacks. Fundamentals remain strong after reporting solid Jun '22 quarterly results, continuing its strong earnings history.
>>> FEATURED STOCK ARTICLE : Pullback Following 3 Consecutive Gains With Heavier Volume - 8/1/2022 |
View all notes |
Set NEW NOTE alert |
Company Profile |
SEC
News |
Chart |
Request a new note
C
A
S
I |
PWR
-
NYSE
Quanta Services Inc
MATERIALS and CONSTRUCTION - General Contractors
|
$138.31
|
-0.41
-0.30% |
$140.10
|
940,096
60.42% of 50 DAV
50 DAV is 1,556,000
|
$146.84
-5.81%
|
7/28/2022
|
$141.83
|
PP = $140.14
|
|
MB = $147.15
|
Most Recent Note - 8/2/2022 5:48:58 PM
Y - Volume totals are cooling while holding its ground following a noted "negative reversal" on 7/29/22 after touching a new high. Slumped below its pivot point raising some concerns following the recently noted breakout. Due to report Jun '22 quarterly results on 8/04/22. Volume and volatility often increase near earnings news.
>>> FEATURED STOCK ARTICLE : Volume-Driven Breakout for Quanta Services - 7/28/2022 |
View all notes |
Set NEW NOTE alert |
Company Profile |
SEC
News |
Chart |
Request a new note
C
A
S
I |
Symbol/Exchange
Company Name
Industry Group |
PRICE |
CHANGE
(%Change) |
Day High |
Volume
(% DAV)
(% 50 day avg vol) |
52 Wk Hi
% From Hi |
Featured
Date |
Price
Featured |
Pivot Featured |
|
Max Buy |
CLFD
-
NASDAQ
Clearfield Inc
TELECOMMUNICATIONS - Cables / Satalite Equipment
|
$103.60
|
+7.15
7.41% |
$105.36
|
486,213
271.63% of 50 DAV
50 DAV is 179,000
|
$99.15
4.49%
|
7/29/2022
|
$94.10
|
PP = $86.81
|
|
MB = $91.15
|
Most Recent Note - 8/2/2022 12:24:52 PM
G - Powering further into new high territory today with another gain backed by above average volume, rallying well above its "max buy" level. Prior high in the $86 area defines initial support to watch on pullbacks. Fundamentals remain strong after it reported Jun '22 quarterly earnings +109% on +84% sales revenues above the year ago period.
>>> FEATURED STOCK ARTICLE : Volume Heavy Behind Technical Breakout - 7/29/2022 |
View all notes |
Set NEW NOTE alert |
Company Profile |
SEC
News |
Chart |
Request a new note
C
A
S
I |
|
|
|
THESE ARE NOT BUY RECOMMENDATIONS!
Comments contained in the body of this report are technical
opinions only. The material herein has been obtained
from sources believed to be reliable and accurate, however,
its accuracy and completeness cannot be guaranteed.
This site is not an investment advisor, hence it does
not endorse or recommend any securities or other investments.
Any recommendation contained in this report may not
be suitable for all investors and it is not to be deemed
an offer or solicitation on our part with respect to
the purchase or sale of any securities. All trademarks,
service marks and trade names appearing in this report
are the property of their respective owners, and are
likewise used for identification purposes only.
This report is a service available
only to active Paid Premium Members.
You may opt-out of receiving report notifications
at any time. Questions or comments may be submitted
by writing to Premium Membership Services 665 S.E. 10 Street, Suite 201 Deerfield Beach, FL 33441-5634 or by calling 1-800-965-8307
or 954-785-1121.
|
|
|