You are not logged in.
This means you
CAN ONLY VIEW reports that were published prior to Saturday, February 24, 2024.
You
MUST UPGRADE YOUR MEMBERSHIP if you want to see any current reports.
AFTER MARKET UPDATE - FRIDAY, AUGUST 2ND, 2019
Previous After Market Report Next After Market Report >>>
|
|
|
|
DOW |
-98.41 |
26,485.01 |
-0.37% |
|
Volume |
883,815,740 |
-16% |
|
Volume |
2,226,137,730 |
-20% |
|
NASDAQ |
-107.05 |
8,004.07 |
-1.32% |
|
Advancers |
1,160 |
40% |
|
Advancers |
1,021 |
33% |
|
S&P 500 |
-21.51 |
2,932.05 |
-0.73% |
|
Decliners |
1,728 |
60% |
|
Decliners |
2,070 |
67% |
|
Russell 2000 |
-17.11 |
1,533.66 |
-1.10% |
|
52 Wk Highs |
152 |
|
|
52 Wk Highs |
51 |
|
|
S&P 600 |
-10.10 |
938.14 |
-1.07% |
|
52 Wk Lows |
165 |
|
|
52 Wk Lows |
189 |
|
|
 |
Major Indices Fell and Finished Worst Week of 2019
Kenneth J. Gruneisen - Passed the CAN SLIM® Master's Exam
The Dow slipped 98 points, posting a 2.6% loss for the week. The S&P 500 fell for a fifth straight day, shedding 0.7% and bringing its weekly decline to 3.1%. The Nasdaq Composite dipped 1.3%, slumping 3.9% on the week. Volume totals reported Friday were lighter than the prior session totals on the NYSE and on the Nasdaq exchange, indicating less serious selling pressure from the institutional crowd. Decliners led advancers by a 3-2 margin on the NYSE and 2-1 on the Nasdaq exchange. Leadership thinned as there were only 17 high-ranked companies from the Leaders List hit new 52-week highs and were listed on the BreakOuts Page, versus the total of 50 on the prior session. New 52-week lows totals swelled and outnumbered new 52-week highs on the NYSE and on the Nasdaq exchange. The major indices (M criteria) have seen their uptrend come under pressure, raising concerns. Healthy leadership (many stocks hitting new highs) will be critical in the days ahead to avoid a more serious market correction. The Featured Stocks Page provides the most timely analysis on high-ranked leaders.Charts used courtesy of www.stockcharts.com
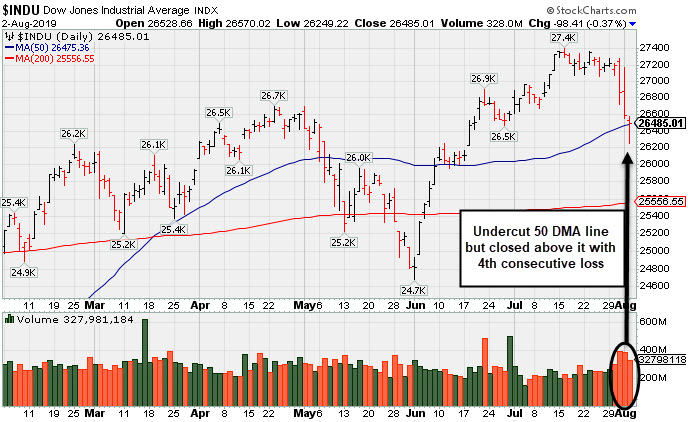
PICTURED: The Dow Jones Industrial Average suffered a 4th consecutive loss and undercut its 50-day moving average (DMA) line yet recovered to close above it.
Stocks declined Friday, capping their worst week of 2019, as investors weighed renewed trade tensions. A perceived “risk-off” tone took hold of equity markets after President Trump announced on Thursday that the U.S. would impose a new 10% tariff on $300 billion of Chinese goods.
Treasuries rallied across the curve, sending yields lower. The 10-year note yield fell four basis points to 1.85%, which followed Thursday’s 12 basis point decline. Market participants also assessed the most recent jobs report. Nonfarm payrolls increased by 164,000 in July, in-line with expectations. However, the prior two month’s readings were downwardly revised. Separate updates revealed factory and durable goods orders both grew at a slower rate in July than the previous month. A different survey showed the U.S. trade deficit widened more than expected in June.
Eight of 11 S&P 500 sectors finished lower, with just the defensive groups closing in positive territory. Technology shares paced the declines, with the oft-cited FAANG group falling 1.6%. Energy stocks also lagged with Exxon Mobil (XOM -0.98%) down despite the oil giant topping analyst profit estimates.
In commodities, WTI crude rebounded 3.2% to $55.66/barrel from Thursday’s largest one day decline in four years, but shed 1.6% for the week. COMEX gold added 1.4% to $1,440.80/ounce amid a rally in perceived “safe-haven” assets.
|
 Kenneth J. Gruneisen started out as a licensed stockbroker in August 1987, a couple of months prior to the historic stock market crash that took the Dow Jones Industrial Average down -22.6% in a single day. He has published daily fact-based fundamental and technical analysis on high-ranked stocks online for two decades. Through FACTBASEDINVESTING.COM, Kenneth provides educational articles, news, market commentary, and other information regarding proven investment systems that work in good times and bad.
Comments contained in the body of this report are technical opinions only and are not necessarily those of Gruneisen Growth Corp. The material herein has been obtained from sources believed to be reliable and accurate, however, its accuracy and completeness cannot be guaranteed. Our firm, employees, and customers may effect transactions, including transactions contrary to any recommendation herein, or have positions in the securities mentioned herein or options with respect thereto. Any recommendation contained in this report may not be suitable for all investors and it is not to be deemed an offer or solicitation on our part with respect to the purchase or sale of any securities. |
|
 |
Financial, Retail, Tech, and Commodity-Linked Groups Fell
Kenneth J. Gruneisen - Passed the CAN SLIM® Master's Exam
The Broker/Dealer Index ($XBD -1.13%), Bank Index ($BKX -0.33%), and the Retail Index ($RLX -1.19%) suffered unanimous losses that weighed on the major indices. The Semiconductor Index ($SOX -1.56%), Networking Index ($NWX -2.49%) and Biotech Index ($BTK -1.55%) each lost ground. Commodity-linked groups also saw pressure as the Gold & Silver Index ($XAU -1.09%), Oil Services Index ($OSX -3.17%), and the Integrated Oil Index ($XOI -1.36%) finished lower.
Charts courtesy of www.stockcharts.com
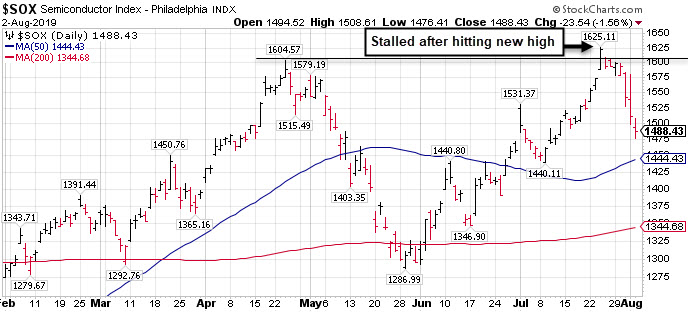
PICTURED: The Semiconductor Index ($SOX -1.56%) stalled after hitting a new high in July.
| Oil Services |
$OSX |
72.69 |
-2.38 |
-3.17% |
-9.81% |
| Integrated Oil |
$XOI |
1,218.04 |
-16.79 |
-1.36% |
+5.08% |
| Semiconductor |
$SOX |
1,488.43 |
-23.55 |
-1.56% |
+28.85% |
| Networking |
$NWX |
575.11 |
-14.67 |
-2.49% |
+17.69% |
| Broker/Dealer |
$XBD |
264.47 |
-3.02 |
-1.13% |
+11.43% |
| Retail |
$RLX |
2,309.62 |
-27.72 |
-1.19% |
+18.36% |
| Gold & Silver |
$XAU |
90.82 |
-1.00 |
-1.09% |
+28.53% |
| Bank |
$BKX |
97.99 |
-0.32 |
-0.33% |
+14.22% |
| Biotech |
$BTK |
4,614.07 |
-72.52 |
-1.55% |
+9.32% |
|
|
|
 |
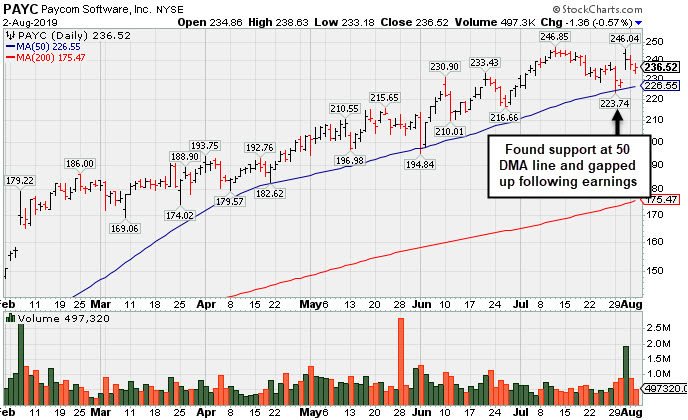
Found Support and Gapped Up Following Earnings Report
Kenneth J. Gruneisen - Passed the CAN SLIM® Master's Exam
Paycom Software Inc (PAYC -$1.36 or -0.57% to $236.52) reported earnings +27% on +31% sales revenues for the Jun '19 quarter, continuing its strong earnings track record. It gapped up on 7/31/19 challenging its all-time high, however it is extended from any sound base. It found support at its 50-day moving average (DMA) line during consolidations throughout this year's ongoing ascent.
The Computer Software - Enterprise firm was last shown in this FSU section on 6/28/19 under the headline, Perched Near High Extended From Any Sound Base". It was highlighted in yellow with new pivot point cited based on its 9/14/18 high plus 10 cents in the 2/06/19 mid-day report (read here). A "breakaway gap" cleared all overhead supply and triggered a technical buy signal.
The current Up/Down Volume Ratio of 1.0 is an unbiased indication its shares have been neutral concerning accumulation/distribution over the past 50 days. Its small supply of only 58.5 million shares outstanding (S criteria) can contribute to greater price volatility in the event of institutional buying or selling. The number of top-rated funds owning its shares rose from 384 in Jun '17 to 673 in Jun '19, a reassuring sign concerning the I criteria. It has a Timeliness rating of B and Sponsorship rating of B. It completed Secondary Offerings on 11/13/15, 9/16/15, 5/15/15 and 1/14/15 since its $15 IPO on 4/15/14.
|
|
|
Color Codes Explained :
Y - Better candidates highlighted by our
staff of experts.
G - Previously featured
in past reports as yellow but may no longer be buyable under the
guidelines.
***Last / Change / Volume data in this table is the closing quote data***
Symbol/Exchange
Company Name
Industry Group |
PRICE |
CHANGE
(%Change) |
Day High |
Volume
(% DAV)
(% 50 day avg vol) |
52 Wk Hi
% From Hi |
Featured
Date |
Price
Featured |
Pivot Featured |
|
Max Buy |
 SPSC
-
NASDAQ
SPSC
-
NASDAQ
S P S Commerce Inc
COMPUTER SOFTWARE and SERVICES - Application Software
|
$110.30
|
-0.95
-0.85% |
$113.41
|
116,501
85.66% of 50 DAV
50 DAV is 136,000
|
$118.28
-6.75%
|
6/7/2019
|
$107.72
|
PP = $115.10
|
|
MB = $120.86
|
Most Recent Note - 8/1/2019 5:47:23 PM
Y - Holding its ground with volume totals cooling since a gap up and big volume-driven gain noted on 7/26/19. Subsequent gains and a strong close above the pivot point may clinch a convincing new (or add-on) technical buy signal. Reported earnings +22% on +12% sales revenues for the Jun '19 quarter, slightly under the +25% minimum earnings guideline (C criteria), raising fundamental concerns.
>>> FEATURED STOCK ARTICLE : Recently Sputtering Below 50-Day Moving Average - 7/9/2019 |
View all notes |
Set NEW NOTE alert |
Company Profile |
SEC
News |
Chart |
Request a new note
C
A
S
I |
EPAM
-
NYSE
Epam Systems Inc
COMPUTER SOFTWARE and SERVICES - Information Technology Service
|
$187.83
|
-5.91
-3.05% |
$191.71
|
492,618
101.36% of 50 DAV
50 DAV is 486,000
|
$201.00
-6.55%
|
5/9/2019
|
$169.25
|
PP = $180.55
|
|
MB = $189.58
|
 Most Recent Note - 8/2/2019 1:33:10 PM
Y - Pulling back from its 52-week high with today's 5th consecutive loss. Color code is changed to yellow after retreating below its "max buy" level. Due to report earnings news before the open on Thursday, August 8, 2019. Its 50 DMA line ($181) and prior highs in the $179-180 area define important support.
>>> FEATURED STOCK ARTICLE : Winning Streak Leaves IT Firm Extended From Prior Base - 7/12/2019 |
View all notes |
Set NEW NOTE alert |
Company Profile |
SEC
News |
Chart |
Request a new note
C
A
S
I |
AUDC
-
NASDAQ
Audiocodes Ltd
ELECTRONICS - Scientific and Technical Instrum
|
$18.69
|
-0.04
-0.21% |
$19.02
|
150,124
85.79% of 50 DAV
50 DAV is 175,000
|
$19.74
-5.32%
|
7/15/2019
|
$17.10
|
PP = $17.54
|
|
MB = $18.42
|
Most Recent Note - 7/31/2019 6:15:28 PM
G - Retreated from its all-time high with higher volume behind today's loss. Bullish action came after it recently reported earnings +57% on +14% sales revenues for the Jun '19 quarter, continuing its strong earnings track record. Big gain 7/23/19 and strong close above the pivot point was backed by 11 times average volume triggered a technical buy signal. Prior highs in the $17 area define initial support above its 50 DMA line ($16).
>>> FEATURED STOCK ARTICLE : Posted a Gain With Average Volume for Best Ever Close - 7/15/2019 |
View all notes |
Set NEW NOTE alert |
Company Profile |
SEC
News |
Chart |
Request a new note
C
A
S
I |
ENV
-
NYSE
Envestnet Inc
FINANCIAL SERVICES - Diversified Investments
|
$68.11
|
-1.97
-2.81% |
$69.82
|
191,209
72.70% of 50 DAV
50 DAV is 263,000
|
$73.94
-7.88%
|
3/15/2019
|
$66.05
|
PP = $64.90
|
|
MB = $68.15
|
Most Recent Note - 8/2/2019 5:01:19 PM
G - Violated its 50 DMA ($69.72) line with today's 5th consecutive loss raising concerns. Prior lows in the $65-66 area define the next important support level. Due to report second quarter financial results on Wednesday, August 7, 2019 after the close. Fundamental concerns were raised after it reported earnings +5% on +1% sales revenues for the Mar '19 quarter, below the +25% minimum earnings guideline (C criteria).
>>> FEATURED STOCK ARTICLE : Rebounded Above 50-Day Moving Average Line - 7/2/2019 |
View all notes |
Set NEW NOTE alert |
Company Profile |
SEC
News |
Chart |
Request a new note
C
A
S
I |
LHCG
-
NASDAQ
L H C Group Inc
HEALTH SERVICES - Home Health Care
|
$123.62
|
+0.11
0.09% |
$124.02
|
292,336
135.34% of 50 DAV
50 DAV is 216,000
|
$129.37
-4.44%
|
7/1/2019
|
$110.94
|
PP = $122.20
|
|
MB = $128.31
|
Most Recent Note - 8/1/2019 5:53:08 PM
Y - Pulled back today with higher volume after quietly touching a new all-time high on the prior session. Recent gains above its pivot point were not backed by the +40% above average volume needed to trigger a proper new (or add-on) technical buy signal. Its 50 DMA line ($118.98) defines near-term support above recent lows. Due to report earnings news on 8/07/19.
>>> FEATURED STOCK ARTICLE : Consolidating Following a Negative Reversal at High - 7/22/2019 |
View all notes |
Set NEW NOTE alert |
Company Profile |
SEC
News |
Chart |
Request a new note
C
A
S
I |
Symbol/Exchange
Company Name
Industry Group |
PRICE |
CHANGE
(%Change) |
Day High |
Volume
(% DAV)
(% 50 day avg vol) |
52 Wk Hi
% From Hi |
Featured
Date |
Price
Featured |
Pivot Featured |
|
Max Buy |
ENSG
-
NASDAQ
Ensign Group Inc
HEALTH SERVICES - Long-Term Care Facilities
|
$54.06
|
-4.21
-7.22% |
$58.26
|
394,959
152.49% of 50 DAV
50 DAV is 259,000
|
$63.00
-14.19%
|
4/30/2019
|
$51.46
|
PP = $53.30
|
|
MB = $55.97
|
Most Recent Note - 8/2/2019 4:58:08 PM
Finished near the session low with a volume-driven loss after violating its 50 DMA line ($56.65) today raising concerns and triggering a technical sell signal. A prompt rebound above the 50 DMA line is needed for its outlook to improve. Reported earnings +23% on +16% sales revenues for the Jun '19 quarter versus the year ago period, its 2nd consecutive quarterly comparison below the +25% minimum earnings guideline (C criteria). Recent low ($52.34 on 5/31/19) defines the next important near-term support to watch. It will be dropped from the Featured Stocks list tonight.
>>> FEATURED STOCK ARTICLE : Nursing Facility Operator Touched New High - 7/1/2019 |
View all notes |
Set NEW NOTE alert |
Company Profile |
SEC
News |
Chart |
Request a new note
C
A
S
I |
CHDN
-
NASDAQ
Churchill Downs Inc
LEISURE - Gaming Activities
|
$120.35
|
-5.88
-4.66% |
$126.06
|
348,815
129.19% of 50 DAV
50 DAV is 270,000
|
$132.73
-9.33%
|
7/22/2019
|
$118.45
|
PP = $118.89
|
|
MB = $124.83
|
Most Recent Note - 8/2/2019 1:19:22 PM
Y - Retreating from its all-time high hit on the prior session and its color code is changed to yellow after slumping back below its "max buy" level. Reported Jun '19 earnings rose +10% on +26% sales revenues versus the year ago period. Volume and volatility often increase near earnings news. Its 50 DMA line ($113.19) and prior low ($108.57 on 6/25/19) define important near-term support to watch on pullbacks
>>> FEATURED STOCK ARTICLE : Volume Light While Hovering at Record High - 7/16/2019 |
View all notes |
Set NEW NOTE alert |
Company Profile |
SEC
News |
Chart |
Request a new note
C
A
S
I |
WWD
-
NASDAQ
Woodward Inc
MANUFACTURING - Diversified Machinery
|
$109.84
|
-2.02
-1.81% |
$111.33
|
596,152
116.89% of 50 DAV
50 DAV is 510,000
|
$119.20
-7.85%
|
6/18/2019
|
$112.34
|
PP = $114.65
|
|
MB = $120.38
|
Most Recent Note - 8/2/2019 1:28:39 PM
G - Slumping further below its 50 DMA line ($113.38) and raising concerns with below average volume behind today's 7th loss in the span of 8 sessions. A rebound above the 50 DMA line is needed for its outlook to improve. Subsequent gains for new highs backed by at least +40% above average volume may clinch a convincing technical buy signal. Due to report financial results after the close on Monday, August 5, 2019. Volume and volatility often increase near earnings news.
>>> FEATURED STOCK ARTICLE : Perched Near All-Time High After Gains Lacking Great Volume - 7/24/2019 |
View all notes |
Set NEW NOTE alert |
Company Profile |
SEC
News |
Chart |
Request a new note
C
A
S
I |
LULU
-
NASDAQ
Lululemon Athletica
MANUFACTURING - Textile Manufacturing
|
$178.93
|
-6.52
-3.52% |
$184.89
|
1,899,592
89.60% of 50 DAV
50 DAV is 2,120,000
|
$194.25
-7.89%
|
6/13/2019
|
$174.48
|
PP = $179.60
|
|
MB = $188.58
|
Most Recent Note - 8/2/2019 1:25:48 PM
G - Pulling back from its all-time high with today's 4th consecutive loss with below average volume, undercutting its 50 DMA line ($180.82) and raising concerns. Reported Apr '19 quarterly earnings +35% on +20% sales revenues versus the year ago period.
>>> FEATURED STOCK ARTICLE : Quietly Hovering at All-Time High - 7/17/2019 |
View all notes |
Set NEW NOTE alert |
Company Profile |
SEC
News |
Chart |
Request a new note
C
A
S
I |
ULTA
-
NASDAQ
Ulta Beauty Inc
SPECIALTY RETAIL - Specialty Retail, Other
|
$337.02
|
-8.49
-2.46% |
$348.57
|
782,481
104.47% of 50 DAV
50 DAV is 749,000
|
$368.83
-8.62%
|
3/15/2019
|
$341.27
|
PP = $322.59
|
|
MB = $338.72
|
Most Recent Note - 8/1/2019 5:51:09 PM
G - Sputtering near its 50 DMA line ($346.67). Volume totals have been mostly light while still hovering near its all-time high. Reported earnings +17% on +13% sales revenues for the Apr '19 quarter, below the +25% minimum earnings guideline (C criteria), raising fundamental concerns.
>>> FEATURED STOCK ARTICLE : Stalled After Recently Wedging to New Record High - 7/5/2019 |
View all notes |
Set NEW NOTE alert |
Company Profile |
SEC
News |
Chart |
Request a new note
C
A
S
I |
Symbol/Exchange
Company Name
Industry Group |
PRICE |
CHANGE
(%Change) |
Day High |
Volume
(% DAV)
(% 50 day avg vol) |
52 Wk Hi
% From Hi |
Featured
Date |
Price
Featured |
Pivot Featured |
|
Max Buy |
CHGG
-
NYSE
Chegg Inc
Consumer Svcs-Education
|
$44.76
|
-0.27
-0.60% |
$45.22
|
1,004,904
66.46% of 50 DAV
50 DAV is 1,512,000
|
$48.22
-7.18%
|
7/8/2019
|
$44.11
|
PP = $41.79
|
|
MB = $43.88
|
Most Recent Note - 7/30/2019 4:02:17 PM
G - Gapped up today and rallied for a new high with heavy volume and its color code was changed to green after getting extended from the prior base. Prior highs in the $40-41 area define important support to watch above its 50 DMA line. Reported earnings +92% on +26% sales revenues for the Jun '19 quarter.
>>> FEATURED STOCK ARTICLE : Tallied a Big Volume-Driven Breakout Gain for a New High - 7/8/2019 |
View all notes |
Set NEW NOTE alert |
Company Profile |
SEC
News |
Chart |
Request a new note
C
A
S
I |
NOW
-
NYSE
Servicenow Inc
Computer Sftwr-Enterprse
|
$265.86
|
-8.14
-2.97% |
$273.11
|
2,391,345
149.27% of 50 DAV
50 DAV is 1,602,000
|
$303.17
-12.31%
|
4/22/2019
|
$242.64
|
PP = $251.75
|
|
MB = $264.34
|
Most Recent Note - 8/2/2019 4:55:21 PM
Sank further below its 50 DMA line ($281) with today's 5th consecutive volume-driven loss. A rebound above the 50 DMA line is needed for its outlook to improve. It will be dropped from the featured Stocks list tonight. Action has been weak since reporting earnings +45% on +32% sales revenues for the Jun '19 quarter, above the +25% minimum earnings guideline (C criteria).
>>> FEATURED STOCK ARTICLE : Slumped Below 50-Day Average With Loss on Higher Volume - 7/31/2019 |
View all notes |
Set NEW NOTE alert |
Company Profile |
SEC
News |
Chart |
Request a new note
C
A
S
I |
VEEV
-
NYSE
Veeva Systems Inc Cl A
Computer Sftwr-Medical
|
$162.81
|
-2.43
-1.47% |
$164.70
|
861,869
52.08% of 50 DAV
50 DAV is 1,655,000
|
$176.90
-7.96%
|
5/30/2019
|
$154.32
|
PP = $145.80
|
|
MB = $153.09
|
Most Recent Note - 8/1/2019 5:37:47 PM
G - Quietly consolidating after testing its 50 DMA line ($162.91) with volume-driven losses. That important short-term average defines near-term support above the prior low ($155 on 6/27/19). Fundamentals remain strong. See the latest FSU analysis for more details and a new annotated graph.
>>> FEATURED STOCK ARTICLE : Recently Found Support Near 50-Day Moving Average - 8/1/2019 |
View all notes |
Set NEW NOTE alert |
Company Profile |
SEC
News |
Chart |
Request a new note
C
A
S
I |
PAYC
-
NYSE
Paycom Software Inc
COMPUTER SOFTWARE and SERVICES - Application Software
|
$236.52
|
-1.36
-0.57% |
$238.63
|
494,210
68.64% of 50 DAV
50 DAV is 720,000
|
$246.85
-4.18%
|
2/6/2019
|
$171.66
|
PP = $164.18
|
|
MB = $172.39
|
Most Recent Note - 8/2/2019 4:50:48 PM
G - Reported earnings +27% on +31% sales revenues for the Jun '19 quarter, continuing its strong earnings track record. Perched near its all-time high, extended from any sound base. Found support at its 50 DMA line during consolidations throughout this year's ongoing ascent. See the latest FSU analysis for more details and a new annotated graph.
>>> FEATURED STOCK ARTICLE : Found Support and Gapped Up Following Earnings Report - 8/2/2019 |
View all notes |
Set NEW NOTE alert |
Company Profile |
SEC
News |
Chart |
Request a new note
C
A
S
I |
PYPL
-
NASDAQ
Paypal Holdings Inc
Finance-CrdtCard/PmtPr
|
$107.09
|
-3.71
-3.35% |
$109.65
|
10,340,903
167.65% of 50 DAV
50 DAV is 6,168,000
|
$121.48
-11.85%
|
1/24/2019
|
$92.56
|
PP = $93.80
|
|
MB = $98.49
|
Most Recent Note - 8/2/2019 1:04:46 PM
G - Slumping further below its 50 DMA line ($115) and the prior low with above average volume behind damaging losses raising concerns. A prompt rebound above the 50 DMA line is needed for its outlook to improve. Reported Jun '19 quarterly earnings +48% on +12% sales revenues versus the year ago period.
>>> FEATURED STOCK ARTICLE : Perched Near Record High Ahead of Earnings News - 7/23/2019 |
View all notes |
Set NEW NOTE alert |
Company Profile |
SEC
News |
Chart |
Request a new note
C
A
S
I |
Symbol/Exchange
Company Name
Industry Group |
PRICE |
CHANGE
(%Change) |
Day High |
Volume
(% DAV)
(% 50 day avg vol) |
52 Wk Hi
% From Hi |
Featured
Date |
Price
Featured |
Pivot Featured |
|
Max Buy |
PLNT
-
NYSE
Planet Fitness Inc Cl A
Leisure-Services
|
$76.60
|
-1.43
-1.83% |
$77.85
|
908,565
61.72% of 50 DAV
50 DAV is 1,472,000
|
$81.90
-6.47%
|
7/26/2019
|
$79.15
|
PP = $82.00
|
|
MB = $86.10
|
Most Recent Note - 8/1/2019 5:49:23 PM
Y - Volume totals have been cooling while still consolidating above its 50 DMA line ($76.69). Volume-driven gains above the pivot point are needed to trigger a new (or add-on) technical buy signal. Due to report earnings news on 8/06/19.
>>> FEATURED STOCK ARTICLE : Fitness Firm Forming a New Base - 7/26/2019 |
View all notes |
Set NEW NOTE alert |
Company Profile |
SEC
News |
Chart |
Request a new note
C
A
S
I |
BLD
-
NYSE
Topbuild Corp
Bldg-Constr Prds/Misc
|
$89.48
|
+3.70
4.31% |
$89.96
|
586,617
182.75% of 50 DAV
50 DAV is 321,000
|
$89.87
-0.43%
|
5/17/2019
|
$82.19
|
PP = $87.31
|
|
MB = $91.68
|
Most Recent Note - 8/2/2019 1:17:37 PM
Y - Trading up today near all-time high following a considerable volume-driven gain on the prior session. Bullish action came after it reported earnings +39% on +9% sales revenues for the Jun '19 quarter versus the year ago period, continuing its strong earnings track record. Members were reminded - "Volume and volatility often increase near earnings news. A gain and strong close above the pivot point backed by at least +40% above average volume may clinch a convincing technical buy signal. Its 50 DMA line and recent lows define near-term support to watch on pullbacks."
>>> FEATURED STOCK ARTICLE : Perched Near 52-Week High Finding Support - 7/25/2019 |
View all notes |
Set NEW NOTE alert |
Company Profile |
SEC
News |
Chart |
Request a new note
C
A
S
I |
TEAM
-
NASDAQ
Atlassian Corp Plc Cl A
Comp Sftwr-Spec Enterprs
|
$141.20
|
-2.72
-1.89% |
$143.07
|
1,447,776
109.93% of 50 DAV
50 DAV is 1,317,000
|
$149.80
-5.74%
|
5/24/2019
|
$129.52
|
PP = $132.09
|
|
MB = $138.69
|
Most Recent Note - 8/1/2019 5:44:40 PM
G - Posted another gain with above average volume today. Color code was changed to green after rising back above its "max buy" level. The 50 DMA line ($132.65) and prior low ($123.43 on 6/25/19) define important near-term support to watch where violations would raise concerns and trigger technical sell signals. Reported earnings +43% on +36% sales revenues for the Jun '19 quarter, continuing its strong earnings track record.
>>> FEATURED STOCK ARTICLE : Abrupt Retreat After Getting Very Extended From Prior Base - 7/29/2019 |
View all notes |
Set NEW NOTE alert |
Company Profile |
SEC
News |
Chart |
Request a new note
C
A
S
I |
GLOB
-
NYSE
Globant SA
Computer-Tech Services
|
$108.17
|
-2.03
-1.84% |
$110.02
|
234,761
55.24% of 50 DAV
50 DAV is 425,000
|
$112.33
-3.70%
|
2/15/2019
|
$69.35
|
PP = $70.00
|
|
MB = $73.50
|
Most Recent Note - 8/2/2019 1:24:23 PM
G - Pulling back from its all-time high hit on the prior session. Very extended from any sound base. Its 50 DMA line ($101.20) defines important support to watch. Fundamentals remain strong.
>>> FEATURED STOCK ARTICLE : Extended From Any Sound Base After Wedging Higher - 7/11/2019 |
View all notes |
Set NEW NOTE alert |
Company Profile |
SEC
News |
Chart |
Request a new note
C
A
S
I |
TTD
-
NASDAQ
The Trade Desk Inc Cl A
Comml Svcs-Advertising
|
$260.98
|
-3.66
-1.38% |
$267.98
|
1,184,262
82.64% of 50 DAV
50 DAV is 1,433,000
|
$279.71
-6.70%
|
7/18/2019
|
$240.61
|
PP = $258.10
|
|
MB = $271.01
|
Most Recent Note - 8/2/2019 1:30:33 PM
Y - Consolidating above the prior high ($258) which defines initial support to watch above its 50 DMA line ($232.85). Due to report earnings news on 8/08/19.
>>> FEATURED STOCK ARTICLE : Endured Distributional Pressure While Building on New Base - 7/18/2019 |
View all notes |
Set NEW NOTE alert |
Company Profile |
SEC
News |
Chart |
Request a new note
C
A
S
I |
Symbol/Exchange
Company Name
Industry Group |
PRICE |
CHANGE
(%Change) |
Day High |
Volume
(% DAV)
(% 50 day avg vol) |
52 Wk Hi
% From Hi |
Featured
Date |
Price
Featured |
Pivot Featured |
|
Max Buy |
PAGS
-
NYSE
Pagseguro Digital Cl A
Finance-CrdtCard/PmtPr
|
$45.64
|
+0.54
1.20% |
$46.05
|
1,702,769
75.18% of 50 DAV
50 DAV is 2,265,000
|
$48.88
-6.63%
|
6/25/2019
|
$37.69
|
PP = $40.07
|
|
MB = $42.07
|
Most Recent Note - 8/1/2019 5:43:14 PM
G - Posted a solid gain today halting its slide after 3 consecutive losses while retreating from its all-time high. It is extended from any sound base. Prior high in the $40 area defines initial support to watch above its 50 DMA line ($39.17.
>>> FEATURED STOCK ARTICLE : Encountering Distributional Pressure After Impressive Sprint - 7/30/2019 |
View all notes |
Set NEW NOTE alert |
Company Profile |
SEC
News |
Chart |
Request a new note
C
A
S
I |
|
|
|
THESE ARE NOT BUY RECOMMENDATIONS!
Comments contained in the body of this report are technical
opinions only. The material herein has been obtained
from sources believed to be reliable and accurate, however,
its accuracy and completeness cannot be guaranteed.
This site is not an investment advisor, hence it does
not endorse or recommend any securities or other investments.
Any recommendation contained in this report may not
be suitable for all investors and it is not to be deemed
an offer or solicitation on our part with respect to
the purchase or sale of any securities. All trademarks,
service marks and trade names appearing in this report
are the property of their respective owners, and are
likewise used for identification purposes only.
This report is a service available
only to active Paid Premium Members.
You may opt-out of receiving report notifications
at any time. Questions or comments may be submitted
by writing to Premium Membership Services 665 S.E. 10 Street, Suite 201 Deerfield Beach, FL 33441-5634 or by calling 1-800-965-8307
or 954-785-1121.
|
|
|