You are not logged in.
This means you
CAN ONLY VIEW reports that were published prior to Friday, February 23, 2024.
You
MUST UPGRADE YOUR MEMBERSHIP if you want to see any current reports.
AFTER MARKET UPDATE - MONDAY, AUGUST 1ST, 2022
Previous After Market Report Next After Market Report >>>
|
|
|
|
DOW |
-46.73 |
32,798.40 |
-0.14% |
|
Volume |
870,114,776 |
-31% |
|
Volume |
4,391,220,800 |
-10% |
|
NASDAQ |
-21.71 |
12,368.98 |
-0.18% |
|
Advancers |
1,693 |
54% |
|
Advancers |
2,125 |
48% |
|
S&P 500 |
-11.66 |
4,118.63 |
-0.28% |
|
Decliners |
1,468 |
46% |
|
Decliners |
2,308 |
52% |
|
Russell 2000 |
-1.92 |
1,883.31 |
-0.10% |
|
52 Wk Highs |
41 |
|
|
52 Wk Highs |
81 |
|
|
S&P 600 |
+2.61 |
1,242.57 |
+0.21% |
|
52 Wk Lows |
48 |
|
|
52 Wk Lows |
118 |
|
|
 |
Major Indices Pulled Back With Lighter Volume Totals
Kenneth J. Gruneisen - Passed the CAN SLIM® Master's Exam
The S&P 500 shed 0.3%, while the Dow lost 46 points, with both benchmarks coming off their best month since November 2020 (+9.1% and 6.7%, respectively). Meanwhile, the Nasdaq Composite dipped 0.2% following its strongest monthly performance since April 2020 (+12.4%). The volume totals reported were lighter than the prior session on the NYSE and on the Nasdaq exchange. Breadth was fairly even as advancers led decliners by a narrow margin on the NYSE but decliners led advancers by a narrow margin on the Nasdaq exchange. There were 27 high-ranked companies from the Leaders List that hit new 52-week highs and were listed on the BreakOuts Page, down from the total of 37 on the prior session. New 52-week lows totals still outnumbered new 52-week highs on the NYSE and on the Nasdaq exchange. The market is in a confirmed uptrend (M criteria). Any sustainable rally requires a healthy crop of leading stocks hitting new highs, so the recent improvement in leadership is a reassuring sign.
Chart courtesy of www.stockcharts.com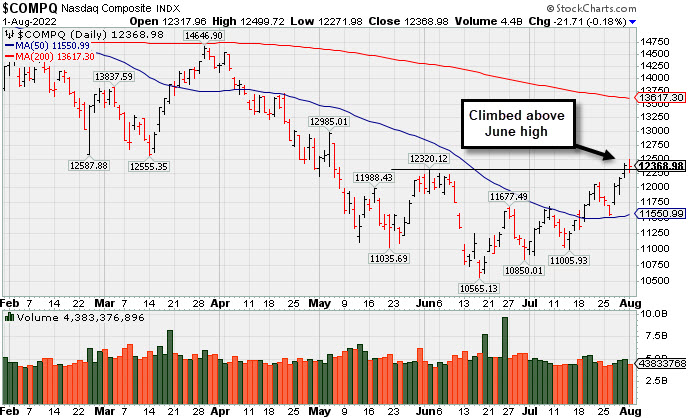 PICTURED: The Nasdaq Composite Index pulled back with lighter volume after recently climbing above the June high. It found support at its 50-day moving average (DMA) line on the last pullback and remains well below its 200 DMA line.
US stocks finished slightly lower on Monday, with the recent rally in equities taking a breather. Investors weighed recessionary risks amid weakening global economic data. Boeing Co. (BA +6.13%) was a standout gainer, rallying after U.S. regulators approved plans paving the way for the jet maker to resume deliveries of its 787 Dreamliners. Corporate earnings from big tech lifted the mood in July, while optimism over a potential Federal Reserve (Fed) policy pivot also bolstered risk appetite. However, weekend commentary from Fed officials highlighted the need to continue hiking interest rates to cool inflation.
On the data front, an update on U.S. manufacturing activity from the Institute for Supply Management (ISM) showed growth in the sector slowed less than anticipated in July, with the purchasing managers’ index (PMI) print dipping to the lowest level since June 2020. However, the prices paid component fell to a trough not seen in nearly two years. Overseas, China’s official measure of manufacturing activity posted a surprise drop into contractionary territory. In Europe, manufacturing surveys in the largest countries also reflected shrinking activity.
In commodities, West Texas Intermediate crude retreated 4.9% to $93.78/barrel, a five-month low. Longer-dated Treasuries extended their recent rally, with the yield on the 10-year note down seven basis points (0.07%) to 2.59%, the lowest level since April. The 30-year bond yield slumped 11 basis points (0.11%) to 2.92%.
|
 Kenneth J. Gruneisen started out as a licensed stockbroker in August 1987, a couple of months prior to the historic stock market crash that took the Dow Jones Industrial Average down -22.6% in a single day. He has published daily fact-based fundamental and technical analysis on high-ranked stocks online for two decades. Through FACTBASEDINVESTING.COM, Kenneth provides educational articles, news, market commentary, and other information regarding proven investment systems that work in good times and bad.
Comments contained in the body of this report are technical opinions only and are not necessarily those of Gruneisen Growth Corp. The material herein has been obtained from sources believed to be reliable and accurate, however, its accuracy and completeness cannot be guaranteed. Our firm, employees, and customers may effect transactions, including transactions contrary to any recommendation herein, or have positions in the securities mentioned herein or options with respect thereto. Any recommendation contained in this report may not be suitable for all investors and it is not to be deemed an offer or solicitation on our part with respect to the purchase or sale of any securities. |
|
 |
Retail Index and Semiconductor Index Rose
Kenneth J. Gruneisen - Passed the CAN SLIM® Master's Exam
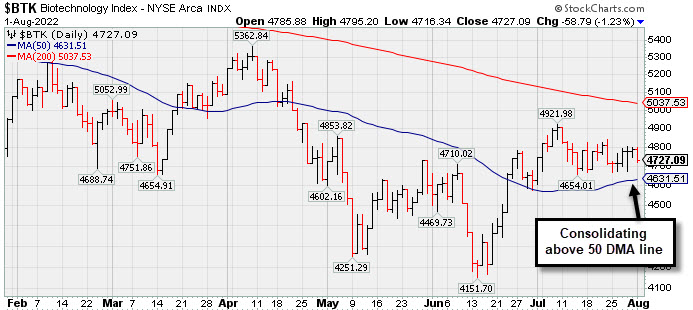
The Retail Index ($RLX +0.82%) posted a influential gain while the Broker/Dealer Index ($XBD -0.38%) and Bank Index ($BKX -0.37%) both edged lower. The Semiconductor Index ($SOX +0.38%) eked out a small gain while the Networking Index ($NWX -0.01%) finished flat, but the Biotech Index ($BTK -1.23%) created a drag on the tech sector. Commodity-linked groups had a negative bias as the Oil Services Index ($OSX -2.62%), Integrated Oil Index ($XOI -1.93%), and Gold & Silver Index ($XAU -0.70%) each lost ground. PICTURED: The Biotech Index ($BTK -1.23%) has been consolidating above its 50-day moving average (DMA) line.
| Oil Services |
$OSX |
66.36 |
-1.78 |
-2.62% |
+25.88% |
| Integrated Oil |
$XOI |
1,561.66 |
-30.76 |
-1.93% |
+32.55% |
| Semiconductor |
$SOX |
2,978.32 |
+11.18 |
+0.38% |
-24.53% |
| Networking |
$NWX |
797.59 |
-0.09 |
-0.01% |
-17.87% |
| Broker/Dealer |
$XBD |
431.63 |
-1.65 |
-0.38% |
-11.34% |
| Retail |
$RLX |
3,395.70 |
+27.55 |
+0.82% |
-19.66% |
| Gold & Silver |
$XAU |
107.98 |
-0.76 |
-0.70% |
-18.48% |
| Bank |
$BKX |
108.05 |
-0.40 |
-0.37% |
-18.28% |
| Biotech |
$BTK |
4,727.09 |
-58.79 |
-1.23% |
-14.34% |
|
|
|
 |
Pullback Following 3 Consecutive Gains With Heavier Volume
Kenneth J. Gruneisen - Passed the CAN SLIM® Master's Exam
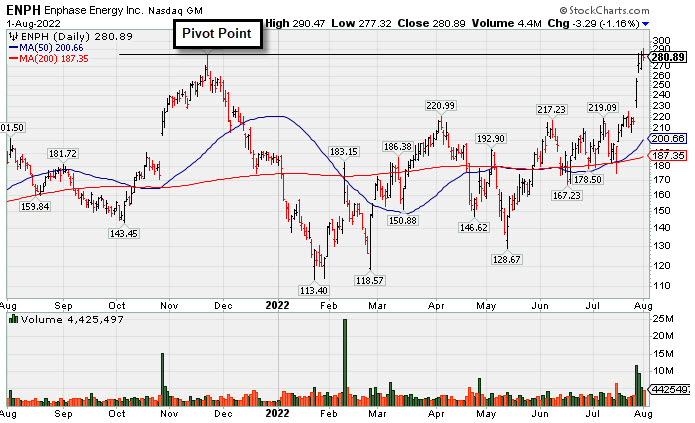
Enphase Energy Inc (ENPH -$3.29 or -1.16% to $280.89) reversed into the red and closed back below the pivot point after hitting another new high today. The pullback below the pivot point raised some concerns. It faces no resistance due to overhead supply. It was highlighted in yellow in the 7/28/22 mid-day report (read here). There were 3 consecutive volume-driven gains last week as it rallied and closed above the pivot point cited based on its 11/22/21 high plus 10 cents triggering a technical buy signal.
Fundamentals remain strong. ENPH went through a deep and choppy consolidation since last shown with an annotated graph on 12/02/21 under the headline, "Pullback Testing Near Prior High". It has an Earnings Per Share Rating of 98. The company has reported very strong sales revenues and earnings increases in quarterly comparisons through Jun '22 versus the year ago periods, above the +25% minimum guideline (C criteria). It has a strong annual earnings (A criteria) history since FY '18 after years of losses.
The company hails from the Energy-Solar group which is currently ranked 2nd of the 197 Industry Groups (L criteria). The number of top-rated funds owning its shares rose from 1,068 in Dec '20 to 1,764 in Jun '22, a reassuring sign concerning the I criteria. Its current Up/Down Volume Ratio of 1.9 is an unbiased indication its shares have been under accumulation over the past 50 days.
|
|
|
Color Codes Explained :
Y - Better candidates highlighted by our
staff of experts.
G - Previously featured
in past reports as yellow but may no longer be buyable under the
guidelines.
***Last / Change / Volume data in this table is the closing quote data***
Symbol/Exchange
Company Name
Industry Group |
PRICE |
CHANGE
(%Change) |
Day High |
Volume
(% DAV)
(% 50 day avg vol) |
52 Wk Hi
% From Hi |
Featured
Date |
Price
Featured |
Pivot Featured |
|
Max Buy |
 LLY
-
NYSE
LLY
-
NYSE
Eli Lilly & Co
Medical-Diversified
|
$324.15
|
-5.54
-1.68% |
$330.43
|
2,462,131
87.19% of 50 DAV
50 DAV is 2,824,000
|
$335.33
-3.33%
|
5/16/2022
|
$302.46
|
PP = $314.10
|
|
MB = $329.81
|
 Most Recent Note - 8/1/2022 8:08:33 PM
Y - Pulled back with light volume today and its color code is changed to yellow after pulling back below its "max buy" level. Its 50 DMA line ($315.25) defines near-term support to watch.
>>> FEATURED STOCK ARTICLE : Hovering Near "Max Buy" Level With Volume Totals Cooling - 7/22/2022 |
View all notes |
Set NEW NOTE alert |
Company Profile |
SEC
News |
Chart |
Request a new note
C
A
S
I |
IMXI
-
NASDAQ
International Money Exp
Financial Svcs-Specialty
|
$24.44
|
+0.40
1.66% |
$24.49
|
548,330
126.64% of 50 DAV
50 DAV is 433,000
|
$24.43
0.04%
|
7/1/2022
|
$21.27
|
PP = $21.38
|
|
MB = $22.45
|
Most Recent Note - 8/1/2022 8:07:09 PM
G - Posted another gain today with above average volume hitting a new 52-week high, rising further above its "max buy" level. Its 50 DMA line ($21.04) defines important near-term support to watch on pullbacks. Due to report Jun '22 quarterly results on 8/03/22. Volume and volatility often increase near earnings news.
>>> FEATURED STOCK ARTICLE : Stalled Since Clearing Double Bottom Base - 7/15/2022 |
View all notes |
Set NEW NOTE alert |
Company Profile |
SEC
News |
Chart |
Request a new note
C
A
S
I |
HRMY
-
NASDAQ
Harmony Biosciences Holdings
Medical-Biomed/Biotech
|
$49.23
|
-1.50
-2.96% |
$50.95
|
548,461
117.85% of 50 DAV
50 DAV is 465,400
|
$57.13
-13.83%
|
7/6/2022
|
$54.12
|
PP = $52.85
|
|
MB = $55.49
|
Most Recent Note - 8/1/2022 8:05:35 PM
Y - Pulled back with higher (above average) volume. The next important near-term support to watch is its 50 DMA line ($48.34). Prior losses raised concerns while slumping back into the prior base.
>>> FEATURED STOCK ARTICLE : Harmony Has Been Encountering Distributional Pressure - 7/18/2022 |
View all notes |
Set NEW NOTE alert |
Company Profile |
SEC
News |
Chart |
Request a new note
C
A
S
I |
CI
-
NYSE
Cigna Corp
Medical-Managed Care
|
$273.41
|
-1.95
-0.71% |
$276.92
|
1,434,635
73.57% of 50 DAV
50 DAV is 1,950,000
|
$282.33
-3.16%
|
7/7/2022
|
$276.55
|
PP = $273.68
|
|
MB = $287.36
|
Most Recent Note - 8/1/2022 8:10:44 PM
Y - Pulled back with lighter than average volume today. Tested support at its 50 DMA line ($264) twice following a recent technical breakout. More damaging losses would raise greater concerns.
>>> FEATURED STOCK ARTICLE : Pulled Back and Tested Support at 50-Day Moving Average - 7/19/2022 |
View all notes |
Set NEW NOTE alert |
Company Profile |
SEC
News |
Chart |
Request a new note
C
A
S
I |
AN
-
NYSE
Autonation Inc
SPECIALTY RETAIL - Auto Dealerships
|
$120.48
|
+1.74
1.47% |
$121.49
|
553,846
73.07% of 50 DAV
50 DAV is 758,000
|
$133.48
-9.74%
|
7/20/2022
|
$122.03
|
PP = $126.49
|
|
MB = $132.81
|
Most Recent Note - 8/1/2022 8:10:09 PM
Y - Posted a 4th consecutive gain today with lighter than average volume. Recent rebound above its 200 DMA line and 50 DMA line ($115.64) helped its outlook to improve. Subsequent volume-driven gains above the pivot point may trigger a technical buy signal. Reported Jun '22 quarterly earnings +34% on -2% sales revenues versus the year ago period. Faces some resistance due to overhead supply up to the $133 level.
>>> FEATURED STOCK ARTICLE : Autonation Earnings Due While Perched Near Pivot Point - 7/20/2022 |
View all notes |
Set NEW NOTE alert |
Company Profile |
SEC
News |
Chart |
Request a new note
C
A
S
I |
Symbol/Exchange
Company Name
Industry Group |
PRICE |
CHANGE
(%Change) |
Day High |
Volume
(% DAV)
(% 50 day avg vol) |
52 Wk Hi
% From Hi |
Featured
Date |
Price
Featured |
Pivot Featured |
|
Max Buy |
ESQ
-
NASDAQ
Esquire Financial Hldgs
Finance-Commercial Loans
|
$36.41
|
+0.19
0.52% |
$36.67
|
26,470
43.39% of 50 DAV
50 DAV is 61,000
|
$39.09
-6.86%
|
7/26/2022
|
$37.74
|
PP = $39.19
|
|
MB = $41.15
|
Most Recent Note - 7/29/2022 6:48:20 PM
Y - Pulled back today for a 2nd consecutive loss with lighter than average volume following a streak of 4 consecutive gains with higher volume. It was highlighted in yellow with pivot point cited based on its 4/25/22 high plus 10 cents in the 7/26/22 mid-day report. Subsequent gains above the pivot point backed by at least +40% above average volume may trigger a technical buy signal. Its 50 DMA line ($35.18) defines initial support above its 200 DMA line ($33.93).
>>> FEATURED STOCK ARTICLE : Volume Driven Gains Approaching Prior High - 7/26/2022 |
View all notes |
Set NEW NOTE alert |
Company Profile |
SEC
News |
Chart |
Request a new note
C
A
S
I |
GPK
-
NYSE
Graphic Packaging Hldg
CONSUMER NON-DURABLES - Packaging and Containers
|
$22.33
|
+0.08
0.36% |
$22.52
|
3,090,117
107.37% of 50 DAV
50 DAV is 2,878,000
|
$22.99
-2.87%
|
7/26/2022
|
$22.63
|
PP = $23.09
|
|
MB = $24.24
|
Most Recent Note - 8/1/2022 8:04:29 PM
Y - Stubbornly holding its ground perched near its 52-week high. Highlighted in yellow in the 7/26/22 mid-day report with pivot point cited based on its 6/06/22 high plus 10 cents. Subsequent gains above the pivot point backed by at least +40% above average volume are needed to trigger a proper technical buy signal.
>>> FEATURED STOCK ARTICLE : Negative Reversal After Matching 52-Week High - 7/27/2022 |
View all notes |
Set NEW NOTE alert |
Company Profile |
SEC
News |
Chart |
Request a new note
C
A
S
I |
CSL
-
NYSE
Carlisle Cos Inc
Diversified Operations
|
$293.48
|
-2.62
-0.88% |
$295.89
|
619,584
176.02% of 50 DAV
50 DAV is 352,000
|
$297.34
-1.30%
|
7/28/2022
|
$282.31
|
PP = $275.23
|
|
MB = $288.99
|
Most Recent Note - 8/1/2022 8:03:02 PM
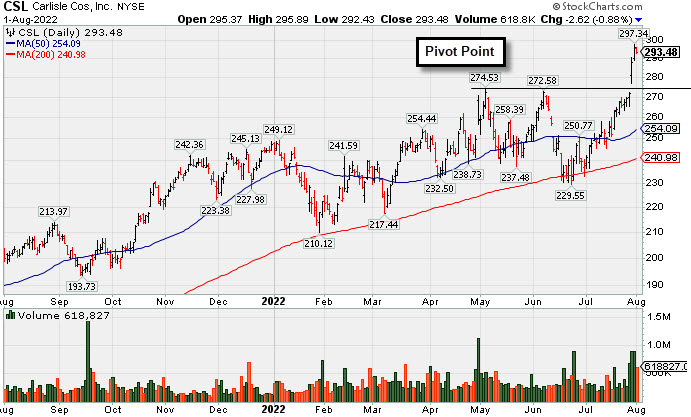
G - Color code is changed to green as it paused today perched at its all-time high and above its "max buy" level following 5 consecutive volume-driven gains. Bullish action continued since highlighted in yellow in the 7/28/22 mid-day report with pivot point cited based on its 5/04/22 high plus 10 cents. Found support in recent weeks at its 200 DMA line ($241). Reported Jun '22 quarterly earnings +185% on +57% sales revenues versus the year ago period, its 4th very strong quarter well above the +25% minimum earnings guideline (C criteria). Annual earnings (A criteria) history included a downturn in FY '20.
 There are no Featured Stock Updates™ available for this stock at this time. You may request one by clicking the Request a New Note link below |
View all notes |
Set NEW NOTE alert |
Company Profile |
SEC
News |
Chart |
Request a new note
C
A
S
I
There are no Featured Stock Updates™ available for this stock at this time. You may request one by clicking the Request a New Note link below |
View all notes |
Set NEW NOTE alert |
Company Profile |
SEC
News |
Chart |
Request a new note
C
A
S
I |
ENPH
-
NASDAQ
Enphase Energy Inc
Energy-Solar
|
$280.89
|
-3.29
-1.16% |
$290.47
|
4,426,823
145.05% of 50 DAV
50 DAV is 3,052,000
|
$287.38
-2.26%
|
7/28/2022
|
$276.66
|
PP = $282.55
|
|
MB = $296.68
|
Most Recent Note - 8/1/2022 7:56:21 PM
Y - There was a "negative reversal" after hitting another new high today. With 3 consecutive volume-driven gains last week it rallied and closed above the pivot point cited based on its 11/22/21 high plus 10 cents triggering a technical buy signal. Fundamentals remain strong after reporting solid Jun '22 quarterly results, continuing its strong earnings history. See the latest FSU analysis for more details and a new annotated graph.
>>> FEATURED STOCK ARTICLE : Pullback Following 3 Consecutive Gains With Heavier Volume - 8/1/2022 |
View all notes |
Set NEW NOTE alert |
Company Profile |
SEC
News |
Chart |
Request a new note
C
A
S
I |
PWR
-
NYSE
Quanta Services Inc
MATERIALS and CONSTRUCTION - General Contractors
|
$138.72
|
-0.01
-0.01% |
$139.47
|
1,453,651
93.78% of 50 DAV
50 DAV is 1,550,000
|
$146.87
-5.55%
|
7/28/2022
|
$141.83
|
PP = $140.14
|
|
MB = $147.15
|
Most Recent Note - 7/29/2022 6:49:54 PM
Y - There was a "negative reversal" today after touching a new high. Gapped up on the prior session hitting a new all-time high with a big volume-driven gain above the pivot point clinching a technical buy signal. Found support near its 200 DMA line in recent months while consolidating. Due to report Jun '22 quarterly results on 8/04/22. Reported Mar '22 quarterly earnings +65% versus the year ago period, its 3rd quarterly comparison above the +25% minimum earnings guideline (C criteria). Annual earnings (A criteria) growth has been strong and steady. See the latest FSU analysis for more details and an annotated graph.
>>> FEATURED STOCK ARTICLE : Volume-Driven Breakout for Quanta Services - 7/28/2022 |
View all notes |
Set NEW NOTE alert |
Company Profile |
SEC
News |
Chart |
Request a new note
C
A
S
I |
Symbol/Exchange
Company Name
Industry Group |
PRICE |
CHANGE
(%Change) |
Day High |
Volume
(% DAV)
(% 50 day avg vol) |
52 Wk Hi
% From Hi |
Featured
Date |
Price
Featured |
Pivot Featured |
|
Max Buy |
CLFD
-
NASDAQ
Clearfield Inc
TELECOMMUNICATIONS - Cables / Satalite Equipment
|
$96.45
|
-2.10
-2.13% |
$99.58
|
476,992
276.20% of 50 DAV
50 DAV is 172,700
|
$99.15
-2.72%
|
7/29/2022
|
$94.10
|
PP = $86.81
|
|
MB = $91.15
|
Most Recent Note - 8/1/2022 12:18:04 PM
G - Pulling back today with above average volume. Color code is changed to green after spiking to a new 52-week high and above its "max buy" level with +395% above average volume behind the prior gain triggering a technical buy signal. Fundamentals remain strong after it reported Jun '22 quarterly earnings +109% on +84% sales revenues above the year ago period. See the latest FSU analysis for more details and an annotated graph.
>>> FEATURED STOCK ARTICLE : Volume Heavy Behind Technical Breakout - 7/29/2022 |
View all notes |
Set NEW NOTE alert |
Company Profile |
SEC
News |
Chart |
Request a new note
C
A
S
I |
|
|
|
THESE ARE NOT BUY RECOMMENDATIONS!
Comments contained in the body of this report are technical
opinions only. The material herein has been obtained
from sources believed to be reliable and accurate, however,
its accuracy and completeness cannot be guaranteed.
This site is not an investment advisor, hence it does
not endorse or recommend any securities or other investments.
Any recommendation contained in this report may not
be suitable for all investors and it is not to be deemed
an offer or solicitation on our part with respect to
the purchase or sale of any securities. All trademarks,
service marks and trade names appearing in this report
are the property of their respective owners, and are
likewise used for identification purposes only.
This report is a service available
only to active Paid Premium Members.
You may opt-out of receiving report notifications
at any time. Questions or comments may be submitted
by writing to Premium Membership Services 665 S.E. 10 Street, Suite 201 Deerfield Beach, FL 33441-5634 or by calling 1-800-965-8307
or 954-785-1121.
|
|
|