***Last / Change / Volume data in this table is the closing quote data***
Symbol/Exchange
Company Name
Industry Group |
PRICE |
CHANGE
(%Change) |
Day High |
Volume
(% DAV)
(% 50 day avg vol) |
52 Wk Hi
% From Hi |
Featured
Date |
Price
Featured |
Pivot Featured |
|
Max Buy |
 SPSC
-
NASDAQ
SPSC
-
NASDAQ
S P S Commerce Inc
COMPUTER SOFTWARE and SERVICES - Application Software
|
$111.25
|
-0.58
-0.52% |
$114.63
|
110,324
79.94% of 50 DAV
50 DAV is 138,000
|
$118.28
-5.94%
|
6/7/2019
|
$107.72
|
PP = $115.10
|
|
MB = $120.86
|
 Most Recent Note - 8/1/2019 5:47:23 PM
Y - Holding its ground with volume totals cooling since a gap up and big volume-driven gain noted on 7/26/19. Subsequent gains and a strong close above the pivot point may clinch a convincing new (or add-on) technical buy signal. Reported earnings +22% on +12% sales revenues for the Jun '19 quarter, slightly under the +25% minimum earnings guideline (C criteria), raising fundamental concerns.
>>> FEATURED STOCK ARTICLE : Recently Sputtering Below 50-Day Moving Average - 7/9/2019 |
View all notes |
Set NEW NOTE alert |
Company Profile |
SEC
News |
Chart |
Request a new note
C
A
S
I |
EPAM
-
NYSE
Epam Systems Inc
COMPUTER SOFTWARE and SERVICES - Information Technology Service
|
$193.74
|
-0.05
-0.03% |
$197.82
|
301,501
61.66% of 50 DAV
50 DAV is 489,000
|
$201.00
-3.61%
|
5/9/2019
|
$169.25
|
PP = $180.55
|
|
MB = $189.58
|
Most Recent Note - 7/30/2019 4:37:45 PM
G - Perched at its 52-week high with volume-totals cooling after getting very extended from any sound base. Due to report earnings news before the open on Thursday, August 8, 2019. Prior highs in the $179-180 area coincide with its 50 DMA line ($180) defining important support.
>>> FEATURED STOCK ARTICLE : Winning Streak Leaves IT Firm Extended From Prior Base - 7/12/2019 |
View all notes |
Set NEW NOTE alert |
Company Profile |
SEC
News |
Chart |
Request a new note
C
A
S
I |
AUDC
-
NASDAQ
Audiocodes Ltd
ELECTRONICS - Scientific and Technical Instrum
|
$18.73
|
+0.07
0.38% |
$19.20
|
229,295
131.78% of 50 DAV
50 DAV is 174,000
|
$19.74
-5.12%
|
7/15/2019
|
$17.10
|
PP = $17.54
|
|
MB = $18.42
|
Most Recent Note - 7/31/2019 6:15:28 PM
G - Retreated from its all-time high with higher volume behind today's loss. Bullish action came after it recently reported earnings +57% on +14% sales revenues for the Jun '19 quarter, continuing its strong earnings track record. Big gain 7/23/19 and strong close above the pivot point was backed by 11 times average volume triggered a technical buy signal. Prior highs in the $17 area define initial support above its 50 DMA line ($16).
>>> FEATURED STOCK ARTICLE : Posted a Gain With Average Volume for Best Ever Close - 7/15/2019 |
View all notes |
Set NEW NOTE alert |
Company Profile |
SEC
News |
Chart |
Request a new note
C
A
S
I |
ENV
-
NYSE
Envestnet Inc
FINANCIAL SERVICES - Diversified Investments
|
$70.08
|
-1.33
-1.86% |
$72.13
|
248,982
94.31% of 50 DAV
50 DAV is 264,000
|
$73.94
-5.22%
|
3/15/2019
|
$66.05
|
PP = $64.90
|
|
MB = $68.15
|
Most Recent Note - 7/30/2019 4:34:15 PM
G - Pulled back from its 52-week high. Its 50 DMA ($69.62) line defines support above prior lows in the $65-66 area. Due to report second quarter financial results on Wednesday, August 7, 2019 after the close. Fundamental concerns were raised after it reported earnings +5% on +1% sales revenues for the Mar '19 quarter, below the +25% minimum earnings guideline (C criteria).
>>> FEATURED STOCK ARTICLE : Rebounded Above 50-Day Moving Average Line - 7/2/2019 |
View all notes |
Set NEW NOTE alert |
Company Profile |
SEC
News |
Chart |
Request a new note
C
A
S
I |
LHCG
-
NASDAQ
L H C Group Inc
HEALTH SERVICES - Home Health Care
|
$123.51
|
-3.07
-2.43% |
$128.39
|
317,507
148.37% of 50 DAV
50 DAV is 214,000
|
$129.37
-4.53%
|
7/1/2019
|
$110.94
|
PP = $122.20
|
|
MB = $128.31
|
Most Recent Note - 8/1/2019 5:53:08 PM
Y - Pulled back today with higher volume after quietly touching a new all-time high on the prior session. Recent gains above its pivot point were not backed by the +40% above average volume needed to trigger a proper new (or add-on) technical buy signal. Its 50 DMA line ($118.98) defines near-term support above recent lows. Due to report earnings news on 8/07/19.
>>> FEATURED STOCK ARTICLE : Consolidating Following a Negative Reversal at High - 7/22/2019 |
View all notes |
Set NEW NOTE alert |
Company Profile |
SEC
News |
Chart |
Request a new note
C
A
S
I |
Symbol/Exchange
Company Name
Industry Group |
PRICE |
CHANGE
(%Change) |
Day High |
Volume
(% DAV)
(% 50 day avg vol) |
52 Wk Hi
% From Hi |
Featured
Date |
Price
Featured |
Pivot Featured |
|
Max Buy |
ENSG
-
NASDAQ
Ensign Group Inc
HEALTH SERVICES - Long-Term Care Facilities
|
$58.27
|
-1.99
-3.30% |
$60.54
|
278,019
106.52% of 50 DAV
50 DAV is 261,000
|
$63.00
-7.51%
|
4/30/2019
|
$51.46
|
PP = $53.30
|
|
MB = $55.97
|
Most Recent Note - 8/1/2019 5:40:08 PM
G - Report earnings +23% on +16% sales revenues for the Jun '19 quarter versus the year ago period. Volume and volatility often increase near earnings news. Pulled back from its all-time high today following 7 consecutive small gains. Its 50 DMA line ($56.66 and recent low ($52.34 on 5/31/19) define near-term support to watch.
>>> FEATURED STOCK ARTICLE : Nursing Facility Operator Touched New High - 7/1/2019 |
View all notes |
Set NEW NOTE alert |
Company Profile |
SEC
News |
Chart |
Request a new note
C
A
S
I |
CHDN
-
NASDAQ
Churchill Downs Inc
LEISURE - Gaming Activities
|
$126.23
|
+6.58
5.50% |
$132.73
|
490,280
183.63% of 50 DAV
50 DAV is 267,000
|
$123.05
2.58%
|
7/22/2019
|
$118.45
|
PP = $118.89
|
|
MB = $124.83
|
Most Recent Note - 8/1/2019 11:58:42 AM
G - Powering to a new all-time high above its "max buy" level and its color code is changed to green. Reported Jun '19 earnings rose +10% on +26% sales revenues versus the year ago period. Volume and volatility often increase near earnings news. Its 50 DMA line ($112.75) and prior low ($108.57 on 6/25/19) define important near-term support to watch on pullbacks
>>> FEATURED STOCK ARTICLE : Volume Light While Hovering at Record High - 7/16/2019 |
View all notes |
Set NEW NOTE alert |
Company Profile |
SEC
News |
Chart |
Request a new note
C
A
S
I |
WWD
-
NASDAQ
Woodward Inc
MANUFACTURING - Diversified Machinery
|
$111.86
|
-0.18
-0.16% |
$113.84
|
432,534
84.15% of 50 DAV
50 DAV is 514,000
|
$119.20
-6.16%
|
6/18/2019
|
$112.34
|
PP = $114.65
|
|
MB = $120.38
|
Most Recent Note - 7/31/2019 6:22:21 PM
G - Color code is changed to green after violating its 50 DMA line ($113.50) with a big loss today on higher (but below average) volume. Subsequent gains for new highs backed by at least +40% above average volume may clinch a convincing technical buy signal. Due to report financial results after the close on Monday, August 5, 2019. Volume and volatility often increase near earnings news.
>>> FEATURED STOCK ARTICLE : Perched Near All-Time High After Gains Lacking Great Volume - 7/24/2019 |
View all notes |
Set NEW NOTE alert |
Company Profile |
SEC
News |
Chart |
Request a new note
C
A
S
I |
LULU
-
NASDAQ
Lululemon Athletica
MANUFACTURING - Textile Manufacturing
|
$185.45
|
-5.64
-2.95% |
$192.15
|
1,644,244
77.71% of 50 DAV
50 DAV is 2,116,000
|
$194.25
-4.53%
|
6/13/2019
|
$174.48
|
PP = $179.60
|
|
MB = $188.58
|
Most Recent Note - 8/1/2019 5:41:28 PM
G - Pulled back from its all-time high with today's 3rd consecutive loss with below average volume. Its 50 DMA line ($180.75) defines important near-term support. Reported Apr '19 quarterly earnings +35% on +20% sales revenues versus the year ago period.
>>> FEATURED STOCK ARTICLE : Quietly Hovering at All-Time High - 7/17/2019 |
View all notes |
Set NEW NOTE alert |
Company Profile |
SEC
News |
Chart |
Request a new note
C
A
S
I |
ULTA
-
NASDAQ
Ulta Beauty Inc
SPECIALTY RETAIL - Specialty Retail, Other
|
$345.51
|
-3.74
-1.07% |
$352.08
|
679,935
91.14% of 50 DAV
50 DAV is 746,000
|
$368.83
-6.32%
|
3/15/2019
|
$341.27
|
PP = $322.59
|
|
MB = $338.72
|
Most Recent Note - 8/1/2019 5:51:09 PM
G - Sputtering near its 50 DMA line ($346.67). Volume totals have been mostly light while still hovering near its all-time high. Reported earnings +17% on +13% sales revenues for the Apr '19 quarter, below the +25% minimum earnings guideline (C criteria), raising fundamental concerns.
>>> FEATURED STOCK ARTICLE : Stalled After Recently Wedging to New Record High - 7/5/2019 |
View all notes |
Set NEW NOTE alert |
Company Profile |
SEC
News |
Chart |
Request a new note
C
A
S
I |
Symbol/Exchange
Company Name
Industry Group |
PRICE |
CHANGE
(%Change) |
Day High |
Volume
(% DAV)
(% 50 day avg vol) |
52 Wk Hi
% From Hi |
Featured
Date |
Price
Featured |
Pivot Featured |
|
Max Buy |
CHGG
-
NYSE
Chegg Inc
Consumer Svcs-Education
|
$45.03
|
+0.11
0.24% |
$45.74
|
1,374,473
90.84% of 50 DAV
50 DAV is 1,513,000
|
$48.22
-6.62%
|
7/8/2019
|
$44.11
|
PP = $41.79
|
|
MB = $43.88
|
Most Recent Note - 7/30/2019 4:02:17 PM
G - Gapped up today and rallied for a new high with heavy volume and its color code was changed to green after getting extended from the prior base. Prior highs in the $40-41 area define important support to watch above its 50 DMA line. Reported earnings +92% on +26% sales revenues for the Jun '19 quarter.
>>> FEATURED STOCK ARTICLE : Tallied a Big Volume-Driven Breakout Gain for a New High - 7/8/2019 |
View all notes |
Set NEW NOTE alert |
Company Profile |
SEC
News |
Chart |
Request a new note
C
A
S
I |
NOW
-
NYSE
Servicenow Inc
Computer Sftwr-Enterprse
|
$274.00
|
-3.39
-1.22% |
$281.72
|
2,753,313
175.48% of 50 DAV
50 DAV is 1,569,000
|
$303.17
-9.62%
|
4/22/2019
|
$242.64
|
PP = $251.75
|
|
MB = $264.34
|
Most Recent Note - 7/31/2019 6:32:35 PM
G - Sank below its 50 DMA line ($281) with today's loss on higher volume raising concerns and triggering a technical sell signal. Last week it reported earnings +45% on +32% sales revenues for the Jun '19 quarter, above the +25% minimum earnings guideline (C criteria). See the latest FSU analysis for more details and a new annotated graph.
>>> FEATURED STOCK ARTICLE : Slumped Below 50-Day Average With Loss on Higher Volume - 7/31/2019 |
View all notes |
Set NEW NOTE alert |
Company Profile |
SEC
News |
Chart |
Request a new note
C
A
S
I |
VEEV
-
NYSE
Veeva Systems Inc Cl A
Computer Sftwr-Medical
|
$165.24
|
-0.66
-0.40% |
$169.20
|
1,162,655
70.51% of 50 DAV
50 DAV is 1,649,000
|
$176.90
-6.59%
|
5/30/2019
|
$154.32
|
PP = $145.80
|
|
MB = $153.09
|
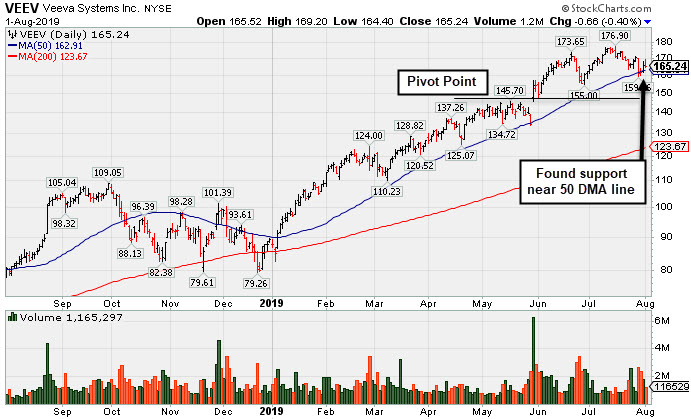
Most Recent Note - 8/1/2019 5:37:47 PM
G - Quietly consolidating after testing its 50 DMA line ($162.91) with volume-driven losses. That important short-term average defines near-term support above the prior low ($155 on 6/27/19). Fundamentals remain strong. See the latest FSU analysis for more details and a new annotated graph.
>>> FEATURED STOCK ARTICLE : Recently Found Support Near 50-Day Moving Average - 8/1/2019 |
View all notes |
Set NEW NOTE alert |
Company Profile |
SEC
News |
Chart |
Request a new note
C
A
S
I |
PAYC
-
NYSE
Paycom Software Inc
COMPUTER SOFTWARE and SERVICES - Application Software
|
$237.88
|
-2.87
-1.19% |
$242.80
|
877,008
122.32% of 50 DAV
50 DAV is 717,000
|
$246.85
-3.63%
|
2/6/2019
|
$171.66
|
PP = $164.18
|
|
MB = $172.39
|
Most Recent Note - 7/31/2019 1:15:36 PM
G - Reported earnings +27% on +31% sales revenues for the Jun '19 quarter, continuing its strong earnings track record. Gapped up today challenging its all-time high, however it is extended from any sound base. Volume and volatility often increase near earnings news. Found support at its 50 DMA line during consolidations throughout this year's ongoing ascent.
>>> FEATURED STOCK ARTICLE : Perched Near High Extended From Any Sound Base - 6/28/2019 |
View all notes |
Set NEW NOTE alert |
Company Profile |
SEC
News |
Chart |
Request a new note
C
A
S
I |
PYPL
-
NASDAQ
Paypal Holdings Inc
Finance-CrdtCard/PmtPr
|
$110.80
|
+0.40
0.36% |
$112.45
|
9,221,175
152.19% of 50 DAV
50 DAV is 6,059,000
|
$121.48
-8.79%
|
1/24/2019
|
$92.56
|
PP = $93.80
|
|
MB = $98.49
|
Most Recent Note - 7/29/2019 12:36:47 PM
G - Slumping further below its 50 DMA line ($115.22) and undercutting the prior low ($113.08 on 6/27/19) with above average volume behind today's loss raising greater concerns. A prompt rebound above the 50 DMA line is needed for its outlook to improve. Reported Jun '19 quarterly earnings +48% on +12% sales revenues versus the year ago period.
>>> FEATURED STOCK ARTICLE : Perched Near Record High Ahead of Earnings News - 7/23/2019 |
View all notes |
Set NEW NOTE alert |
Company Profile |
SEC
News |
Chart |
Request a new note
C
A
S
I |
Symbol/Exchange
Company Name
Industry Group |
PRICE |
CHANGE
(%Change) |
Day High |
Volume
(% DAV)
(% 50 day avg vol) |
52 Wk Hi
% From Hi |
Featured
Date |
Price
Featured |
Pivot Featured |
|
Max Buy |
PLNT
-
NYSE
Planet Fitness Inc Cl A
Leisure-Services
|
$78.03
|
-0.63
-0.80% |
$79.48
|
900,442
60.15% of 50 DAV
50 DAV is 1,497,000
|
$81.90
-4.73%
|
7/26/2019
|
$79.15
|
PP = $82.00
|
|
MB = $86.10
|
Most Recent Note - 8/1/2019 5:49:23 PM
Y - Volume totals have been cooling while still consolidating above its 50 DMA line ($76.69). Volume-driven gains above the pivot point are needed to trigger a new (or add-on) technical buy signal. Due to report earnings news on 8/06/19.
>>> FEATURED STOCK ARTICLE : Fitness Firm Forming a New Base - 7/26/2019 |
View all notes |
Set NEW NOTE alert |
Company Profile |
SEC
News |
Chart |
Request a new note
C
A
S
I |
BLD
-
NYSE
Topbuild Corp
Bldg-Constr Prds/Misc
|
$85.78
|
+4.65
5.73% |
$89.87
|
1,466,701
492.18% of 50 DAV
50 DAV is 298,000
|
$86.96
-1.36%
|
5/17/2019
|
$82.19
|
PP = $87.31
|
|
MB = $91.68
|
Most Recent Note - 8/1/2019 12:14:04 PM
Y - Hitting a new all-time high with today's considerable volume-driven gain. Bullish action came after it reported earnings +39% on +9% sales revenues for the Jun '19 quarter versus the year ago period, continuing its strong earnings track record. Members were reminded - "Volume and volatility often increase near earnings news. A gain and strong close above the pivot point backed by at least +40% above average volume may clinch a convincing technical buy signal. Its 50 DMA line and recent lows define near-term support to watch on pullbacks."
>>> FEATURED STOCK ARTICLE : Perched Near 52-Week High Finding Support - 7/25/2019 |
View all notes |
Set NEW NOTE alert |
Company Profile |
SEC
News |
Chart |
Request a new note
C
A
S
I |
TEAM
-
NASDAQ
Atlassian Corp Plc Cl A
Comp Sftwr-Spec Enterprs
|
$143.92
|
+3.80
2.71% |
$145.95
|
1,634,488
125.44% of 50 DAV
50 DAV is 1,303,000
|
$149.80
-3.93%
|
5/24/2019
|
$129.52
|
PP = $132.09
|
|
MB = $138.69
|
Most Recent Note - 8/1/2019 5:44:40 PM
G - Posted another gain with above average volume today. Color code was changed to green after rising back above its "max buy" level. The 50 DMA line ($132.65) and prior low ($123.43 on 6/25/19) define important near-term support to watch where violations would raise concerns and trigger technical sell signals. Reported earnings +43% on +36% sales revenues for the Jun '19 quarter, continuing its strong earnings track record.
>>> FEATURED STOCK ARTICLE : Abrupt Retreat After Getting Very Extended From Prior Base - 7/29/2019 |
View all notes |
Set NEW NOTE alert |
Company Profile |
SEC
News |
Chart |
Request a new note
C
A
S
I |
GLOB
-
NYSE
Globant SA
Computer-Tech Services
|
$110.20
|
+4.20
3.96% |
$112.33
|
340,318
80.07% of 50 DAV
50 DAV is 425,000
|
$111.87
-1.49%
|
2/15/2019
|
$69.35
|
PP = $70.00
|
|
MB = $73.50
|
Most Recent Note - 8/1/2019 12:00:23 PM
G - Perched near its all-time high today, very extended from any sound base. Its 50 DMA line ($100) defines important support to watch on pullbacks. Fundamentals remain strong.
>>> FEATURED STOCK ARTICLE : Extended From Any Sound Base After Wedging Higher - 7/11/2019 |
View all notes |
Set NEW NOTE alert |
Company Profile |
SEC
News |
Chart |
Request a new note
C
A
S
I |
TTD
-
NASDAQ
The Trade Desk Inc Cl A
Comml Svcs-Advertising
|
$264.64
|
+1.33
0.51% |
$274.34
|
1,310,981
90.91% of 50 DAV
50 DAV is 1,442,000
|
$279.71
-5.39%
|
7/18/2019
|
$240.61
|
PP = $258.10
|
|
MB = $271.01
|
Most Recent Note - 7/29/2019 12:57:34 PM
Y - Encountering distributional pressure and abruptly retreating from its all-time high with today's volume-driven loss after 3 consecutive gains. The prior gain above the pivot point was backed by +80% above average volume and triggered a technical buy signal. Prior high ($258) defines initial support to watch above its 50 DMA line ($232.77). Reported earnings +44% on +41% sales revenues for the Mar '19 quarter, continuing its strong earnings track record.
>>> FEATURED STOCK ARTICLE : Endured Distributional Pressure While Building on New Base - 7/18/2019 |
View all notes |
Set NEW NOTE alert |
Company Profile |
SEC
News |
Chart |
Request a new note
C
A
S
I |
Symbol/Exchange
Company Name
Industry Group |
PRICE |
CHANGE
(%Change) |
Day High |
Volume
(% DAV)
(% 50 day avg vol) |
52 Wk Hi
% From Hi |
Featured
Date |
Price
Featured |
Pivot Featured |
|
Max Buy |
PAGS
-
NYSE
Pagseguro Digital Cl A
Finance-CrdtCard/PmtPr
|
$45.10
|
+1.62
3.73% |
$46.27
|
3,021,682
135.20% of 50 DAV
50 DAV is 2,235,000
|
$48.88
-7.73%
|
6/25/2019
|
$37.69
|
PP = $40.07
|
|
MB = $42.07
|
Most Recent Note - 8/1/2019 5:43:14 PM
G - Posted a solid gain today halting its slide after 3 consecutive losses while retreating from its all-time high. It is extended from any sound base. Prior high in the $40 area defines initial support to watch above its 50 DMA line ($39.17.
>>> FEATURED STOCK ARTICLE : Encountering Distributional Pressure After Impressive Sprint - 7/30/2019 |
View all notes |
Set NEW NOTE alert |
Company Profile |
SEC
News |
Chart |
Request a new note
C
A
S
I |