You are not logged in.
This means you
CAN ONLY VIEW reports that were published prior to Monday, February 19, 2024.
You
MUST UPGRADE YOUR MEMBERSHIP if you want to see any current reports.
AFTER MARKET UPDATE - FRIDAY, JULY 31ST, 2020
Previous After Market Report Next After Market Report >>>
|
|
|
|
DOW |
+114.67 |
26,428.32 |
+0.44% |
|
Volume |
1,305,439,508 |
+58% |
|
Volume |
4,389,989,000 |
+7% |
|
NASDAQ |
+159.99 |
10,747.80 |
+1.51% |
|
Advancers |
1,257 |
43% |
|
Advancers |
1,132 |
35% |
|
S&P 500 |
+24.90 |
3,271.12 |
+0.77% |
|
Decliners |
1,676 |
57% |
|
Decliners |
2,132 |
65% |
|
Russell 2000 |
-14.67 |
1,480.43 |
-0.98% |
|
52 Wk Highs |
83 |
|
|
52 Wk Highs |
152 |
|
|
S&P 600 |
-6.06 |
865.38 |
-0.70% |
|
52 Wk Lows |
19 |
|
|
52 Wk Lows |
27 |
|
|
 |
Stocks Overcame Weak Start to Post Gains and Finish Strong
Kenneth J. Gruneisen - Passed the CAN SLIM® Master's Exam
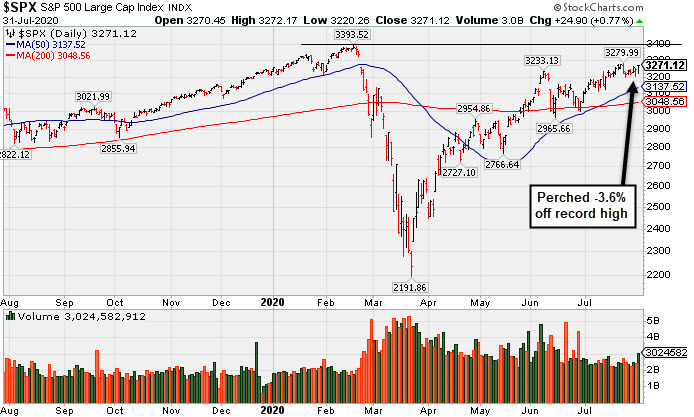
The Dow reversed a 300 point decline to add 114 points, but still retreated 0.2% for the week. The S&P 500 rose 0.8%, and ended the week 1.7% higher. The Tech-heavy Nasdaq Composite jumped 1.5%, extending its weekly advance to 3.7%. All three major averages rose for the fourth consecutive month, with the Dow adding 2.4%, the S&P 500 climbing 5.5%, and the Nasdaq Composite rallying 6.8%. The reported volume totals Friday were higher than the prior session on the NYSE and higher on the Nasdaq exchange. There were 70 high-ranked companies from the Leaders List that hit new 52-week highs and were listed on the BreakOuts Page, versus the total of 62 on the prior session. New 52-week highs totals solidly outnumbered new 52-week lows totals on both the NYSE and the Nasdaq exchange. The major indices are in a confirmed uptrend (M criteria). Any sustainable rally requires a healthy crop of new leaders, so it remains ever-important to see substantial new highs totals. Charts used courtesy of www.stockcharts.com
PICTURED: The S&P 500 Index is consolidating well above its 50-day moving average (DMA) line and the benchmark index is -3.6% off its record high.
Stocks fluctuated on the final day of July as investors digested earnings results from some of the world’s largest companies. Reports that lawmakers would work through the weekend to discuss the next coronavirus relief package lifted sentiment.
Technology and Consumer Discretionary stocks paced the gains, with Apple (AAPL +10.47%) hitting a new all-time high following a strong second-quarter and Amazon (AMZN +3.70%) rallying after a surge in e-commerce helped the company post its largest profit on record. Communication Services also outperformed, as Facebook (FB +8.17%) rallied after beating on the top and bottom line outweighed Alphabet’s (GOOGL -3.28%) decline after the company reported its first quarterly drop in revenue as a public company. Meanwhile, the Energy group lagged, with Chevron (CVX -2.70%) down following a wider than expected loss.
On the data front, the PCE core deflator, which is the Fed’s preferred proxy of inflation, rose 0.9% year-over-year in June. Separately, the final reading of consumer sentiment from the University of Michigan declined slightly in July. Treasuries were little changed, with the yield on the 10-year note steady at 0.54%. In commodities, gold rose 1.3% to $1,966.90/ounce and reached a fresh record during the session. Silver rallied 4.3%, to cap its best month in more than 40 years.
|
 Kenneth J. Gruneisen started out as a licensed stockbroker in August 1987, a couple of months prior to the historic stock market crash that took the Dow Jones Industrial Average down -22.6% in a single day. He has published daily fact-based fundamental and technical analysis on high-ranked stocks online for two decades. Through FACTBASEDINVESTING.COM, Kenneth provides educational articles, news, market commentary, and other information regarding proven investment systems that work in good times and bad.
Comments contained in the body of this report are technical opinions only and are not necessarily those of Gruneisen Growth Corp. The material herein has been obtained from sources believed to be reliable and accurate, however, its accuracy and completeness cannot be guaranteed. Our firm, employees, and customers may effect transactions, including transactions contrary to any recommendation herein, or have positions in the securities mentioned herein or options with respect thereto. Any recommendation contained in this report may not be suitable for all investors and it is not to be deemed an offer or solicitation on our part with respect to the purchase or sale of any securities. |
|
 |
Retail, Gold & Silver, and Networking Indexes Rose
Kenneth J. Gruneisen - Passed the CAN SLIM® Master's Exam
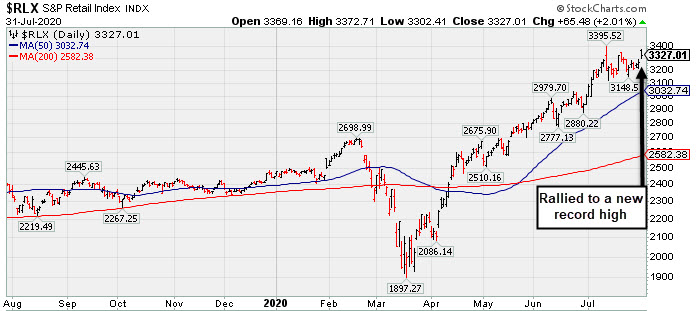
The Retail Index ($RLX +2.01%) posted a solid gain while the Broker/Dealer Index ($XBD -0.62%) and Bank Index ($BKX -0.37%) both created a drag on the major averages. Commodity-linked groups were mixed as the Gold & Silver Index ($XAU +2.84%) rallied further but the Oil Services Index ($OSX -2.14%) and Integrated Oil Index ($XOI -0.72%) both lost ground. The tech sector saw losses from the Biotech Index ($BTK -1.82%) and Semiconductor Index ($SOX -0.57%), meanwhile the Networking Index ($NWX +0.93%) posted a modest gain.
PICTURED: The Retail Index ($RLX +2.01%) rallied to a new high.
| Oil Services |
$OSX |
35.60 |
-0.78 |
-2.14% |
-54.53% |
| Integrated Oil |
$XOI |
741.56 |
-5.35 |
-0.72% |
-41.64% |
| Semiconductor |
$SOX |
2,135.29 |
-12.26 |
-0.57% |
+15.44% |
| Networking |
$NWX |
596.74 |
+5.50 |
+0.93% |
+2.28% |
| Broker/Dealer |
$XBD |
278.37 |
-1.75 |
-0.62% |
-4.14% |
| Retail |
$RLX |
3,327.01 |
+65.48 |
+2.01% |
+35.84% |
| Gold & Silver |
$XAU |
154.53 |
+4.27 |
+2.84% |
+44.53% |
| Bank |
$BKX |
74.49 |
-0.28 |
-0.37% |
-34.29% |
| Biotech |
$BTK |
5,657.51 |
-105.02 |
-1.82% |
+11.64% |
|
|
|
 |
Earning News Due Next Week for Homebuilder
Kenneth J. Gruneisen - Passed the CAN SLIM® Master's Exam
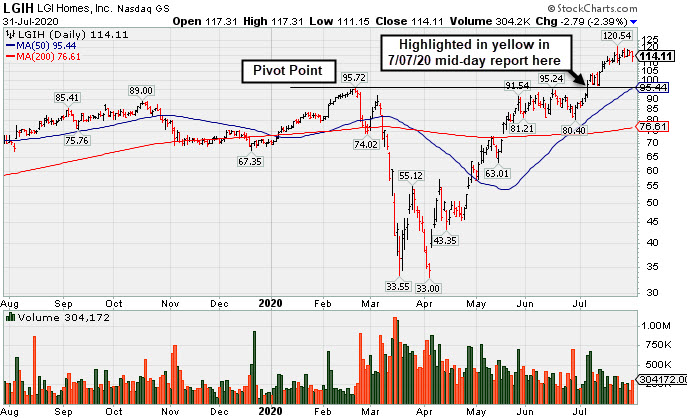
L G I Homes Inc (LGIH -$2.79 or -2.39% to $114.11) pulled back with below average behind today's small loss. It has been stubbornly holding its ground, extended from the previously noted base. Prior highs in the $95 area and its 50-day moving average (DMA) line ($95.44) coincide defining near-term support to watch. LGIH traded up as much as +21.5% since highlighted in yellow with pivot point cited based on its 2/21/20 high plus 10 cents in the 7/07/20 mid-day report (read here). It hit a new 52-week high with a gain and strong close above the pivot point backed by +53% above average volume, enough to trigger a convincing technical buy signal. The Building - Residential / Commercial firm was last shown in this FSU section on 7/07/20 under the headline, "Breakout to New High Backed by 53% Above Average Volume".
Keep in mind that it is due to report Jun '20 quarterly results before the open on Tuesday. 8/04/20. Volume and volatility often increase near earnings news. It reported earnings +129% on +58% sales revenues for the Mar '20 quarter versus the year ago period, its 3rd consecutive quarterly comparison above the +25% minimum earnings guideline (C criteria). Its annual earnings (A criteria) history has been strong. Improved earnings growth has been backed by solidly accelerating sales revenues increases which rose +3%, +10%, +27%, +42%, and +58% in the Mar, Jun, Sep, Dec '19 and Mar '20 comparisons, respectively. Fundamentals have been strong enough for it to get a 99 Earnings Per Share Rating, the highest possible rank. However, the current Group Relative Strength Rating of 61 reveals mediocre leadership (L criteria) in the industry group. It has a small supply (S criteria) of only The number of top-rated funds owning its shares rose from 372 in Dec '19 to 377 in Jun '20, however its current Up/Down Volume Ratio of 1.6 is an unbiased indication its shares have been under accumulation over the past 50 days. It has a Timeliness Rating of A and a Sponsorship Rating of D. LGIH completed its IPO at $11 on 11/07/13. Charts courtesy www.stockcharts.com
 |
|
|
Color Codes Explained :
Y - Better candidates highlighted by our
staff of experts.
G - Previously featured
in past reports as yellow but may no longer be buyable under the
guidelines.
***Last / Change / Volume data in this table is the closing quote data***
Symbol/Exchange
Company Name
Industry Group |
PRICE |
CHANGE
(%Change) |
Day High |
Volume
(% DAV)
(% 50 day avg vol) |
52 Wk Hi
% From Hi |
Featured
Date |
Price
Featured |
Pivot Featured |
|
Max Buy |
 FTNT
-
NASDAQ
FTNT
-
NASDAQ
Fortinet Inc
Computer Sftwr-Security
|
$138.30
|
+1.55
1.13% |
$138.52
|
843,207
51.64% of 50 DAV
50 DAV is 1,633,000
|
$151.95
-8.98%
|
6/22/2020
|
$142.68
|
PP = $149.79
|
|
MB = $157.28
|
 Most Recent Note - 7/31/2020 5:57:21 PM
Y - Due to report earnings news on 8/06/20. Color code is changed to yellow after it posted a quiet gain and closed back above its 50 DMA line ($137) helping its outlook to improve. Faces some near-term resistance due to overhead supply up to the $151 level.
>>> FEATURED STOCK ARTICLE : Best Ever Close With Volume-Driven Gain Approaching Pivot Point - 7/8/2020 |
View all notes |
Set NEW NOTE alert |
Company Profile |
SEC
News |
Chart |
Request a new note
C
A
S
I |
CRL
-
NYSE
Charles River Labs Intl
DRUGS - Biotechnology
|
$198.99
|
-2.32
-1.15% |
$202.24
|
285,517
74.94% of 50 DAV
50 DAV is 381,000
|
$203.26
-2.10%
|
7/15/2020
|
$192.66
|
PP = $189.95
|
|
MB = $199.45
|
Most Recent Note - 7/31/2020 5:53:32 PM
Y - Color code is changed to yellow after quietly pulling back just below its "max buy" level with today's small loss backed by below average volume. The prior high ($189.85 on 6/03/20) defines initial support to watch above its 50 DMA line ($183.32). Due to report Jun '20 quarterly earnings news before the open on Wednesday, 8/05/20.
>>> FEATURED STOCK ARTICLE : Volume +71% Above Average Behind Breakout - 7/15/2020 |
View all notes |
Set NEW NOTE alert |
Company Profile |
SEC
News |
Chart |
Request a new note
C
A
S
I |
EBS
-
NYSE
Emergent Biosolutions
DRUGS - Biotechnology
|
$111.24
|
+14.22
14.66% |
$114.13
|
1,827,653
198.01% of 50 DAV
50 DAV is 923,000
|
$107.16
3.81%
|
7/7/2020
|
$89.47
|
PP = $93.68
|
|
MB = $98.36
|
Most Recent Note - 7/31/2020 12:49:51 PM
G - Reported Jun '20 quarterly earnings +890% on +62% sales revenue for the Jun '20 quarter versus the year ago period. Volume and volatility often increase near earnings news. Gapped up today hitting a new all-time high, rallying above its "max buy" level, and its color code is changed to green. Prior highs in the $93 area define initial support above its 50 DMA line ($84.70).
>>> FEATURED STOCK ARTICLE : Impressive Rebound to Hit a New High - 7/9/2020 |
View all notes |
Set NEW NOTE alert |
Company Profile |
SEC
News |
Chart |
Request a new note
C
A
S
I |
NBIX
-
NASDAQ
Neurocrine Biosciences
DRUGS - Biotechnology
|
$120.36
|
-1.36
-1.12% |
$122.49
|
614,980
74.27% of 50 DAV
50 DAV is 828,000
|
$136.27
-11.68%
|
5/19/2020
|
$123.71
|
PP = $119.75
|
|
MB = $125.74
|
Most Recent Note - 7/28/2020 6:07:46 PM
G - Violated its 50 DMA line ($124.49) with a big loss today on below average volume triggering a technical sell signal. Only a prompt rebound above the 50 DMA line would help its outlook improve. Due to report Jun '20 quarterly earnings results on Monday 8/03/20. See the latest FSU analysis for more details and an annotated graph.
>>> FEATURED STOCK ARTICLE : Consolidating Near 50-Day Moving Average; Earnings Report Due - 7/27/2020 |
View all notes |
Set NEW NOTE alert |
Company Profile |
SEC
News |
Chart |
Request a new note
C
A
S
I |
BMRN
-
NASDAQ
Biomarin Pharmaceutical
DRUGS - Drug Manufacturers - Other
|
$119.81
|
-1.91
-1.57% |
$121.93
|
954,843
63.78% of 50 DAV
50 DAV is 1,497,000
|
$131.95
-9.20%
|
6/17/2020
|
$110.95
|
PP = $112.67
|
|
MB = $118.30
|
Most Recent Note - 7/29/2020 6:11:01 PM
G - Pulling back from its all-time high and slumping near its "max buy" level with light volume behind recent losses. Due to report earnings news on 8/04/20. Its 50 DMA line ($116.38) defines important near-term support to watch above the prior high ($112.57 on 6/04/20).
>>> FEATURED STOCK ARTICLE : Hovering Near High With Volume Totals Cooling - 7/10/2020 |
View all notes |
Set NEW NOTE alert |
Company Profile |
SEC
News |
Chart |
Request a new note
C
A
S
I |
Symbol/Exchange
Company Name
Industry Group |
PRICE |
CHANGE
(%Change) |
Day High |
Volume
(% DAV)
(% 50 day avg vol) |
52 Wk Hi
% From Hi |
Featured
Date |
Price
Featured |
Pivot Featured |
|
Max Buy |
AUDC
-
NASDAQ
Audiocodes Ltd
ELECTRONICS - Scientific and Technical Instrum
|
$36.09
|
-0.37
-1.01% |
$36.66
|
924,458
113.71% of 50 DAV
50 DAV is 813,000
|
$44.94
-19.69%
|
7/17/2020
|
$37.16
|
PP = $40.16
|
|
MB = $42.17
|
Most Recent Note - 7/28/2020 6:05:39 PM
G - Reported Jun '20 quarterly earnings +45% on +8% sales revenues versus the year-ago period. Volume and volatility often increase near earnings news. It gapped down today and suffered a big volume-driven loss while slumping back below the pivot point and falling into the prior base, raising concerns. Disciplined investors always limit losses by selling any stock that falls more than 7-8% from their purchase price.
>>> FEATURED STOCK ARTICLE : Resilient and High-Ranked VOIP Firm Rebounding Near Highs - 7/17/2020 |
View all notes |
Set NEW NOTE alert |
Company Profile |
SEC
News |
Chart |
Request a new note
C
A
S
I |
AMD
-
NASDAQ
Advanced Micro Devices
ELECTRONICS - Semiconductor - Broad Line
|
$77.43
|
-0.77
-0.98% |
$78.96
|
71,466,112
115.92% of 50 DAV
50 DAV is 61,649,000
|
$78.96
-1.94%
|
7/22/2020
|
$61.73
|
PP = $59.10
|
|
MB = $62.06
|
Most Recent Note - 7/30/2020 5:44:13 PM
G - Hit yet another new high with today's volume-driven gain. Reported earnings +125% on +26% sales revenues for the Jun '20 quarter versus the year ago period. Getting very extended from the previously noted base. Disciplined investors avoid chasing stocks more than +5% above prior highs. The prior highs in the $59 area define initial support to watch on pullbacks.
>>> FEATURED STOCK ARTICLE : Pullback After Breakout Gain Backed by +152% Above Average Volume - 7/23/2020 |
View all notes |
Set NEW NOTE alert |
Company Profile |
SEC
News |
Chart |
Request a new note
C
A
S
I |
TREX
-
NYSE
Trex Company Inc
MATERIALS and CONSTRUCTION - General Building Materials
|
$139.33
|
-0.53
-0.38% |
$141.09
|
426,487
45.37% of 50 DAV
50 DAV is 940,000
|
$140.10
-0.55%
|
6/26/2020
|
$109.05
|
PP = $132.94
|
|
MB = $139.59
|
Most Recent Note - 7/30/2020 5:58:33 PM
G - Color code is changed to green after rising above its "max buy" level. Keep in mind it is due to report Jun '20 quarterly results after the close on Monday, 8/03/20. Volume and volatility often increase near earnings news. Important near-term support is at its 50 DMA line ($125.82). See the latest FSU analysis for more details and a new annotated graph.
>>> FEATURED STOCK ARTICLE : Perched Near All Time High With Earnings News Due Monday - 7/30/2020 |
View all notes |
Set NEW NOTE alert |
Company Profile |
SEC
News |
Chart |
Request a new note
C
A
S
I |
NFLX
-
NASDAQ
Netflix Inc
SPECIALTY RETAIL - Music and Video Stores
|
$488.88
|
+3.08
0.63% |
$494.80
|
5,868,887
74.67% of 50 DAV
50 DAV is 7,860,000
|
$575.37
-15.03%
|
5/14/2020
|
$441.95
|
PP = $449.62
|
|
MB = $472.10
|
Most Recent Note - 7/29/2020 6:06:59 PM
G - Consolidating above its 50 DMA line ($462) and prior highs in the $458 area defining important near-term support. Extended from the prior base, and consolidating after reporting Jun '20 earnings +165% on +25% sales revenues versus the year ago period. See the latest FSU analysis for more details and a new annotated graph.
>>> FEATURED STOCK ARTICLE : Consolidating After Getting Extended From Prior Base - 7/29/2020 |
View all notes |
Set NEW NOTE alert |
Company Profile |
SEC
News |
Chart |
Request a new note
C
A
S
I |
CHGG
-
NYSE
Chegg Inc
Consumer Svcs-Education
|
$80.97
|
+2.51
3.20% |
$81.03
|
3,262,709
98.75% of 50 DAV
50 DAV is 3,304,000
|
$79.25
2.17%
|
6/17/2020
|
$63.71
|
PP = $68.08
|
|
MB = $71.48
|
Most Recent Note - 7/31/2020 5:59:04 PM
G - Hit another new all-time high with today's 3rd consecutive gain, getting more extended from any sound base. Due to report Jun '20 quarterly results on Monday, August 3, 2020, after the market close. Volume and volatility often increase near earnings news. Prior high in the $68 area defines support to watch coinciding with its 50 DMA line ($67.15) where any losses leading to violations would raise concerns and trigger technical sell signals.
>>> FEATURED STOCK ARTICLE : Negative Reversal After Recently Wedging into New High Territory - 7/13/2020 |
View all notes |
Set NEW NOTE alert |
Company Profile |
SEC
News |
Chart |
Request a new note
C
A
S
I |
Symbol/Exchange
Company Name
Industry Group |
PRICE |
CHANGE
(%Change) |
Day High |
Volume
(% DAV)
(% 50 day avg vol) |
52 Wk Hi
% From Hi |
Featured
Date |
Price
Featured |
Pivot Featured |
|
Max Buy |
LGIH
-
NASDAQ
L G I Homes Inc
Bldg-Resident/Comml
|
$114.11
|
-2.79
-2.39% |
$117.31
|
304,172
87.41% of 50 DAV
50 DAV is 348,000
|
$120.54
-5.33%
|
7/7/2020
|
$99.19
|
PP = $95.82
|
|
MB = $100.61
|
Most Recent Note - 7/31/2020 5:50:33 PM
G - Holding its ground near its all-time high, extended from the previously noted base. Prior highs in the $95 area and its 50 DMA line ($95.44) define near-term support to watch on pullbacks. Due to report Jun '20 quarterly earnings news before the open on Tuesday, 8/04/20. See the latest FSU analysis for more details and a new annotated graph.
>>> FEATURED STOCK ARTICLE : Earning News Due Next Week for Homebuilder - 7/31/2020 |
View all notes |
Set NEW NOTE alert |
Company Profile |
SEC
News |
Chart |
Request a new note
C
A
S
I |
NOW
-
NYSE
Servicenow Inc
Computer Sftwr-Enterprse
|
$439.20
|
+7.80
1.81% |
$439.20
|
1,730,739
101.75% of 50 DAV
50 DAV is 1,701,000
|
$454.70
-3.41%
|
4/30/2020
|
$343.05
|
PP = $363.05
|
|
MB = $381.20
|
Most Recent Note - 7/30/2020 12:59:48 PM
G - Report Jun '20 quarterly earnings +73% on +28% sales revenues versus the year ago period. Volume and volatility often increase near earnings news. Volume totals have been cooling while hovering near its all-time high, stubbornly holding its ground. It has not formed a sound base. Its 50 DMA line ($405.53) defines important near-term support to watch where a violation may trigger a technical sell signal.
>>> FEATURED STOCK ARTICLE : Perched Near All-Time High With Earnings News Due Next Week - 7/22/2020 |
View all notes |
Set NEW NOTE alert |
Company Profile |
SEC
News |
Chart |
Request a new note
C
A
S
I |
TEAM
-
NASDAQ
Atlassian Corp Plc Cl A
Comp Sftwr-Spec Enterprs
|
$176.65
|
-11.01
-5.87% |
$177.83
|
6,919,926
371.64% of 50 DAV
50 DAV is 1,862,000
|
$198.41
-10.97%
|
7/7/2020
|
$190.44
|
PP = $191.82
|
|
MB = $201.41
|
Most Recent Note - 7/31/2020 1:16:38 PM
G - Color code is changed to green after gapping down today and violating its 50 DMA line ($181.13) with a damaging volume-driven loss triggering a technical sell signal. Weak action came after it reported Jun '20 quarterly earnings +25% on +29% sales revenues versus the year ago period. Volume and volatility often increase near earnings news. Recent gains above the pivot point lacked the +40% above average volume necessary to trigger a convincing new (or add-on) technical buy signal. The prior low ($169.11 on 7/14/20) defines the next important support below its 50 DMA line.
>>> FEATURED STOCK ARTICLE : Consolidating Near High With Earnings News Due Soon - 7/24/2020 |
View all notes |
Set NEW NOTE alert |
Company Profile |
SEC
News |
Chart |
Request a new note
C
A
S
I |
TTD
-
NASDAQ
The Trade Desk Inc Cl A
Comml Svcs-Advertising
|
$451.32
|
+21.03
4.89% |
$452.00
|
1,644,347
99.06% of 50 DAV
50 DAV is 1,660,000
|
$475.67
-5.12%
|
6/3/2020
|
$340.61
|
PP = $327.35
|
|
MB = $343.72
|
Most Recent Note - 7/31/2020 6:01:06 PM
G - Due to report earnings news on 8/06/20. Posted a big gain today backed by average volume. Volume totals had been cooling while consolidating near its all-time high, very extended from any sound base. Its 50 DMA line ($394) defines near-term support to watch.
>>> FEATURED STOCK ARTICLE : Rebounded Near All-Time High With Gain Backed by Light Volume - 7/20/2020 |
View all notes |
Set NEW NOTE alert |
Company Profile |
SEC
News |
Chart |
Request a new note
C
A
S
I |
DOCU
-
NASDAQ
Docusign Inc
Computer Sftwr-Enterprse
|
$216.83
|
+2.89
1.35% |
$217.70
|
3,075,900
54.23% of 50 DAV
50 DAV is 5,672,000
|
$217.00
-0.08%
|
6/10/2020
|
$149.73
|
PP = $152.10
|
|
MB = $159.71
|
Most Recent Note - 7/29/2020 6:13:24 PM
G - Posted a 3rd consecutive gain today with below average volume. Still very extended from any sound base. Its 50 DMA line ($169) defines near-term support to watch. DOCU is now priced +102% above its 200 DMA price, and it is taught in the Certification that a stock trading +70-100% or more above the 200 DMA is to be recognized as a "sell signal". See the latest FSU analysis for more details and an annotated graph.
>>> FEATURED STOCK ARTICLE : E-Signature Firm is Extended From Any Sound Base - 7/28/2020 |
View all notes |
Set NEW NOTE alert |
Company Profile |
SEC
News |
Chart |
Request a new note
C
A
S
I |
Symbol/Exchange
Company Name
Industry Group |
PRICE |
CHANGE
(%Change) |
Day High |
Volume
(% DAV)
(% 50 day avg vol) |
52 Wk Hi
% From Hi |
Featured
Date |
Price
Featured |
Pivot Featured |
|
Max Buy |
PING
-
NYSE
Ping Identity Hldg Corp
Computer Sftwr-Security
|
$34.36
|
+0.03
0.09% |
$34.90
|
700,237
48.13% of 50 DAV
50 DAV is 1,455,000
|
$35.79
-4.00%
|
6/1/2020
|
$29.24
|
PP = $29.90
|
|
MB = $31.40
|
Most Recent Note - 7/29/2020 6:17:22 PM
G - Posted a gain today with light volume for its second-best ever close. Its 50 DMA line ($30.94) and prior highs in the $29 area define important near-term support. It has not formed a sound base of sufficient length. Completed Secondary Offerings on 7/09/20 and 5/15/20.
>>> FEATURED STOCK ARTICLE : Consolidating Above 50-Day Moving Average Following Secondary - 7/16/2020 |
View all notes |
Set NEW NOTE alert |
Company Profile |
SEC
News |
Chart |
Request a new note
C
A
S
I |
ZEN
-
NYSE
Zendesk Inc
Computer Sftwr-Enterprse
|
$91.15
|
-9.37
-9.32% |
$97.72
|
6,384,656
298.91% of 50 DAV
50 DAV is 2,136,000
|
$101.94
-10.58%
|
7/21/2020
|
$94.29
|
PP = $94.97
|
|
MB = $99.72
|
Most Recent Note - 7/31/2020 1:20:38 PM
Y - Pulling back abruptly today with heavy volume. retreating from a new all-time high hit on the prior session as it challenged it "max buy" level. Weak action came after it reported Jun '20 quarterly earnings +180% on +27% sales revenues versus the year-ago period. Volume and volatility often increase near earnings news.
>>> FEATURED STOCK ARTICLE : Pullback Below Pivot Point Following Breakout Gain - 7/21/2020 |
View all notes |
Set NEW NOTE alert |
Company Profile |
SEC
News |
Chart |
Request a new note
C
A
S
I |
|
|
|
THESE ARE NOT BUY RECOMMENDATIONS!
Comments contained in the body of this report are technical
opinions only. The material herein has been obtained
from sources believed to be reliable and accurate, however,
its accuracy and completeness cannot be guaranteed.
This site is not an investment advisor, hence it does
not endorse or recommend any securities or other investments.
Any recommendation contained in this report may not
be suitable for all investors and it is not to be deemed
an offer or solicitation on our part with respect to
the purchase or sale of any securities. All trademarks,
service marks and trade names appearing in this report
are the property of their respective owners, and are
likewise used for identification purposes only.
This report is a service available
only to active Paid Premium Members.
You may opt-out of receiving report notifications
at any time. Questions or comments may be submitted
by writing to Premium Membership Services 665 S.E. 10 Street, Suite 201 Deerfield Beach, FL 33441-5634 or by calling 1-800-965-8307
or 954-785-1121.
|
|
|