You are not logged in.
This means you
CAN ONLY VIEW reports that were published prior to Friday, February 23, 2024.
You
MUST UPGRADE YOUR MEMBERSHIP if you want to see any current reports.
AFTER MARKET UPDATE - TUESDAY, JULY 30TH, 2019
Previous After Market Report Next After Market Report >>>
|
|
|
|
DOW |
-23.33 |
27,198.02 |
-0.09% |
|
Volume |
775,803,330 |
+4% |
|
Volume |
1,871,484,990 |
-0% |
|
NASDAQ |
-19.72 |
8,273.61 |
-0.24% |
|
Advancers |
1,727 |
60% |
|
Advancers |
1,875 |
61% |
|
S&P 500 |
-7.79 |
3,013.18 |
-0.26% |
|
Decliners |
1,169 |
40% |
|
Decliners |
1,176 |
39% |
|
Russell 2000 |
+16.57 |
1,585.60 |
+1.06% |
|
52 Wk Highs |
231 |
|
|
52 Wk Highs |
98 |
|
|
S&P 600 |
+10.43 |
967.70 |
+1.09% |
|
52 Wk Lows |
79 |
|
|
52 Wk Lows |
84 |
|
|
 |
Major Indices Pulled Back With Less Leadership
Kenneth J. Gruneisen - Passed the CAN SLIM® Master's Exam
The Dow dropped 23 points, while the S&P 500 lost 0.3%. The Nasdaq Composite dipped 0.2%. The volume totals reported were slightly higher than the prior session total on the NYSE and near the prior session total on the Nasdaq exchange. Advancers led decliners by nearly a 3-2 margin on the NYSE and by more than a 3-2 margin on the Nasdaq exchange. There were 48 high-ranked companies from the Leaders List hit new 52-week highs and were listed on the BreakOuts Page, versus the total of 78 on the prior session. New 52-week highs totals outnumbered new 52-week lows totals on the NYSE and on the Nasdaq exchange. The major indices (M criteria) are in a "confirmed uptrend" under the fact-based system. The Featured Stocks Page provides the most timely analysis on high-ranked leaders.Charts used courtesy of www.stockcharts.com
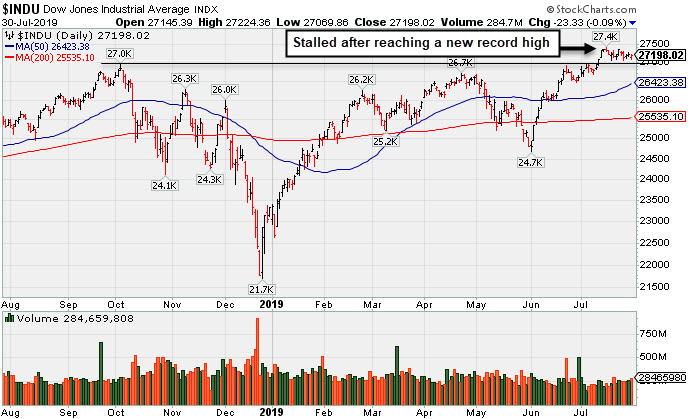
PICTURED: The Dow Jones Industrial Average stalled after reaching a new record high.
Stocks finished lower Tuesday as lingering trade tensions pressured sentiment. Top U.S. and Chinese negotiators resumed face-to-face talks, but expectations for a breakthrough were tempered after President Trump increased rhetoric against Beijing. The major averages pared declines, however, on news that President Trump had recently spoken with Chinese President Xi.
In earnings, Procter & Gamble (PG +3.80%) rose and reached an all-time high after delivering its best quarterly revenue growth in more than a decade. Merck (MRK +0.95%) rose after delivering a solid quarterly beat amid strength in its cancer-treating Keytruda drug. Under Armour (UA -13.69%) fell after the apparel maker forecasted a decline in North American revenue this year. In other corporate news, Capital One (COF -5.89%) after 106 million customers were reportedly affected by a data breach.
On the data front, the core PCE deflator, the Fed’s preferred gauge of inflation, rose 1.6% year-over-year in June, above May’s downwardly revised 1.5% pace. Separately, a reading on consumer confidence in July jumped to the highest level since last November. An additional release revealed personal spending increased 0.3% in June, matching expectations. Another report showed pending home sales spiked 2.8% in June, the largest gain in three months. Treasuries strengthened despite the positive economic data updates, with the yield on the 10-year note down one basis point to 2.05%. In commodities, WTI crude advanced 2.5%, nearing a two-week high of $58.27/barrel amid expectations of increased demand, given tomorrow’s widely anticipated Federal Reserve rate cut.
|
 Kenneth J. Gruneisen started out as a licensed stockbroker in August 1987, a couple of months prior to the historic stock market crash that took the Dow Jones Industrial Average down -22.6% in a single day. He has published daily fact-based fundamental and technical analysis on high-ranked stocks online for two decades. Through FACTBASEDINVESTING.COM, Kenneth provides educational articles, news, market commentary, and other information regarding proven investment systems that work in good times and bad.
Comments contained in the body of this report are technical opinions only and are not necessarily those of Gruneisen Growth Corp. The material herein has been obtained from sources believed to be reliable and accurate, however, its accuracy and completeness cannot be guaranteed. Our firm, employees, and customers may effect transactions, including transactions contrary to any recommendation herein, or have positions in the securities mentioned herein or options with respect thereto. Any recommendation contained in this report may not be suitable for all investors and it is not to be deemed an offer or solicitation on our part with respect to the purchase or sale of any securities. |
|
 |
Oil Services Index Posted Standout Gain
Kenneth J. Gruneisen - Passed the CAN SLIM® Master's Exam
The Broker/Dealer Index ($XBD +0.13%) and the Bank Index ($BKX +0.21%) both edged higher while the Retail Index ($RLX -0.66%) suffered a loss. The Biotech Index ($BTK +1.54%) rose while the Semiconductor Index ($SOX -0.26%) and the Networking Index ($NWX -0.47%) edged lower. The Gold & Silver Index ($XAU +0.45%) and Integrated Oil Index ($XOI +1.13%) posted small gains.
Charts courtesy of www.stockcharts.com
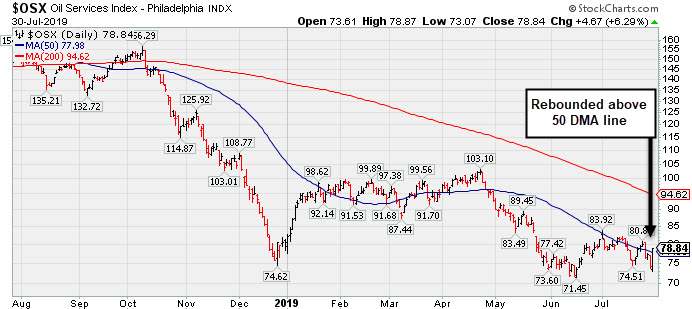
PICTURED: The Oil Services Index ($OSX +6.29%) was a standout gainer as it rebounded above its 50-day moving average (DMA) line.
| Oil Services |
$OSX |
78.84 |
+4.66 |
+6.28% |
-2.18% |
| Integrated Oil |
$XOI |
1,266.03 |
+14.18 |
+1.13% |
+9.22% |
| Semiconductor |
$SOX |
1,593.82 |
-4.20 |
-0.26% |
+37.97% |
| Networking |
$NWX |
603.37 |
-2.84 |
-0.47% |
+23.47% |
| Broker/Dealer |
$XBD |
274.21 |
+0.37 |
+0.13% |
+15.53% |
| Retail |
$RLX |
2,400.56 |
-15.98 |
-0.66% |
+23.02% |
| Gold & Silver |
$XAU |
92.24 |
+0.41 |
+0.45% |
+30.54% |
| Bank |
$BKX |
102.31 |
+0.21 |
+0.21% |
+19.26% |
| Biotech |
$BTK |
4,698.93 |
+71.24 |
+1.54% |
+11.33% |
|
|
|
 |
Encountering Distributional Pressure After Impressive Sprint
Kenneth J. Gruneisen - Passed the CAN SLIM® Master's Exam
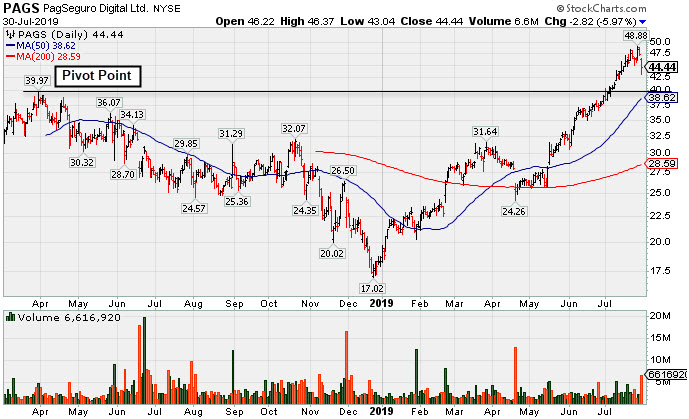
Pagseguro Digital Cl A (PAGS -$2.82 or -5.97% to $44.44) was down considerably with above average volume today, retreating from its all-time high after getting very extended from any sound base. The prior high in the $40 area defines initial support to watch above its 50-day moving average (DMA) line ($38.62).
PAGS traded up as much as +29.7% since first highlighted in yellow with pivot point cited based on its 3/29/18 high plus 10 cents in the 6/25/19 mid-day report (read here). It was shown that evening in this FSU section with an annotated graph under the headline, "Brazilian Payment Tech Firm Perched Near High". Subsequent volume-driven gains for new highs helped trigger a technical buy signal.
It has a 98 Earnings Per Share Rating. Quarterly comparisons through Mar '19 showed earnings increases above the +25% minimum guideline (C criteria), however, sequential comparisons have shown deceleration in its sales revenues and earnings growth rate. Limited history for this Brazil-based firm was also noted as a concern. It completed its $21.50 IPO on 1/24/18.
The number of top-rated funds owning its shares rose from 254 in Sep '18 to 318 in Mar '19, a reassuring sign concerning the I criteria. Its current Up/Down Volume Ratio of 1.8 is an unbiased indication its shares have been under accumulation over the past 50 days. It has earned a Timeliness Rating of A and Sponsorship Rating of C.
.
Charts courtesy of www.stockcharts.com
|
|
|
Color Codes Explained :
Y - Better candidates highlighted by our
staff of experts.
G - Previously featured
in past reports as yellow but may no longer be buyable under the
guidelines.
***Last / Change / Volume data in this table is the closing quote data***
Symbol/Exchange
Company Name
Industry Group |
PRICE |
CHANGE
(%Change) |
Day High |
Volume
(% DAV)
(% 50 day avg vol) |
52 Wk Hi
% From Hi |
Featured
Date |
Price
Featured |
Pivot Featured |
|
Max Buy |
 NSP
-
NYSE
NSP
-
NYSE
Insperity Inc
Comml Svcs-Outsourcing
|
$106.48
|
-2.41
-2.21% |
$108.42
|
1,744,322
505.89% of 50 DAV
50 DAV is 344,800
|
$144.92
-26.52%
|
7/19/2019
|
$136.39
|
PP = $132.60
|
|
MB = $139.23
|
 Most Recent Note - 7/30/2019 4:09:43 PM
Sank further today with above average volume. On the prior session it gapped down and then violated its 50 and 200 DMA lines with a damaging volume-driven loss triggering technical sell signals. Its Relative Strength Rating has slumped to 53. Reported earnings +22% on +13% sales revenues for the Jun '19 quarter, below the +25% minimum earnings guideline. Only a prompt rebound above the 50 DMA line would help its outlook improve. It will be dropped from the Featured Stocks list tonight.
>>> FEATURED STOCK ARTICLE : Insperity Hit New High With +55% Above Average Volume - 7/19/2019 |
View all notes |
Set NEW NOTE alert |
Company Profile |
SEC
News |
Chart |
Request a new note
C
A
S
I |
SPSC
-
NASDAQ
S P S Commerce Inc
COMPUTER SOFTWARE and SERVICES - Application Software
|
$113.40
|
+1.97
1.77% |
$113.47
|
175,705
128.25% of 50 DAV
50 DAV is 137,000
|
$118.28
-4.13%
|
6/7/2019
|
$107.72
|
PP = $115.10
|
|
MB = $120.86
|
Most Recent Note - 7/26/2019
Y - Color code is changed to yellow after gapping up above its 50 DMA line ($103.95) helping its outlook improve. Touched a new high earlier with today's big volume-driven gain, and a strong close above the pivot point may clinch a convincing new (or add-on) technical buy signal. Reported earnings +22% on +12% sales revenues for the Jun '19 quarter, slightly under the +25% minimum earnings guideline (C criteria), raising fundamental concerns.
>>> FEATURED STOCK ARTICLE : Recently Sputtering Below 50-Day Moving Average - 7/9/2019 |
View all notes |
Set NEW NOTE alert |
Company Profile |
SEC
News |
Chart |
Request a new note
C
A
S
I |
EPAM
-
NYSE
Epam Systems Inc
COMPUTER SOFTWARE and SERVICES - Information Technology Service
|
$197.48
|
-1.41
-0.71% |
$197.48
|
243,741
49.64% of 50 DAV
50 DAV is 491,000
|
$201.00
-1.75%
|
5/9/2019
|
$169.25
|
PP = $180.55
|
|
MB = $189.58
|
Most Recent Note - 7/30/2019 4:37:45 PM
G - Perched at its 52-week high with volume-totals cooling after getting very extended from any sound base. Due to report earnings news before the open on Thursday, August 8, 2019. Prior highs in the $179-180 area coincide with its 50 DMA line ($180) defining important support.
>>> FEATURED STOCK ARTICLE : Winning Streak Leaves IT Firm Extended From Prior Base - 7/12/2019 |
View all notes |
Set NEW NOTE alert |
Company Profile |
SEC
News |
Chart |
Request a new note
C
A
S
I |
AUDC
-
NASDAQ
Audiocodes Ltd
ELECTRONICS - Scientific and Technical Instrum
|
$19.43
|
-0.06
-0.31% |
$19.74
|
176,389
102.55% of 50 DAV
50 DAV is 172,000
|
$19.57
-0.72%
|
7/15/2019
|
$17.10
|
PP = $17.54
|
|
MB = $18.42
|
Most Recent Note - 7/29/2019 12:13:55 PM
G - Hitting another new all-time high today and its color code was changed to green after rising above its "max buy" level with volume-driven gains. Reported earnings +57% on +14% sales revenues for the Jun '19 quarter, continuing its strong earnings track record. Big gain 7/23/19 and strong close above the pivot point was backed by 11 times average volume triggered a technical buy signal. Prior highs in the $17 area define initial support above its 50 DMA line ($15.81).
>>> FEATURED STOCK ARTICLE : Posted a Gain With Average Volume for Best Ever Close - 7/15/2019 |
View all notes |
Set NEW NOTE alert |
Company Profile |
SEC
News |
Chart |
Request a new note
C
A
S
I |
ENV
-
NYSE
Envestnet Inc
FINANCIAL SERVICES - Diversified Investments
|
$71.49
|
-0.05
-0.07% |
$71.57
|
300,940
115.75% of 50 DAV
50 DAV is 260,000
|
$73.94
-3.31%
|
3/15/2019
|
$66.05
|
PP = $64.90
|
|
MB = $68.15
|
Most Recent Note - 7/30/2019 4:34:15 PM
G - Pulled back from its 52-week high. Its 50 DMA ($69.62) line defines support above prior lows in the $65-66 area. Due to report second quarter financial results on Wednesday, August 7, 2019 after the close. Fundamental concerns were raised after it reported earnings +5% on +1% sales revenues for the Mar '19 quarter, below the +25% minimum earnings guideline (C criteria).
>>> FEATURED STOCK ARTICLE : Rebounded Above 50-Day Moving Average Line - 7/2/2019 |
View all notes |
Set NEW NOTE alert |
Company Profile |
SEC
News |
Chart |
Request a new note
C
A
S
I |
Symbol/Exchange
Company Name
Industry Group |
PRICE |
CHANGE
(%Change) |
Day High |
Volume
(% DAV)
(% 50 day avg vol) |
52 Wk Hi
% From Hi |
Featured
Date |
Price
Featured |
Pivot Featured |
|
Max Buy |
LHCG
-
NASDAQ
L H C Group Inc
HEALTH SERVICES - Home Health Care
|
$126.58
|
+2.62
2.11% |
$126.85
|
225,355
103.37% of 50 DAV
50 DAV is 218,000
|
$128.31
-1.35%
|
7/1/2019
|
$110.94
|
PP = $122.20
|
|
MB = $128.31
|
Most Recent Note - 7/30/2019 4:14:40 PM
Y - Posted a gain today with near average volume for a best ever close challenging its all-time high. Recent gains above its pivot point were not backed by the +40% above average volume needed to trigger a proper new (or add-on) technical buy signal. Its 50 DMA line ($118.76) defines near-term support above recent lows. Fundamentals remain strong.
>>> FEATURED STOCK ARTICLE : Consolidating Following a Negative Reversal at High - 7/22/2019 |
View all notes |
Set NEW NOTE alert |
Company Profile |
SEC
News |
Chart |
Request a new note
C
A
S
I |
ENSG
-
NASDAQ
Ensign Group Inc
HEALTH SERVICES - Long-Term Care Facilities
|
$60.23
|
+0.20
0.33% |
$60.32
|
274,057
105.00% of 50 DAV
50 DAV is 261,000
|
$60.37
-0.23%
|
4/30/2019
|
$51.46
|
PP = $53.30
|
|
MB = $55.97
|
Most Recent Note - 7/30/2019 4:30:21 PM
G - Due to report financial results after the close on Thursday, August 1, 2019. Volume and volatility often increase near earnings news. Perched at its all-time high following 6 consecutive small gains. Its 50 DMA line ($56.55) and recent low ($52.34 on 5/31/19) define near-term support to watch.
>>> FEATURED STOCK ARTICLE : Nursing Facility Operator Touched New High - 7/1/2019 |
View all notes |
Set NEW NOTE alert |
Company Profile |
SEC
News |
Chart |
Request a new note
C
A
S
I |
CHDN
-
NASDAQ
Churchill Downs Inc
LEISURE - Gaming Activities
|
$122.71
|
+1.33
1.10% |
$123.05
|
225,622
86.45% of 50 DAV
50 DAV is 261,000
|
$121.63
0.89%
|
7/22/2019
|
$118.45
|
PP = $118.89
|
|
MB = $124.83
|
Most Recent Note - 7/30/2019 4:25:55 PM
Y - Posted a 3rd consecutive gain today with light volume and hit a new all-time high. Due to report financial results after the market closes on Wednesday, July 31, 2019. Volume and volatility often increase near earnings news. Its 50 DMA line ($111.67) and prior low ($108.57 on 6/25/19) define important near-term support to watch on pullbacks.
>>> FEATURED STOCK ARTICLE : Volume Light While Hovering at Record High - 7/16/2019 |
View all notes |
Set NEW NOTE alert |
Company Profile |
SEC
News |
Chart |
Request a new note
C
A
S
I |
WWD
-
NASDAQ
Woodward Inc
MANUFACTURING - Diversified Machinery
|
$114.81
|
+0.22
0.19% |
$114.82
|
319,727
62.32% of 50 DAV
50 DAV is 513,000
|
$119.20
-3.68%
|
6/18/2019
|
$112.34
|
PP = $114.65
|
|
MB = $120.38
|
Most Recent Note - 7/30/2019 4:44:56 PM
Y - Pulled back today testing support at its 50 DMA line ($113.45) then ended near the session high with a small gain on light volume. Subsequent gains for new highs backed by at least +40% above average volume may clinch a convincing technical buy signal. Due to report financial results after the close on Monday, August 5, 2019. Volume and volatility often increase near earnings news.
>>> FEATURED STOCK ARTICLE : Perched Near All-Time High After Gains Lacking Great Volume - 7/24/2019 |
View all notes |
Set NEW NOTE alert |
Company Profile |
SEC
News |
Chart |
Request a new note
C
A
S
I |
LULU
-
NASDAQ
Lululemon Athletica
MANUFACTURING - Textile Manufacturing
|
$191.77
|
-0.32
-0.17% |
$193.46
|
1,067,097
50.29% of 50 DAV
50 DAV is 2,122,000
|
$193.71
-1.00%
|
6/13/2019
|
$174.48
|
PP = $179.60
|
|
MB = $188.58
|
Most Recent Note - 7/30/2019 4:40:10 PM
G - Volume totals have been cooling while hovering near its all-time high, stubbornly holding its ground. Its 50 DMA line ($180) defines important near-term support. Reported Apr '19 quarterly earnings +35% on +20% sales revenues versus the year ago period.
>>> FEATURED STOCK ARTICLE : Quietly Hovering at All-Time High - 7/17/2019 |
View all notes |
Set NEW NOTE alert |
Company Profile |
SEC
News |
Chart |
Request a new note
C
A
S
I |
Symbol/Exchange
Company Name
Industry Group |
PRICE |
CHANGE
(%Change) |
Day High |
Volume
(% DAV)
(% 50 day avg vol) |
52 Wk Hi
% From Hi |
Featured
Date |
Price
Featured |
Pivot Featured |
|
Max Buy |
ULTA
-
NASDAQ
Ulta Beauty Inc
SPECIALTY RETAIL - Specialty Retail, Other
|
$348.63
|
+2.50
0.72% |
$350.45
|
578,591
76.84% of 50 DAV
50 DAV is 753,000
|
$368.83
-5.48%
|
3/15/2019
|
$341.27
|
PP = $322.59
|
|
MB = $338.72
|
Most Recent Note - 7/26/2019 6:15:54 PM
G - Volume totals have been cooling while hovering near its all-time high. Its 50 DMA line ($346.61) defines near-term support to watch. Reported earnings +17% on +13% sales revenues for the Apr '19 quarter, below the +25% minimum earnings guideline (C criteria), raising fundamental concerns.
>>> FEATURED STOCK ARTICLE : Stalled After Recently Wedging to New Record High - 7/5/2019 |
View all notes |
Set NEW NOTE alert |
Company Profile |
SEC
News |
Chart |
Request a new note
C
A
S
I |
CHGG
-
NYSE
Chegg Inc
Consumer Svcs-Education
|
$45.77
|
+3.74
8.90% |
$48.22
|
5,702,703
405.02% of 50 DAV
50 DAV is 1,408,000
|
$45.19
1.28%
|
7/8/2019
|
$44.11
|
PP = $41.79
|
|
MB = $43.88
|
Most Recent Note - 7/30/2019 4:02:17 PM
G - Gapped up today and rallied for a new high with heavy volume and its color code was changed to green after getting extended from the prior base. Prior highs in the $40-41 area define important support to watch above its 50 DMA line. Reported earnings +92% on +26% sales revenues for the Jun '19 quarter.
>>> FEATURED STOCK ARTICLE : Tallied a Big Volume-Driven Breakout Gain for a New High - 7/8/2019 |
View all notes |
Set NEW NOTE alert |
Company Profile |
SEC
News |
Chart |
Request a new note
C
A
S
I |
NOW
-
NYSE
Servicenow Inc
Computer Sftwr-Enterprse
|
$281.00
|
-4.84
-1.69% |
$286.39
|
1,551,720
98.33% of 50 DAV
50 DAV is 1,578,000
|
$303.17
-7.31%
|
4/22/2019
|
$242.64
|
PP = $251.75
|
|
MB = $264.34
|
Most Recent Note - 7/30/2019 4:06:18 PM
G - Quietly slumped near its 50 DMA line ($280) with today's loss on lighter volume. Damaging losses below its 7/29/19 low ($275.59) would raise greater concerns. Last week it reported earnings +45% on +32% sales revenues for the Jun '19 quarter, above the +25% minimum earnings guideline (C criteria).
>>> FEATURED STOCK ARTICLE : Pulling Back After Wedging to New Highs - 6/26/2019 |
View all notes |
Set NEW NOTE alert |
Company Profile |
SEC
News |
Chart |
Request a new note
C
A
S
I |
VEEV
-
NYSE
Veeva Systems Inc Cl A
Computer Sftwr-Medical
|
$161.73
|
-0.02
-0.01% |
$163.94
|
2,337,043
145.70% of 50 DAV
50 DAV is 1,604,000
|
$176.90
-8.58%
|
5/30/2019
|
$154.32
|
PP = $145.80
|
|
MB = $153.09
|
Most Recent Note - 7/29/2019 5:37:03 PM
G - Endured distributional pressure today with a loss on above average volume testing its 50 DMA line ($161.56). That important short-term average defines near-term support above the prior low ($155 on 6/27/19). Fundamentals remain strong.
>>> FEATURED STOCK ARTICLE : Halted Slide After 4 Volume-Driven Losses From High - 6/27/2019 |
View all notes |
Set NEW NOTE alert |
Company Profile |
SEC
News |
Chart |
Request a new note
C
A
S
I |
PAYC
-
NYSE
Paycom Software Inc
COMPUTER SOFTWARE and SERVICES - Application Software
|
$228.62
|
-0.99
-0.43% |
$229.91
|
853,631
124.07% of 50 DAV
50 DAV is 688,000
|
$246.85
-7.39%
|
2/6/2019
|
$171.66
|
PP = $164.18
|
|
MB = $172.39
|
Most Recent Note - 7/26/2019 6:08:47 PM
G - Extended from any sound base, quietly consolidating after wedging into new high territory with recent gains lacking great volume conviction. Its 50 DMA line ($224.22) defines near-term support to watch. Due to report Jun '19 quarterly earnings news after the close on Tuesday, 7/30/19. Volume and volatility often increase near earnings news.
>>> FEATURED STOCK ARTICLE : Perched Near High Extended From Any Sound Base - 6/28/2019 |
View all notes |
Set NEW NOTE alert |
Company Profile |
SEC
News |
Chart |
Request a new note
C
A
S
I |
Symbol/Exchange
Company Name
Industry Group |
PRICE |
CHANGE
(%Change) |
Day High |
Volume
(% DAV)
(% 50 day avg vol) |
52 Wk Hi
% From Hi |
Featured
Date |
Price
Featured |
Pivot Featured |
|
Max Buy |
PYPL
-
NASDAQ
Paypal Holdings Inc
Finance-CrdtCard/PmtPr
|
$112.04
|
+0.59
0.53% |
$112.29
|
8,351,947
142.74% of 50 DAV
50 DAV is 5,851,000
|
$121.48
-7.77%
|
1/24/2019
|
$92.56
|
PP = $93.80
|
|
MB = $98.49
|
Most Recent Note - 7/29/2019 12:36:47 PM
G - Slumping further below its 50 DMA line ($115.22) and undercutting the prior low ($113.08 on 6/27/19) with above average volume behind today's loss raising greater concerns. A prompt rebound above the 50 DMA line is needed for its outlook to improve. Reported Jun '19 quarterly earnings +48% on +12% sales revenues versus the year ago period.
>>> FEATURED STOCK ARTICLE : Perched Near Record High Ahead of Earnings News - 7/23/2019 |
View all notes |
Set NEW NOTE alert |
Company Profile |
SEC
News |
Chart |
Request a new note
C
A
S
I |
PLNT
-
NYSE
Planet Fitness Inc Cl A
Leisure-Services
|
$78.70
|
+0.74
0.95% |
$79.13
|
710,069
46.56% of 50 DAV
50 DAV is 1,525,000
|
$81.90
-3.91%
|
7/26/2019
|
$79.15
|
PP = $82.00
|
|
MB = $86.10
|
Most Recent Note - 7/26/2019 5:41:58 PM
Y - Volume was light behind 3 consecutive gains as it rebounded above its 50 DMA line ($76.72). Color code is changed to yellow with new pivot point cited based on its 6/18/19 high plus 10 cents. Volume-driven gains above the pivot point are needed to trigger a new (or add-on) technical buy signal. See the latest FSU analysis for more details and a new annotated graph.
>>> FEATURED STOCK ARTICLE : Fitness Firm Forming a New Base - 7/26/2019 |
View all notes |
Set NEW NOTE alert |
Company Profile |
SEC
News |
Chart |
Request a new note
C
A
S
I |
BLD
-
NYSE
Topbuild Corp
Bldg-Constr Prds/Misc
|
$82.06
|
+2.62
3.30% |
$82.90
|
320,200
104.98% of 50 DAV
50 DAV is 305,000
|
$86.96
-5.63%
|
5/17/2019
|
$82.19
|
PP = $87.31
|
|
MB = $91.68
|
Most Recent Note - 7/30/2019 4:20:09 PM
Y - Due to report earnings news prior to the open on 8/01/19. Volume and volatility often increase near earnings news. Consolidating above its 50 DMA line ($80.55). Subsequent gains above the pivot point backed by at least +40% above average volume may trigger a technical buy signal.
>>> FEATURED STOCK ARTICLE : Perched Near 52-Week High Finding Support - 7/25/2019 |
View all notes |
Set NEW NOTE alert |
Company Profile |
SEC
News |
Chart |
Request a new note
C
A
S
I |
TEAM
-
NASDAQ
Atlassian Corp Plc Cl A
Comp Sftwr-Spec Enterprs
|
$137.00
|
-2.05
-1.47% |
$139.53
|
1,177,392
90.78% of 50 DAV
50 DAV is 1,297,000
|
$149.80
-8.54%
|
5/24/2019
|
$129.52
|
PP = $132.09
|
|
MB = $138.69
|
Most Recent Note - 7/29/2019 5:31:31 PM
Y - Abruptly retreated today with heavy volume after hitting a new all-time high on the prior session. Color code was changed to yellow after pulling back below its "max buy" level. The 50 DMA line ($131.81) and prior low ($123.43 on 6/25/19) define important near-term support to watch where violations would raise concerns and trigger technical sell signals. Reported earnings +43% on +36% sales revenues for the Jun '19 quarter, continuing its strong earnings track record. See the latest FSU analysis for more details and a new annotated graph.
>>> FEATURED STOCK ARTICLE : Abrupt Retreat After Getting Very Extended From Prior Base - 7/29/2019 |
View all notes |
Set NEW NOTE alert |
Company Profile |
SEC
News |
Chart |
Request a new note
C
A
S
I |
GLOB
-
NYSE
Globant SA
Computer-Tech Services
|
$107.00
|
-4.22
-3.79% |
$110.68
|
227,270
54.11% of 50 DAV
50 DAV is 420,000
|
$111.87
-4.35%
|
2/15/2019
|
$69.35
|
PP = $70.00
|
|
MB = $73.50
|
Most Recent Note - 7/30/2019 4:13:00 PM
G - Pulled back from its all-time high today with light volume following 4 consecutive gains with below average volume. Very extended from any sound base. Its 50 DMA line ($100) defines important support to watch on pullbacks. Fundamentals remain strong.
>>> FEATURED STOCK ARTICLE : Extended From Any Sound Base After Wedging Higher - 7/11/2019 |
View all notes |
Set NEW NOTE alert |
Company Profile |
SEC
News |
Chart |
Request a new note
C
A
S
I |
Symbol/Exchange
Company Name
Industry Group |
PRICE |
CHANGE
(%Change) |
Day High |
Volume
(% DAV)
(% 50 day avg vol) |
52 Wk Hi
% From Hi |
Featured
Date |
Price
Featured |
Pivot Featured |
|
Max Buy |
TTD
-
NASDAQ
The Trade Desk Inc Cl A
Comml Svcs-Advertising
|
$265.13
|
+4.77
1.83% |
$269.26
|
1,324,453
91.40% of 50 DAV
50 DAV is 1,449,000
|
$279.71
-5.21%
|
7/18/2019
|
$240.61
|
PP = $258.10
|
|
MB = $271.01
|
Most Recent Note - 7/29/2019 12:57:34 PM
Y - Encountering distributional pressure and abruptly retreating from its all-time high with today's volume-driven loss after 3 consecutive gains. The prior gain above the pivot point was backed by +80% above average volume and triggered a technical buy signal. Prior high ($258) defines initial support to watch above its 50 DMA line ($232.77). Reported earnings +44% on +41% sales revenues for the Mar '19 quarter, continuing its strong earnings track record.
>>> FEATURED STOCK ARTICLE : Endured Distributional Pressure While Building on New Base - 7/18/2019 |
View all notes |
Set NEW NOTE alert |
Company Profile |
SEC
News |
Chart |
Request a new note
C
A
S
I |
PAGS
-
NYSE
Pagseguro Digital Cl A
Finance-CrdtCard/PmtPr
|
$44.44
|
-2.82
-5.97% |
$46.37
|
6,616,919
311.24% of 50 DAV
50 DAV is 2,126,000
|
$48.88
-9.08%
|
6/25/2019
|
$37.69
|
PP = $40.07
|
|
MB = $42.07
|
Most Recent Note - 7/30/2019 6:00:57 PM
G - Down considerably with above average volume today, retreating from its all-time high after getting very extended from any sound base. Prior high in the $40 area defines initial support to watch above its 50 DMA line ($38.62). See the latest FSU analysis for more details and a new annotated graph.
>>> FEATURED STOCK ARTICLE : Encountering Distributional Pressure After Impressive Sprint - 7/30/2019 |
View all notes |
Set NEW NOTE alert |
Company Profile |
SEC
News |
Chart |
Request a new note
C
A
S
I |
|
|
|
THESE ARE NOT BUY RECOMMENDATIONS!
Comments contained in the body of this report are technical
opinions only. The material herein has been obtained
from sources believed to be reliable and accurate, however,
its accuracy and completeness cannot be guaranteed.
This site is not an investment advisor, hence it does
not endorse or recommend any securities or other investments.
Any recommendation contained in this report may not
be suitable for all investors and it is not to be deemed
an offer or solicitation on our part with respect to
the purchase or sale of any securities. All trademarks,
service marks and trade names appearing in this report
are the property of their respective owners, and are
likewise used for identification purposes only.
This report is a service available
only to active Paid Premium Members.
You may opt-out of receiving report notifications
at any time. Questions or comments may be submitted
by writing to Premium Membership Services 665 S.E. 10 Street, Suite 201 Deerfield Beach, FL 33441-5634 or by calling 1-800-965-8307
or 954-785-1121.
|
|
|

