You are not logged in.
This means you
CAN ONLY VIEW reports that were published prior to Tuesday, February 20, 2024.
You
MUST UPGRADE YOUR MEMBERSHIP if you want to see any current reports.
AFTER MARKET UPDATE - MONDAY, JULY 27TH, 2020
Previous After Market Report Next After Market Report >>>
|
|
|
|
DOW |
+114.88 |
26,584.77 |
+0.43% |
|
Volume |
789,959,856 |
+11% |
|
Volume |
4,168,501,500 |
-1% |
|
NASDAQ |
+173.09 |
10,536.27 |
+1.67% |
|
Advancers |
1,768 |
60% |
|
Advancers |
1,933 |
59% |
|
S&P 500 |
+23.78 |
3,239.41 |
+0.74% |
|
Decliners |
1,193 |
40% |
|
Decliners |
1,352 |
41% |
|
Russell 2000 |
+17.10 |
1,484.65 |
+1.16% |
|
52 Wk Highs |
112 |
|
|
52 Wk Highs |
82 |
|
|
S&P 600 |
+10.24 |
861.83 |
+1.20% |
|
52 Wk Lows |
8 |
|
|
52 Wk Lows |
28 |
|
|
 |
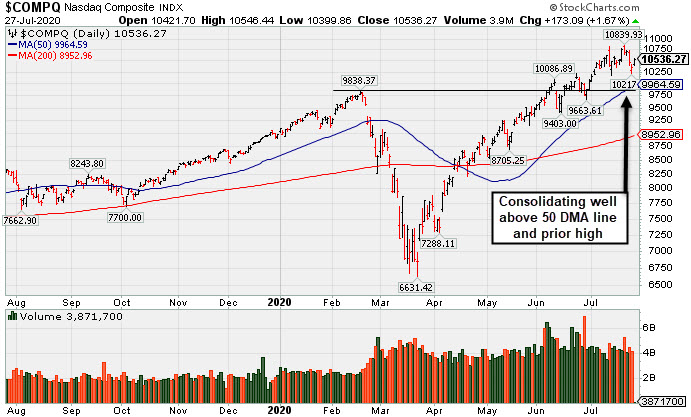
Major Indices Rose With Greater Leadership
Kenneth J. Gruneisen - Passed the CAN SLIM® Master's Exam
The Dow climbed 114 points, while the S&P 500 rose 0.7%. The Nasdaq Composite was up 1.7%. Advancers led decliners by a 3-2 margin on the NYSE and on the Nasdaq exchange. The reported volume totals were mixed, higher than the prior session on the NYSE and lighter on the Nasdaq exchange. Leadership improved as there were 59 high-ranked companies from the Leaders List that hit new 52-week highs and were listed on the BreakOuts Page, more than triple the total of 18 on the prior session. New 52-week highs totals expanded and solidly outnumbered new 52-week lows totals on both the NYSE and the Nasdaq exchange. New lows on the NYSE were in the single digits for the fifth consecutive session. The major indices are in a confirmed uptrend (M criteria). Any sustainable rally requires a healthy crop of new leaders, so it remains ever-important to see substantial new highs totals. Charts used courtesy of www.stockcharts.com
PICTURED: The Nasdaq Composite Index is consolidating well above its 50-day moving average (DMA) line and the prior high. The tech-heavy index is +17.4% year-to-date.
Stocks finished higher on Monday, as investors anticipated developments on further fiscal stimulus from Washington. Details of the $1 trillion Republican coronavirus relief proposal are expected to be unveiled later this afternoon. The plan would still need to be negotiated with Democrats, with Friday’s expiration of enhanced unemployment benefits looming.
Nine of 11 S&P 500 sectors closed in positive territory with Technology stocks pacing the gains. The Utilities and Financials groups lagged. In corporate news, Moderna (MRNA +9.15%) rose after touting an additional $472 million in U.S. government funding to help support its COVID-19 vaccine candidate’s development. Also in the Health Care space, Biogen (BIIB +5.09%) rose on the heels of a double upgrade by a Wall Street analyst. Elsewhere, Taiwan Semiconductor Manufacturing (TSM +12.65%) rallied after reportedly receiving an order for its 6 nanometer chips from Intel (INTC -2.02%) . In earnings, Hasbro (HAS -7.41%) fell after the toy maker’s quarterly figures missed analyst expectations, pressured by production shutdowns related to coronavirus lockdowns.
Precious metals also garnered attention as COMEX gold closed at an all-time high, nearing the $2,000.00/ounce level as a gauge of the U.S. dollar weakened to its worst point since June 2018. Silver rallied 7.2%, on pace for its best month on record, up nearly 32%.
Treasuries declined, with the yield on the 10-year note up three basis points to 0.61%. On the data front, both durable and capital goods orders increased more than anticipated last month.
|
 Kenneth J. Gruneisen started out as a licensed stockbroker in August 1987, a couple of months prior to the historic stock market crash that took the Dow Jones Industrial Average down -22.6% in a single day. He has published daily fact-based fundamental and technical analysis on high-ranked stocks online for two decades. Through FACTBASEDINVESTING.COM, Kenneth provides educational articles, news, market commentary, and other information regarding proven investment systems that work in good times and bad.
Comments contained in the body of this report are technical opinions only and are not necessarily those of Gruneisen Growth Corp. The material herein has been obtained from sources believed to be reliable and accurate, however, its accuracy and completeness cannot be guaranteed. Our firm, employees, and customers may effect transactions, including transactions contrary to any recommendation herein, or have positions in the securities mentioned herein or options with respect thereto. Any recommendation contained in this report may not be suitable for all investors and it is not to be deemed an offer or solicitation on our part with respect to the purchase or sale of any securities. |
|
 |
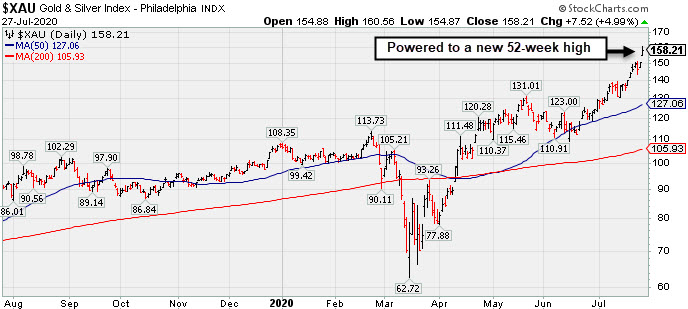
Gold & Silver Index Posts Standout Gain; Tech and Retail Rose
Kenneth J. Gruneisen - Passed the CAN SLIM® Master's Exam
The Retail Index ($RLX +1.05%) posted a gain and the Broker/Dealer Index ($XBD +0.55%) edged higher but the Bank Index ($BKX -1.55%) created a drag on the major indices. The tech sector had a positive bias as the Semiconductor Index ($SOX +3.22%) and Biotech Index ($BTK +2.48%) both outpaced the Networking Index ($NWX +1.35%). Energy-linked shares were mixed as the Oil Services Index ($OSX +1.50%) rose but the Integrated Oil Index ($XOI -0.11%) inched lower.
PICTURED: The Gold & Silver Index ($XAU +5.00%) powered to a new 52-week high and it is up +48% year-to-date.
| Oil Services |
$OSX |
37.93 |
+0.56 |
+1.50% |
-51.55% |
| Integrated Oil |
$XOI |
774.90 |
-0.82 |
-0.11% |
-39.01% |
| Semiconductor |
$SOX |
2,104.32 |
+65.61 |
+3.22% |
+13.77% |
| Networking |
$NWX |
590.62 |
+7.88 |
+1.35% |
+1.24% |
| Broker/Dealer |
$XBD |
284.21 |
+1.55 |
+0.55% |
-2.13% |
| Retail |
$RLX |
3,257.00 |
+33.93 |
+1.05% |
+32.98% |
| Gold & Silver |
$XAU |
158.23 |
+7.54 |
+5.00% |
+47.99% |
| Bank |
$BKX |
74.38 |
-1.17 |
-1.55% |
-34.39% |
| Biotech |
$BTK |
5,913.02 |
+143.22 |
+2.48% |
+16.69% |
|
|
|
 |
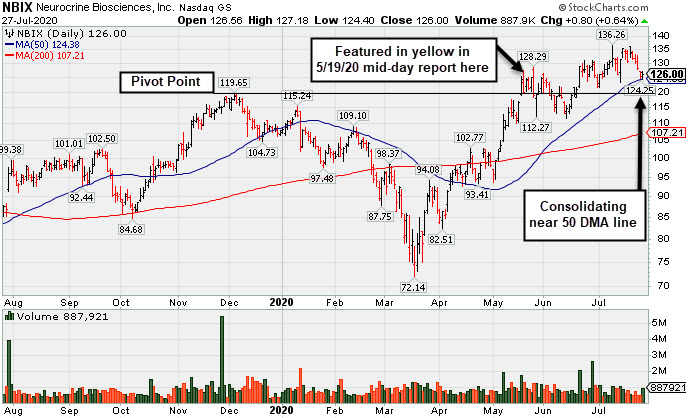
Consolidating Near 50-Day Moving Average; Earnings Report Due
Kenneth J. Gruneisen - Passed the CAN SLIM® Master's Exam
Neurocrine Biosciences (NBIX +$0.80 or +0.64% to $126.00) found support today at its 50-day moving average ($124.38). Its color code was changed to green after rising back above its "max buy" level. Subsequent losses leading to a 50 DMA line violation would trigger a technical sell signal. Prior highs in the $119 area define the next important near-term support to watch on pullbacks.
Fundamentals remain strong. NBIX was last shown in this FSU section on 6/30/20 with an annotated graph under the headline, "Pulled Back Below "Max Buy" Level With Loss on Average Volume" . It was highlighted in yellow with pivot point cited based on its 12/04/20 high plus 10 cents in the 5/19/20 mid-day report (read here). Progress has been limited and choppy since it technically broke out for a new 52-week high (N criteria) on the 5/18/20 with +101% above average volume behind a big gain after a gap up.
Keep in mind that it is due to report Jun '20 quarterly results on 8/03/20. Volume and volatility often increase near earnings news. It reported earnings +545%, +200%, +163%, and +183% in the Jun, Sep, Dec '19 and Mar '20 quarters, well above the +25% minimum guideline (C criteria) versus the year ago periods, respectively. It showed greatly improved sales revenues up +89%, +46%, +86%, and +71% during that same span of quarterly comparisons. After years of losses it reported strong annual earnings (A criteria) results in FY '18 and '19.
There are 92.9 million shares outstanding (S criteria). The number of top-rated funds owning its shares rose from 651 in Jun '19 to 1,008 in Jun '20, a reassuring sign concerning the I criteria. Its current Up/Down Volume ratio of 1.3 is an unbiased indication its shares have been under slight accumulation over the past 50 days. It has an A Timeliness rating and a B Sponsorship Rating. It hails from the strong Medical - Biomed/Biotech industry which is currently rated 16th of the 197 industry groups listed in the newspaper (L criteria). In late April it received approval from the FDA for ONGENTYS, a new medication (N criteria) to help patients with Parkinson's disease better manage motor fluctuations. |
|
|
Color Codes Explained :
Y - Better candidates highlighted by our
staff of experts.
G - Previously featured
in past reports as yellow but may no longer be buyable under the
guidelines.
***Last / Change / Volume data in this table is the closing quote data***
Symbol/Exchange
Company Name
Industry Group |
PRICE |
CHANGE
(%Change) |
Day High |
Volume
(% DAV)
(% 50 day avg vol) |
52 Wk Hi
% From Hi |
Featured
Date |
Price
Featured |
Pivot Featured |
|
Max Buy |
 FTNT
-
NASDAQ
FTNT
-
NASDAQ
Fortinet Inc
Computer Sftwr-Security
|
$136.65
|
+3.61
2.71% |
$136.98
|
673,454
39.66% of 50 DAV
50 DAV is 1,698,000
|
$151.95
-10.07%
|
6/22/2020
|
$142.68
|
PP = $149.79
|
|
MB = $157.28
|
 Most Recent Note - 7/27/2020 6:06:49 PM
G - Its 50 DMA line ($137.68) has been acting as resistance after damaging losses, and a rebound above that important short-term average is needed for its outlook to improve.
>>> FEATURED STOCK ARTICLE : Best Ever Close With Volume-Driven Gain Approaching Pivot Point - 7/8/2020 |
View all notes |
Set NEW NOTE alert |
Company Profile |
SEC
News |
Chart |
Request a new note
C
A
S
I |
CRL
-
NYSE
Charles River Labs Intl
DRUGS - Biotechnology
|
$199.93
|
+7.10
3.68% |
$200.44
|
238,121
61.06% of 50 DAV
50 DAV is 390,000
|
$202.95
-1.49%
|
7/15/2020
|
$192.66
|
PP = $189.95
|
|
MB = $199.45
|
Most Recent Note - 7/27/2020 5:56:43 PM
G - Color code is changed to green after quietly rising and closing above its "max buy" level with today's gain backed by below average volume. The prior high ($189.85 on 6/03/20) defines initial support to watch above its 50 DMA line ($181.12).
>>> FEATURED STOCK ARTICLE : Volume +71% Above Average Behind Breakout - 7/15/2020 |
View all notes |
Set NEW NOTE alert |
Company Profile |
SEC
News |
Chart |
Request a new note
C
A
S
I |
EBS
-
NYSE
Emergent Biosolutions
DRUGS - Biotechnology
|
$94.78
|
+4.91
5.46% |
$94.99
|
869,393
96.28% of 50 DAV
50 DAV is 903,000
|
$107.16
-11.55%
|
7/7/2020
|
$89.47
|
PP = $93.68
|
|
MB = $98.36
|
Most Recent Note - 7/27/2020 5:54:13 PM
Y - Posted a big gain today with near average volume. There was a noted "negative reversal" on 7/20/20 at its all-time high. The next important support to watch is its 50 DMA line ($83.78). Due to report Jun '20 quarterly earnings news on 7/30/20. Volume and volatility often increase near earnings news.
>>> FEATURED STOCK ARTICLE : Impressive Rebound to Hit a New High - 7/9/2020 |
View all notes |
Set NEW NOTE alert |
Company Profile |
SEC
News |
Chart |
Request a new note
C
A
S
I |
NBIX
-
NASDAQ
Neurocrine Biosciences
DRUGS - Biotechnology
|
$126.00
|
+0.80
0.64% |
$127.18
|
887,921
102.65% of 50 DAV
50 DAV is 865,000
|
$136.27
-7.54%
|
5/19/2020
|
$123.71
|
PP = $119.75
|
|
MB = $125.74
|
Most Recent Note - 7/27/2020 5:36:15 PM
G - Color code is changed to green as it rebounded above its "max buy" level. Found prompt support today at its 50 DMA line ($124.38). Subsequent losses leading to a 50 DMA line violation may trigger a technical sell signal. Due to report Jun '20 quarterly earnings results on Monday 8/03/20. See the latest FSU analysis for more details and a new annotated graph.
>>> FEATURED STOCK ARTICLE : Consolidating Near 50-Day Moving Average; Earnings Report Due - 7/27/2020 |
View all notes |
Set NEW NOTE alert |
Company Profile |
SEC
News |
Chart |
Request a new note
C
A
S
I |
BMRN
-
NASDAQ
Biomarin Pharmaceutical
DRUGS - Drug Manufacturers - Other
|
$124.00
|
+1.05
0.85% |
$124.90
|
948,809
62.05% of 50 DAV
50 DAV is 1,529,000
|
$131.95
-6.03%
|
6/17/2020
|
$110.95
|
PP = $112.67
|
|
MB = $118.30
|
Most Recent Note - 7/23/2020 5:49:24 PM
G - Pulled back from its all-time high with light volume behind today's 3rd consecutive loss. It is extended from any sound base. Fundamentals remain strong. Its 50 DMA line ($114.09) and prior high ($112.57) define near-term support levels to watch.
>>> FEATURED STOCK ARTICLE : Hovering Near High With Volume Totals Cooling - 7/10/2020 |
View all notes |
Set NEW NOTE alert |
Company Profile |
SEC
News |
Chart |
Request a new note
C
A
S
I |
Symbol/Exchange
Company Name
Industry Group |
PRICE |
CHANGE
(%Change) |
Day High |
Volume
(% DAV)
(% 50 day avg vol) |
52 Wk Hi
% From Hi |
Featured
Date |
Price
Featured |
Pivot Featured |
|
Max Buy |
AUDC
-
NASDAQ
Audiocodes Ltd
ELECTRONICS - Scientific and Technical Instrum
|
$44.76
|
+3.42
8.27% |
$44.94
|
1,589,363
227.38% of 50 DAV
50 DAV is 699,000
|
$44.90
-0.31%
|
7/17/2020
|
$37.16
|
PP = $40.16
|
|
MB = $42.17
|
Most Recent Note - 7/27/2020
G - Due to report Jun '20 quarterly results on 7/28/20. Volume and volatility often increase near earnings news. Color code is changed to green while rallying above its "max buy" level to challenge its all-time high. Big volume-driven gain on 7/22/20 backed by +182% above average volume triggered a noted technical buy signal. Completed a new Public Offering on 6/08/20.
>>> FEATURED STOCK ARTICLE : Resilient and High-Ranked VOIP Firm Rebounding Near Highs - 7/17/2020 |
View all notes |
Set NEW NOTE alert |
Company Profile |
SEC
News |
Chart |
Request a new note
C
A
S
I |
AMD
-
NASDAQ
Advanced Micro Devices
ELECTRONICS - Semiconductor - Broad Line
|
$68.97
|
-0.43
-0.62% |
$71.63
|
107,456,396
184.20% of 50 DAV
50 DAV is 58,338,000
|
$69.94
-1.39%
|
7/22/2020
|
$61.73
|
PP = $59.10
|
|
MB = $62.06
|
Most Recent Note - 7/27/2020 12:17:50 PM
G - Color code was changed to green after quickly rallying above its "max buy" level with a considerable volume-driven gain on the prior session. Big gain on 7/22/20 backed by +152% above average volume triggered a noted technical buy signal. Prior highs in the $59 area define initial support above its 50 DMA line. See the latest FSU analysis for more details and an annotated graph.
>>> FEATURED STOCK ARTICLE : Pullback After Breakout Gain Backed by +152% Above Average Volume - 7/23/2020 |
View all notes |
Set NEW NOTE alert |
Company Profile |
SEC
News |
Chart |
Request a new note
C
A
S
I |
TREX
-
NYSE
Trex Company Inc
MATERIALS and CONSTRUCTION - General Building Materials
|
$139.00
|
+5.58
4.18% |
$139.98
|
448,704
46.98% of 50 DAV
50 DAV is 955,000
|
$138.72
0.20%
|
6/26/2020
|
$109.05
|
PP = $132.94
|
|
MB = $139.59
|
Most Recent Note - 7/27/2020 5:59:41 PM
Y - Posted a big gain with light volume and hit a new all-time high while approaching its "max buy" level. Gains above the pivot point have not had the +40% above average volume necessary to trigger a proper new (or add-on) technical buy signal. Important near-term support is at its 50 DMA line ($124.68). Fundamentals remain strong.
>>> FEATURED STOCK ARTICLE : Quietly Perched Near All-Time High After Forming a New Base - 7/6/2020 |
View all notes |
Set NEW NOTE alert |
Company Profile |
SEC
News |
Chart |
Request a new note
C
A
S
I |
NFLX
-
NASDAQ
Netflix Inc
SPECIALTY RETAIL - Music and Video Stores
|
$495.65
|
+15.20
3.16% |
$496.92
|
7,823,458
99.09% of 50 DAV
50 DAV is 7,895,000
|
$575.37
-13.86%
|
5/14/2020
|
$441.95
|
PP = $449.62
|
|
MB = $472.10
|
Most Recent Note - 7/23/2020 5:52:02 PM
G - Prior highs in the $458 area define near-term support coinciding with its 50 DMA line ($458.79). Pulling back toward its "max buy" level after getting very extended from the prior base. Consolidating after reporting Jun '20 earnings +165% on +25% sales revenues versus the year ago period.
>>> FEATURED STOCK ARTICLE : Powered to New High on Prior Session With Volume Driven Gain - 7/2/2020 |
View all notes |
Set NEW NOTE alert |
Company Profile |
SEC
News |
Chart |
Request a new note
C
A
S
I |
CHGG
-
NYSE
Chegg Inc
Consumer Svcs-Education
|
$74.30
|
+0.88
1.20% |
$75.15
|
1,110,490
32.22% of 50 DAV
50 DAV is 3,447,000
|
$79.09
-6.06%
|
6/17/2020
|
$63.71
|
PP = $68.08
|
|
MB = $71.48
|
Most Recent Note - 7/27/2020 6:04:44 PM
G - Extended from any sound base. Prior high in the $68 area defines initial support to watch above its 50 DMA line ($66.06) where any losses leading to violations would raise concerns and trigger technical sell signals.
>>> FEATURED STOCK ARTICLE : Negative Reversal After Recently Wedging into New High Territory - 7/13/2020 |
View all notes |
Set NEW NOTE alert |
Company Profile |
SEC
News |
Chart |
Request a new note
C
A
S
I |
Symbol/Exchange
Company Name
Industry Group |
PRICE |
CHANGE
(%Change) |
Day High |
Volume
(% DAV)
(% 50 day avg vol) |
52 Wk Hi
% From Hi |
Featured
Date |
Price
Featured |
Pivot Featured |
|
Max Buy |
LGIH
-
NASDAQ
L G I Homes Inc
Bldg-Resident/Comml
|
$116.89
|
+2.96
2.60% |
$118.21
|
273,946
74.85% of 50 DAV
50 DAV is 366,000
|
$120.54
-3.03%
|
7/7/2020
|
$99.19
|
PP = $95.82
|
|
MB = $100.61
|
Most Recent Note - 7/22/2020 5:49:46 PM
G - Hit another new all-time high with today's gain backed by average volume, getting more extended from the previously noted base. Prior highs in the $95 area define initial support to watch on pullbacks.
>>> FEATURED STOCK ARTICLE : Breakout to New High Backed by 53% Above Average Volume - 7/7/2020 |
View all notes |
Set NEW NOTE alert |
Company Profile |
SEC
News |
Chart |
Request a new note
C
A
S
I |
NOW
-
NYSE
Servicenow Inc
Computer Sftwr-Enterprse
|
$433.81
|
+8.62
2.03% |
$436.16
|
954,390
55.55% of 50 DAV
50 DAV is 1,718,000
|
$454.70
-4.59%
|
4/30/2020
|
$343.05
|
PP = $363.05
|
|
MB = $381.20
|
Most Recent Note - 7/22/2020 5:42:19 PM
G - Perched near its all-time high following a big gain on 7/20/20 backed by +72% above average volume. It has not formed a sound base. Its 50 DMA line ($398) defines important near-term support to watch where a violation may trigger a technical sell signal. See the latest FSU analysis for more details and a new annotated graph.
>>> FEATURED STOCK ARTICLE : Perched Near All-Time High With Earnings News Due Next Week - 7/22/2020 |
View all notes |
Set NEW NOTE alert |
Company Profile |
SEC
News |
Chart |
Request a new note
C
A
S
I |
TEAM
-
NASDAQ
Atlassian Corp Plc Cl A
Comp Sftwr-Spec Enterprs
|
$184.51
|
+0.17
0.09% |
$187.34
|
2,244,231
118.43% of 50 DAV
50 DAV is 1,895,000
|
$198.41
-7.01%
|
7/7/2020
|
$190.44
|
PP = $191.82
|
|
MB = $201.41
|
Most Recent Note - 7/24/2020 7:23:26 PM
Y - Pulled back toward its its 50 DMA line ($181.10) with a loss today on light volume. Recent rebound above its 50 DMA line helped its outlook to improve and its color code was changed to yellow. Recent gains above the pivot point lacked the +40% above average volume necessary to trigger a convincing new (or add-on) technical buy signal. Confirming volume-driven gains would be a reassuring sign of fresh institutional buying demand. The prior low ($169.11 on 7/14/20) defines the next important support below its 50 DMA line. Keep in mind it is due to report earnings news on 7/30/20. See the latest FSU analysis for more details and a new annotated graph.
>>> FEATURED STOCK ARTICLE : Consolidating Near High With Earnings News Due Soon - 7/24/2020 |
View all notes |
Set NEW NOTE alert |
Company Profile |
SEC
News |
Chart |
Request a new note
C
A
S
I |
TTD
-
NASDAQ
The Trade Desk Inc Cl A
Comml Svcs-Advertising
|
$432.16
|
+6.09
1.43% |
$434.24
|
894,340
51.67% of 50 DAV
50 DAV is 1,731,000
|
$475.67
-9.15%
|
6/3/2020
|
$340.61
|
PP = $327.35
|
|
MB = $343.72
|
Most Recent Note - 7/23/2020 5:39:38 PM
G - Retreated from near its all-time high with today's loss on higher (but below average) volume. Very extended from any sound base, and its 50 DMA line ($378) defines near-term support to watch.
>>> FEATURED STOCK ARTICLE : Rebounded Near All-Time High With Gain Backed by Light Volume - 7/20/2020 |
View all notes |
Set NEW NOTE alert |
Company Profile |
SEC
News |
Chart |
Request a new note
C
A
S
I |
DOCU
-
NASDAQ
Docusign Inc
Computer Sftwr-Enterprse
|
$196.27
|
+5.32
2.79% |
$197.80
|
2,333,153
41.32% of 50 DAV
50 DAV is 5,647,000
|
$217.00
-9.55%
|
6/10/2020
|
$149.73
|
PP = $152.10
|
|
MB = $159.71
|
Most Recent Note - 7/24/2020 7:26:05 PM
G - Gapped down today as it suffered another loss on light volume. It is very extended from any sound base. Its 50 DMA line ($164.50) defines near-term support to watch. DOCU is now priced +88% above its 200 DMA price, and it is taught in the Certification that a stock trading +70-100% or more above the 200 DMA is to be recognized as a "sell signal".
>>> FEATURED STOCK ARTICLE : Rally From Ascending Base Leaves Stock Very Extended - 7/1/2020 |
View all notes |
Set NEW NOTE alert |
Company Profile |
SEC
News |
Chart |
Request a new note
C
A
S
I |
Symbol/Exchange
Company Name
Industry Group |
PRICE |
CHANGE
(%Change) |
Day High |
Volume
(% DAV)
(% 50 day avg vol) |
52 Wk Hi
% From Hi |
Featured
Date |
Price
Featured |
Pivot Featured |
|
Max Buy |
PING
-
NYSE
Ping Identity Hldg Corp
Computer Sftwr-Security
|
$33.60
|
+0.83
2.53% |
$33.62
|
626,491
38.94% of 50 DAV
50 DAV is 1,609,000
|
$35.79
-6.12%
|
6/1/2020
|
$29.24
|
PP = $29.90
|
|
MB = $31.40
|
Most Recent Note - 7/23/2020 5:46:22 PM
G - Had "negative reversals" on Tuesday and again today for losses on light volume. Its 50 DMA line ($30.18) and prior highs in the $29 area define important near-term support. It is extended from any sound base. Completed Secondary Offerings on 7/09/20 and 5/15/20.
>>> FEATURED STOCK ARTICLE : Consolidating Above 50-Day Moving Average Following Secondary - 7/16/2020 |
View all notes |
Set NEW NOTE alert |
Company Profile |
SEC
News |
Chart |
Request a new note
C
A
S
I |
AAXN
-
NASDAQ
Axon Enterprise Inc
Security/Sfty
|
$86.44
|
+0.82
0.96% |
$87.40
|
519,115
41.07% of 50 DAV
50 DAV is 1,264,000
|
$104.90
-17.60%
|
5/8/2020
|
$84.86
|
PP = $90.20
|
|
MB = $94.71
|
Most Recent Note - 7/22/2020 5:45:36 PM
G - Color code is changed to green after slumping to a close below its 50 DMA line ($89.89) with today's loss on below average volume. More damaging losses below the prior low ($887.75 on 7/14/20) would raise serious concerns and trigger a technical sell signal. Completed a new Public Offering on 6/17/20.
>>> FEATURED STOCK ARTICLE : Managed Positive Reversal After Testing 50-Day Moving Average - 7/14/2020 |
View all notes |
Set NEW NOTE alert |
Company Profile |
SEC
News |
Chart |
Request a new note
C
A
S
I |
ZEN
-
NYSE
Zendesk Inc
Computer Sftwr-Enterprse
|
$96.31
|
+2.19
2.33% |
$96.33
|
1,621,903
77.01% of 50 DAV
50 DAV is 2,106,000
|
$97.67
-1.39%
|
7/21/2020
|
$94.29
|
PP = $94.97
|
|
MB = $99.72
|
Most Recent Note - 7/27/2020 6:02:11 PM
Y - Posted a gain today with light volume for a best-ever close. Due to report Jun '20 quarterly earnings news on 7/30/20. Volume and volatility often increase near earnings news.
>>> FEATURED STOCK ARTICLE : Pullback Below Pivot Point Following Breakout Gain - 7/21/2020 |
View all notes |
Set NEW NOTE alert |
Company Profile |
SEC
News |
Chart |
Request a new note
C
A
S
I |
|
|
|
THESE ARE NOT BUY RECOMMENDATIONS!
Comments contained in the body of this report are technical
opinions only. The material herein has been obtained
from sources believed to be reliable and accurate, however,
its accuracy and completeness cannot be guaranteed.
This site is not an investment advisor, hence it does
not endorse or recommend any securities or other investments.
Any recommendation contained in this report may not
be suitable for all investors and it is not to be deemed
an offer or solicitation on our part with respect to
the purchase or sale of any securities. All trademarks,
service marks and trade names appearing in this report
are the property of their respective owners, and are
likewise used for identification purposes only.
This report is a service available
only to active Paid Premium Members.
You may opt-out of receiving report notifications
at any time. Questions or comments may be submitted
by writing to Premium Membership Services 665 S.E. 10 Street, Suite 201 Deerfield Beach, FL 33441-5634 or by calling 1-800-965-8307
or 954-785-1121.
|
|
|