***Last / Change / Volume data in this table is the closing quote data***
Symbol/Exchange
Company Name
Industry Group |
PRICE |
CHANGE
(%Change) |
Day High |
Volume
(% DAV)
(% 50 day avg vol) |
52 Wk Hi
% From Hi |
Featured
Date |
Price
Featured |
Pivot Featured |
|
Max Buy |
 NSP
-
NYSE
NSP
-
NYSE
Insperity Inc
Comml Svcs-Outsourcing
|
$141.30
|
+2.81
2.03% |
$141.93
|
393,282
134.69% of 50 DAV
50 DAV is 292,000
|
$139.27
1.46%
|
7/19/2019
|
$136.39
|
PP = $132.60
|
|
MB = $139.23
|
 Most Recent Note - 7/24/2019 3:58:43 PM
G - Color code is changed to green after rising above its "max buy" level with lighter volume behind today's 6th consecutive gain for a new all-time high. Recently reported earnings +40% on +14% sales revenues for the Mar '19 quarter.
>>> FEATURED STOCK ARTICLE : Insperity Hit New High With +55% Above Average Volume - 7/19/2019 |
View all notes |
Set NEW NOTE alert |
Company Profile |
SEC
News |
Chart |
Request a new note
C
A
S
I |
SPSC
-
NASDAQ
S P S Commerce Inc
COMPUTER SOFTWARE and SERVICES - Application Software
|
$103.36
|
+1.55
1.52% |
$103.95
|
77,201
59.39% of 50 DAV
50 DAV is 130,000
|
$115.00
-10.12%
|
6/7/2019
|
$107.72
|
PP = $115.10
|
|
MB = $120.86
|
Most Recent Note - 7/22/2019 1:47:27 PM
G - Met resistance at its 50 DMA line ($103.79) which is now downward sloping. A rebound above the 50 DMA line is needed to help its outlook improve. Subsequent volume-driven gains above the pivot point are needed to trigger a new (or add-on) technical buy signal. Faces some resistance due to overhead supply up to the $115 level. Fundamentals remain strong.
>>> FEATURED STOCK ARTICLE : Recently Sputtering Below 50-Day Moving Average - 7/9/2019 |
View all notes |
Set NEW NOTE alert |
Company Profile |
SEC
News |
Chart |
Request a new note
C
A
S
I |
EPAM
-
NYSE
Epam Systems Inc
COMPUTER SOFTWARE and SERVICES - Information Technology Service
|
$196.91
|
+1.45
0.74% |
$196.91
|
253,255
49.56% of 50 DAV
50 DAV is 511,000
|
$198.69
-0.90%
|
5/9/2019
|
$169.25
|
PP = $180.55
|
|
MB = $189.58
|
Most Recent Note - 7/24/2019 4:25:23 PM
G - Perched at its 52-week high with volume-totals cooling after getting very extended from any sound base. Prior highs in the $179-180 area define initial support to watch above its 50 DMA line ($177.69).
>>> FEATURED STOCK ARTICLE : Winning Streak Leaves IT Firm Extended From Prior Base - 7/12/2019 |
View all notes |
Set NEW NOTE alert |
Company Profile |
SEC
News |
Chart |
Request a new note
C
A
S
I |
AUDC
-
NASDAQ
Audiocodes Ltd
ELECTRONICS - Scientific and Technical Instrum
|
$17.83
|
-0.26
-1.44% |
$18.07
|
430,255
277.58% of 50 DAV
50 DAV is 155,000
|
$18.45
-3.36%
|
7/15/2019
|
$17.10
|
PP = $17.54
|
|
MB = $18.42
|
Most Recent Note - 7/24/2019 11:48:25 AM
Y - Pulling back today. Reported earnings +57% on +14% sales revenues for the Jun '19 quarter, continuing its strong earnings track record. Big gain and strong close above the pivot point was backed by 11 times average volume clinching a convincing technical buy signal on the prior session. Its 50 DMA line ($15.54) defines important near-term support to watch on pullbacks.
>>> FEATURED STOCK ARTICLE : Posted a Gain With Average Volume for Best Ever Close - 7/15/2019 |
View all notes |
Set NEW NOTE alert |
Company Profile |
SEC
News |
Chart |
Request a new note
C
A
S
I |
ENV
-
NYSE
Envestnet Inc
FINANCIAL SERVICES - Diversified Investments
|
$73.16
|
+1.02
1.41% |
$73.20
|
656,890
261.71% of 50 DAV
50 DAV is 251,000
|
$73.23
-0.10%
|
3/15/2019
|
$66.05
|
PP = $64.90
|
|
MB = $68.15
|
Most Recent Note - 7/24/2019 4:18:19 PM
G - Posted a volume-driven gain today challenging its 52-week high. Its 50 DMA ($69.26) line defines support above prior lows in the $65-66 area. Fundamental concerns were raised after it reported earnings +5% on +1% sales revenues for the Mar '19 quarter, below the +25% minimum earnings guideline (C criteria).
>>> FEATURED STOCK ARTICLE : Rebounded Above 50-Day Moving Average Line - 7/2/2019 |
View all notes |
Set NEW NOTE alert |
Company Profile |
SEC
News |
Chart |
Request a new note
C
A
S
I |
Symbol/Exchange
Company Name
Industry Group |
PRICE |
CHANGE
(%Change) |
Day High |
Volume
(% DAV)
(% 50 day avg vol) |
52 Wk Hi
% From Hi |
Featured
Date |
Price
Featured |
Pivot Featured |
|
Max Buy |
LHCG
-
NASDAQ
L H C Group Inc
HEALTH SERVICES - Home Health Care
|
$123.77
|
+1.42
1.16% |
$124.65
|
145,168
68.15% of 50 DAV
50 DAV is 213,000
|
$128.31
-3.54%
|
7/1/2019
|
$110.94
|
PP = $122.20
|
|
MB = $128.31
|
Most Recent Note - 7/23/2019 5:43:47 PM
Y - Stubbornly holding its ground with volume totals cooling after a noted "negative reversal" on 7/15/19 at its all-time high. Subsequent gains above its pivot point backed by at least +40% above average volume may trigger a new (or add-on) technical buy signal. Its 50 DMA line ($118.01) defines near-term support above recent lows. Fundamentals remain strong. See the latest FSU analysis for more details and an annotated graph.
>>> FEATURED STOCK ARTICLE : Consolidating Following a Negative Reversal at High - 7/22/2019 |
View all notes |
Set NEW NOTE alert |
Company Profile |
SEC
News |
Chart |
Request a new note
C
A
S
I |
ENSG
-
NASDAQ
Ensign Group Inc
HEALTH SERVICES - Long-Term Care Facilities
|
$59.00
|
+0.01
0.02% |
$59.38
|
361,714
128.27% of 50 DAV
50 DAV is 282,000
|
$59.42
-0.71%
|
4/30/2019
|
$51.46
|
PP = $53.30
|
|
MB = $55.97
|
Most Recent Note - 7/24/2019 4:24:08 PM
G - Churned above average volume today while remaining perched at its all-time high. Its 50 DMA line ($56.27) and recent low ($52.34 on 5/31/19) define near-term support to watch. Bullish action has continued since 5/06/19 reporting earnings +22% on +12% sales revenues for the Mar '19 quarter, below the +25% minimum earnings guideline (C criteria).
>>> FEATURED STOCK ARTICLE : Nursing Facility Operator Touched New High - 7/1/2019 |
View all notes |
Set NEW NOTE alert |
Company Profile |
SEC
News |
Chart |
Request a new note
C
A
S
I |
CHDN
-
NASDAQ
Churchill Downs Inc
LEISURE - Gaming Activities
|
$120.98
|
+2.26
1.90% |
$121.46
|
416,186
164.50% of 50 DAV
50 DAV is 253,000
|
$118.89
1.76%
|
7/22/2019
|
$118.45
|
PP = $118.89
|
|
MB = $124.83
|
Most Recent Note - 7/24/2019 4:21:58 PM
Y - Rallied from a previously noted advanced "3-weeks tight" base and today's gain above the pivot point was backed by at least +40% above average volume to trigger a new (or add-on) technical buy signal. Its 50 DMA line ($109.72) and prior low ($108.57 on 6/25/19) define important near-term support to watch on pullbacks.
>>> FEATURED STOCK ARTICLE : Volume Light While Hovering at Record High - 7/16/2019 |
View all notes |
Set NEW NOTE alert |
Company Profile |
SEC
News |
Chart |
Request a new note
C
A
S
I |
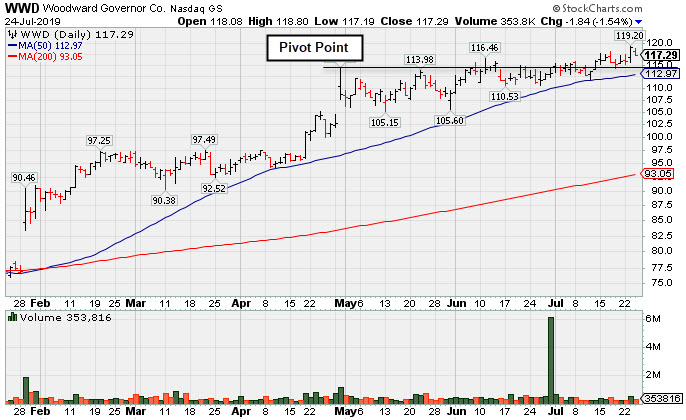
WWD
-
NASDAQ
Woodward Inc
MANUFACTURING - Diversified Machinery
|
$117.29
|
-1.84
-1.54% |
$118.80
|
353,816
69.24% of 50 DAV
50 DAV is 511,000
|
$119.20
-1.60%
|
6/18/2019
|
$112.34
|
PP = $114.65
|
|
MB = $120.38
|
Most Recent Note - 7/24/2019 5:38:18 PM
Y - Pulled back today with lighter volume after hitting a new all-time high on the prior session with near average volume. Recently found support above its 50 DMA line ($112.98). Subsequent gains for new highs backed by at least +40% above average volume may clinch a convincing technical buy signal. Fundamentals remain strong. Due to report earnings news on 7/30/19. See the latest FSU analysis for more details and a new annotated graph.
>>> FEATURED STOCK ARTICLE : Perched Near All-Time High After Gains Lacking Great Volume - 7/24/2019 |
View all notes |
Set NEW NOTE alert |
Company Profile |
SEC
News |
Chart |
Request a new note
C
A
S
I |
LULU
-
NASDAQ
Lululemon Athletica
MANUFACTURING - Textile Manufacturing
|
$192.21
|
+3.14
1.66% |
$192.42
|
1,064,226
49.02% of 50 DAV
50 DAV is 2,171,000
|
$191.44
0.40%
|
6/13/2019
|
$174.48
|
PP = $179.60
|
|
MB = $188.58
|
Most Recent Note - 7/24/2019 4:08:12 PM
G - Extended from the prior base, it posted a 2nd consecutive gain with light volume and hit a new all-time high. Its 50 DMA line ($178.78) defines important near-term support. Reported Apr '19 quarterly earnings +35% on +20% sales revenues versus the ear ago period. See the latest FSU analysis for more details and a new annotated graph.
>>> FEATURED STOCK ARTICLE : Quietly Hovering at All-Time High - 7/17/2019 |
View all notes |
Set NEW NOTE alert |
Company Profile |
SEC
News |
Chart |
Request a new note
C
A
S
I |
Symbol/Exchange
Company Name
Industry Group |
PRICE |
CHANGE
(%Change) |
Day High |
Volume
(% DAV)
(% 50 day avg vol) |
52 Wk Hi
% From Hi |
Featured
Date |
Price
Featured |
Pivot Featured |
|
Max Buy |
ULTA
-
NASDAQ
Ulta Beauty Inc
SPECIALTY RETAIL - Specialty Retail, Other
|
$352.94
|
+0.95
0.27% |
$353.17
|
524,312
68.54% of 50 DAV
50 DAV is 765,000
|
$368.83
-4.31%
|
3/15/2019
|
$341.27
|
PP = $322.59
|
|
MB = $338.72
|
Most Recent Note - 7/22/2019 2:20:46 PM
G - Pulling back from its all-time high hit last week. Its 50 DMA line ($345) defines near-term support to watch. Reported earnings +17% on +13% sales revenues for the Apr '19 quarter, below the +25% minimum earnings guideline (C criteria), raising fundamental concerns.
>>> FEATURED STOCK ARTICLE : Stalled After Recently Wedging to New Record High - 7/5/2019 |
View all notes |
Set NEW NOTE alert |
Company Profile |
SEC
News |
Chart |
Request a new note
C
A
S
I |
CHGG
-
NYSE
Chegg Inc
Consumer Svcs-Education
|
$43.51
|
+0.88
2.06% |
$43.55
|
939,513
67.20% of 50 DAV
50 DAV is 1,398,000
|
$45.19
-3.72%
|
7/8/2019
|
$44.11
|
PP = $41.79
|
|
MB = $43.88
|
Most Recent Note - 7/24/2019 4:14:05 PM
Y - Color code is changed to yellow after recently pulling back below its "max buy" level. Posted a gain today with very light volume. Prior highs in the $40-41 area define initial support to watch on pullbacks.
>>> FEATURED STOCK ARTICLE : Tallied a Big Volume-Driven Breakout Gain for a New High - 7/8/2019 |
View all notes |
Set NEW NOTE alert |
Company Profile |
SEC
News |
Chart |
Request a new note
C
A
S
I |
ESNT
-
NYSE
Essent Group Ltd
Finance-MrtgandRel Svc
|
$48.13
|
+0.92
1.95% |
$48.22
|
454,300
75.97% of 50 DAV
50 DAV is 598,000
|
$50.51
-4.71%
|
3/18/2019
|
$45.84
|
PP = $45.06
|
|
MB = $47.31
|
Most Recent Note - 7/24/2019 5:39:48 PM
G - Posted a gain today on light volume and rebounded to close above its 50 DMA line ($47.91). Some resistance remains due to overhead supply up to the $50 level. Fundamental concerns remain since it reported earnings +15% on +20% sales revenues for the Mar '19 quarter, below the +25% minimum earnings guideline (C criteria).
>>> FEATURED STOCK ARTICLE : Rebounded Above 50 Day Moving Average After Violation - 7/3/2019 |
View all notes |
Set NEW NOTE alert |
Company Profile |
SEC
News |
Chart |
Request a new note
C
A
S
I |
NOW
-
NYSE
Servicenow Inc
Computer Sftwr-Enterprse
|
$297.21
|
+6.20
2.13% |
$297.61
|
2,532,124
164.53% of 50 DAV
50 DAV is 1,539,000
|
$303.17
-1.97%
|
4/22/2019
|
$242.64
|
PP = $251.75
|
|
MB = $264.34
|
Most Recent Note - 7/24/2019 4:03:53 PM
G - Posted a gain today with above average volume, hovering near its all-time high, extended from any sound base. Its 50 DMA line ($279.59) defines near-term support to watch. Recently reported earnings +20% on +34% sales revenues for the Mar '19 quarter, below the +25% minimum earnings guideline (C criteria), raising fundamental concerns.
>>> FEATURED STOCK ARTICLE : Pulling Back After Wedging to New Highs - 6/26/2019 |
View all notes |
Set NEW NOTE alert |
Company Profile |
SEC
News |
Chart |
Request a new note
C
A
S
I |
VEEV
-
NYSE
Veeva Systems Inc Cl A
Computer Sftwr-Medical
|
$166.06
|
+0.33
0.20% |
$167.08
|
2,545,232
162.53% of 50 DAV
50 DAV is 1,566,000
|
$176.90
-6.13%
|
5/30/2019
|
$154.32
|
PP = $145.80
|
|
MB = $153.09
|
Most Recent Note - 7/24/2019 12:33:27 PM
G - Enduring mild distributional pressure while consolidating near its all-time high, extended from any sound base. Its 50 DMA line ($160) defines near-term support above the prior low ($155 on 6/27/19). Reported earnings +52% on +25% sales revenues for the Apr '19 quarter, marking its 5th strong quarter with earnings above the +25% minimum guideline (C criteria).
>>> FEATURED STOCK ARTICLE : Halted Slide After 4 Volume-Driven Losses From High - 6/27/2019 |
View all notes |
Set NEW NOTE alert |
Company Profile |
SEC
News |
Chart |
Request a new note
C
A
S
I |
Symbol/Exchange
Company Name
Industry Group |
PRICE |
CHANGE
(%Change) |
Day High |
Volume
(% DAV)
(% 50 day avg vol) |
52 Wk Hi
% From Hi |
Featured
Date |
Price
Featured |
Pivot Featured |
|
Max Buy |
PAYC
-
NYSE
Paycom Software Inc
COMPUTER SOFTWARE and SERVICES - Application Software
|
$235.13
|
+3.24
1.40% |
$235.81
|
464,844
65.47% of 50 DAV
50 DAV is 710,000
|
$246.85
-4.75%
|
2/6/2019
|
$171.66
|
PP = $164.18
|
|
MB = $172.39
|
Most Recent Note - 7/22/2019 1:34:47 PM
G - Extended from any sound base, consolidating after wedging into new high territory with recent gains lacking great volume conviction. Its 50 DMA line ($221.75) defines near-term support to watch Reported earnings +25% on +30% sales revenues for the Mar '19 quarter.
>>> FEATURED STOCK ARTICLE : Perched Near High Extended From Any Sound Base - 6/28/2019 |
View all notes |
Set NEW NOTE alert |
Company Profile |
SEC
News |
Chart |
Request a new note
C
A
S
I |
PYPL
-
NASDAQ
Paypal Holdings Inc
Finance-CrdtCard/PmtPr
|
$121.30
|
+1.08
0.90% |
$121.33
|
7,897,034
149.62% of 50 DAV
50 DAV is 5,278,000
|
$121.48
-0.15%
|
1/24/2019
|
$92.56
|
PP = $93.80
|
|
MB = $98.49
|
Most Recent Note - 7/23/2019 5:47:20 PM
G - Due to report Jun '19 quarterly earnings news after the close on Wednesday, July 24th. Volume and volatility often increase near earnings news. It has been quietly hovering near its all-time high. Did not form a sound base but wedged higher in recent weeks with gains lacking volume conviction. See the latest FSU analysis for more details and a new annotated graph.
>>> FEATURED STOCK ARTICLE : Perched Near Record High Ahead of Earnings News - 7/23/2019 |
View all notes |
Set NEW NOTE alert |
Company Profile |
SEC
News |
Chart |
Request a new note
C
A
S
I |
PLNT
-
NYSE
Planet Fitness Inc Cl A
Leisure-Services
|
$76.64
|
+2.10
2.82% |
$77.02
|
1,126,253
72.90% of 50 DAV
50 DAV is 1,545,000
|
$81.90
-6.42%
|
11/7/2018
|
$57.10
|
PP = $55.45
|
|
MB = $58.22
|
Most Recent Note - 7/24/2019 4:01:53 PM
G - Gain today lacked volume conviction as it rebounded near its 50 DMA line ($76.73). Faces near-term resistance up to the $81 level. Fundamentals remain strong.
>>> FEATURED STOCK ARTICLE : Undercut 50-Day Moving Average With Volume Behind Losses - 6/21/2019 |
View all notes |
Set NEW NOTE alert |
Company Profile |
SEC
News |
Chart |
Request a new note
C
A
S
I |
BLD
-
NYSE
Topbuild Corp
Bldg-Constr Prds/Misc
|
$81.17
|
+1.85
2.33% |
$81.35
|
154,430
49.82% of 50 DAV
50 DAV is 310,000
|
$86.96
-6.66%
|
5/17/2019
|
$82.19
|
PP = $87.31
|
|
MB = $91.68
|
Most Recent Note - 7/24/2019 4:00:15 PM
Y - Rebounding above its 50 DMA line ($80.81) with today's gain on light volume. The next support is at the recent low ($75.89 on 6/19/19). Sputtering after challenging its all-time high on 7/12/19 with its early gain. Subsequent gains above the pivot point backed by at least +40% above average volume may trigger a technical buy signal. Fundamentals remain strong.
>>> FEATURED STOCK ARTICLE : Found Support at 50-Day Moving Averge Line - 6/20/2019 |
View all notes |
Set NEW NOTE alert |
Company Profile |
SEC
News |
Chart |
Request a new note
C
A
S
I |
TEAM
-
NASDAQ
Atlassian Corp Plc Cl A
Comp Sftwr-Spec Enterprs
|
$135.35
|
+1.29
0.96% |
$136.91
|
1,143,144
92.64% of 50 DAV
50 DAV is 1,234,000
|
$143.68
-5.80%
|
5/24/2019
|
$129.52
|
PP = $132.09
|
|
MB = $138.69
|
Most Recent Note - 7/22/2019 1:50:02 PM
Y - Color code is changed to yellow after pulling back below its "max buy" level. The 50 DMA line ($130.63) and prior low ($123.43 on 6/25/19) define important near-term support to watch. Due to report earnings news on 7/25/19. Volume and volatility often increase near earnings news.
>>> FEATURED STOCK ARTICLE : Perched at High After Wedging into New High Territory - 6/24/2019 |
View all notes |
Set NEW NOTE alert |
Company Profile |
SEC
News |
Chart |
Request a new note
C
A
S
I |
Symbol/Exchange
Company Name
Industry Group |
PRICE |
CHANGE
(%Change) |
Day High |
Volume
(% DAV)
(% 50 day avg vol) |
52 Wk Hi
% From Hi |
Featured
Date |
Price
Featured |
Pivot Featured |
|
Max Buy |
UPLD
-
NASDAQ
Upland Software Inc
Computer Sftwr-Enterprse
|
$45.93
|
+0.36
0.79% |
$46.12
|
271,535
58.39% of 50 DAV
50 DAV is 465,000
|
$54.87
-16.29%
|
6/10/2019
|
$53.30
|
PP = $50.74
|
|
MB = $53.28
|
Most Recent Note - 7/23/2019 5:34:33 PM
G - Toda it quietly slumped further below its 50 DMA line ($47.36) which has been acting as resistance. A rebound above the 50 DMA line is needed for its outlook to improve. Completed a new Public Offering on 5/08/19. Quarterly comparisons through Mar '19 have shown impressive sales revenues growth and greatly improved earnings increases above the +25% minimum guideline (C criteria).
>>> FEATURED STOCK ARTICLE : Consolidating Near 50-Day Average After Slump Into Prior Base - 7/10/2019 |
View all notes |
Set NEW NOTE alert |
Company Profile |
SEC
News |
Chart |
Request a new note
C
A
S
I |
GLOB
-
NYSE
Globant SA
Computer-Tech Services
|
$105.68
|
+1.35
1.29% |
$106.00
|
285,781
66.77% of 50 DAV
50 DAV is 428,000
|
$109.78
-3.73%
|
2/15/2019
|
$69.35
|
PP = $70.00
|
|
MB = $73.50
|
Most Recent Note - 7/24/2019 4:05:42 PM
G - Stubbornly holding its ground near its all-time. Wedged higher with recent gains lacking great volume conviction, and it is very extended from any sound base. Its 50 DMA line ($97.94) defines important support to watch on pullbacks. Fundamentals remain strong.
>>> FEATURED STOCK ARTICLE : Extended From Any Sound Base After Wedging Higher - 7/11/2019 |
View all notes |
Set NEW NOTE alert |
Company Profile |
SEC
News |
Chart |
Request a new note
C
A
S
I |
TTD
-
NASDAQ
The Trade Desk Inc Cl A
Comml Svcs-Advertising
|
$248.38
|
+2.95
1.20% |
$248.89
|
1,266,781
83.78% of 50 DAV
50 DAV is 1,512,000
|
$258.00
-3.73%
|
7/18/2019
|
$240.61
|
PP = $258.10
|
|
MB = $271.01
|
Most Recent Note - 7/22/2019 2:04:04 PM
Y - Challenging prior high closes with today's big gain lacking great volume conviction. Subsequent gains above the pivot point with at least +40% above average volume may trigger a technical buy signal. Its 50 DMA line ($225.88) and prior low ($223.77 on 6/26/19) define near-term support to watch. Reported earnings +44% on +41% sales revenues for the Mar '19 quarter, continuing its strong earnings track record.
>>> FEATURED STOCK ARTICLE : Endured Distributional Pressure While Building on New Base - 7/18/2019 |
View all notes |
Set NEW NOTE alert |
Company Profile |
SEC
News |
Chart |
Request a new note
C
A
S
I |
PAGS
-
NYSE
Pagseguro Digital Cl A
Finance-CrdtCard/PmtPr
|
$46.28
|
-0.54
-1.15% |
$46.60
|
3,255,786
142.17% of 50 DAV
50 DAV is 2,290,000
|
$48.43
-4.44%
|
6/25/2019
|
$37.69
|
PP = $40.07
|
|
MB = $42.07
|
Most Recent Note - 7/22/2019 12:57:40 PM
G - Getting more extended from the prior base, hitting yet another new all-time high today while adding to an impressive spurt of gains. Prior high defines initial support to watch in the $40 area above its 50 DMA line ($36).
>>> FEATURED STOCK ARTICLE : Brazilian Payment Tech Firm Perched Near High - 6/25/2019 |
View all notes |
Set NEW NOTE alert |
Company Profile |
SEC
News |
Chart |
Request a new note
C
A
S
I |