You are not logged in.
This means you
CAN ONLY VIEW reports that were published prior to Friday, February 16, 2024.
You
MUST UPGRADE YOUR MEMBERSHIP if you want to see any current reports.
AFTER MARKET UPDATE - THURSDAY, JULY 23RD, 2020
Previous After Market Report Next After Market Report >>>
|
|
|
|
DOW |
-353.51 |
26,652.33 |
-1.31% |
|
Volume |
820,602,104 |
-1% |
|
Volume |
4,427,076,000 |
+9% |
|
NASDAQ |
-242.24 |
10,463.89 |
-2.26% |
|
Advancers |
1,411 |
48% |
|
Advancers |
1,234 |
39% |
|
S&P 500 |
-40.36 |
3,235.66 |
-1.23% |
|
Decliners |
1,508 |
52% |
|
Decliners |
1,960 |
61% |
|
Russell 2000 |
+0.06 |
1,490.20 |
+0.00% |
|
52 Wk Highs |
125 |
|
|
52 Wk Highs |
141 |
|
|
S&P 600 |
+5.50 |
866.14 |
+0.64% |
|
52 Wk Lows |
9 |
|
|
52 Wk Lows |
20 |
|
|
 |
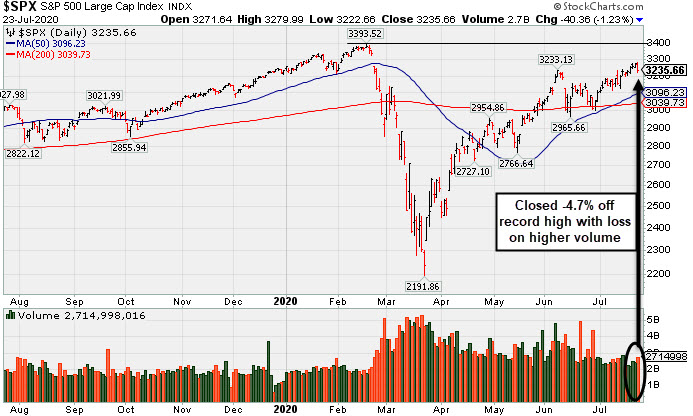
Afternoon Slump Sent Major Indices Lower
Kenneth J. Gruneisen - Passed the CAN SLIM® Master's Exam
The Dow lost 353 points, while the S&P 500 dropped 1.2%, snapping a four-session winning streak and logging its worst day of the month. The Nasdaq Composite declined 2.3%. Decliners led advancers by a narrow margin on the NYSE and by a 3-2 margin on the Nasdaq exchange. The reported volume totals were mixed, lighter than the prior session on the NYSE and higher on the Nasdaq exchange. There were 93 high-ranked companies from the Leaders List that hit new 52-week highs and were listed on the BreakOuts Page, versus the total of 80 on the prior session. New 52-week highs totals expanded and solidly outnumbered new 52-week lows totals on both the NYSE and the Nasdaq exchange. New lows on the NYSE were in the single digits for the third consecutive session. The major indices are in a confirmed uptrend (M criteria). Any sustainable rally requires a healthy crop of new leaders, so it remains ever-important to see substantial new highs totals. Charts used courtesy of www.stockcharts.com
PICTURED: The S&P 500 Index fell with higher volume, closing -4.7% off its record high.
Stocks finished broadly lower Thursday, as investors digested a disappointing update on the U.S. labor market and a slew of corporate earnings reports. Fiscal stimulus measures were also in focus, with Senate Republicans and the White House agreeing on a coronavirus relief bill worth around $1 trillion. This is below the $3 trillion figure targeted by Democrats, but the plan reportedly excludes a contentious payroll tax cut sought by President Trump.
On the data front, initial jobless claims increased to 1.4 million in the most recent week, marking the first uptick in unemployment claims since March. Separately, the leading index of economic indicators rose 2.0% in June after advancing an upwardly revised 3.2% in May. Treasuries advanced, with the yield on the 10-year note dipping two basis points to 0.58%. Other perceived safe-have assets rallied with gold gaining 1.0% to $1884.00/ounce.
Eight of 11 S&P 500 sectors ended the day in negative territory, with the Consumer Discretionary and Technology losing more than 2.0%. In earnings, Microsoft (MSFT -4.35%) fell after its cloud computing segment disappointed on slowing revenue growth. Tesla (TSLA -4.98%) fell despite delivering a fourth-consecutive quarterly profit. Twitter (TWTR +4.06%) rallied after its key metric of daily active users spiked 34% versus a year ago. Elsewhere, homebuilder PulteGroup (PHM +4.69%) rose amid stronger-than-forecasted profit and sales figures. In other corporate news, mega-cap companies traded lower with Apple (AAPL -4.55%) and Amazon (AMZN -3.66%) both slumping for big losses.
|
 Kenneth J. Gruneisen started out as a licensed stockbroker in August 1987, a couple of months prior to the historic stock market crash that took the Dow Jones Industrial Average down -22.6% in a single day. He has published daily fact-based fundamental and technical analysis on high-ranked stocks online for two decades. Through FACTBASEDINVESTING.COM, Kenneth provides educational articles, news, market commentary, and other information regarding proven investment systems that work in good times and bad.
Comments contained in the body of this report are technical opinions only and are not necessarily those of Gruneisen Growth Corp. The material herein has been obtained from sources believed to be reliable and accurate, however, its accuracy and completeness cannot be guaranteed. Our firm, employees, and customers may effect transactions, including transactions contrary to any recommendation herein, or have positions in the securities mentioned herein or options with respect thereto. Any recommendation contained in this report may not be suitable for all investors and it is not to be deemed an offer or solicitation on our part with respect to the purchase or sale of any securities. |
|
 |
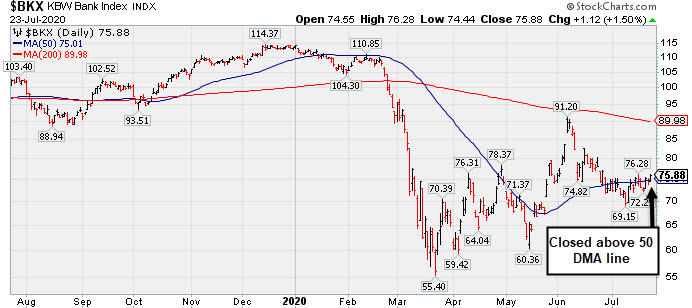
Oil Services Outpaced Bank and Networking Index Gains
Kenneth J. Gruneisen - Passed the CAN SLIM® Master's Exam
The Retail Index ($RLX -2.48%) created a drag on the major indices and the Broker/Dealer Index ($XBD -0.68%) also edged lower. The Oil Services Index ($OSX +4.54%) posted a standout gain but the Integrated Oil Index ($XOI -0.47%) edged lower. The Gold & Silver Index ($XAU -2.34%) slumped, breaking a streak of 4 consecutive gains for new multi-year highs. The tech sector was mixed as the Semiconductor Index ($SOX -1.64%) and Biotech Index ($BTK -1.35%) both lost ground while the Networking Index ($NWX +0.98%) notched a gain. .
PICTURED: The Bank Index ($BKX +1.48%) posted a gain that helped it close back above its 50-day moving average (DMA) line.
| Oil Services |
$OSX |
37.09 |
+1.61 |
+4.54% |
-52.62% |
| Integrated Oil |
$XOI |
779.73 |
-3.70 |
-0.47% |
-38.63% |
| Semiconductor |
$SOX |
2,070.97 |
-34.46 |
-1.64% |
+11.97% |
| Networking |
$NWX |
592.66 |
+5.76 |
+0.98% |
+1.59% |
| Broker/Dealer |
$XBD |
285.36 |
-1.96 |
-0.68% |
-1.73% |
| Retail |
$RLX |
3,208.28 |
-81.52 |
-2.48% |
+30.99% |
| Gold & Silver |
$XAU |
146.48 |
-3.51 |
-2.34% |
+37.00% |
| Bank |
$BKX |
75.87 |
+1.11 |
+1.48% |
-33.07% |
| Biotech |
$BTK |
5,877.01 |
-80.39 |
-1.35% |
+15.98% |
|
|
|
 |
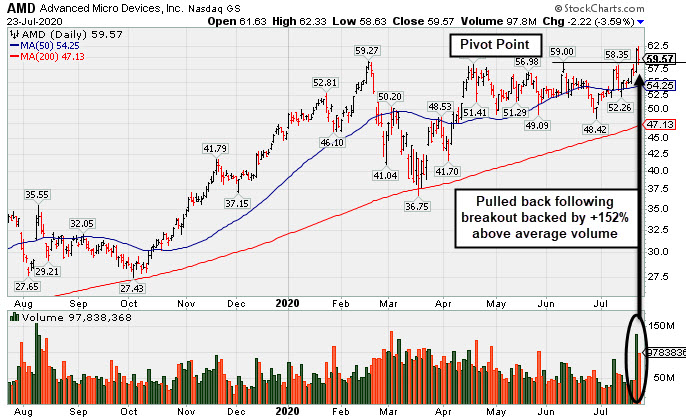
Pullback After Breakout Gain Backed by +152% Above Average Volume
Kenneth J. Gruneisen - Passed the CAN SLIM® Master's Exam
Advanced Micro Devices (AMD -$2.22 or -3.59% to $59.57) pulled back today retreating toward its pivot point with above average volume behind a big loss. The breakout gain on the prior session was backed by +152% above average volume triggering a technical buy signal. A new pivot point was cited based on its 6/10/20 high plus 10 cents. Now the prior highs in the $59 area define initial support to watch above its 50-day moving average (DMA) line ($54.25).
Keep in mind it is due to report Jun '20 quarterly results on Tuesday, 7/28/20. Volume and volatility often increase near earnings news. AMD was highlighted in yellow in the 6/09/20 mid-day report (read here). It undercut the prior lows but managed a "positive reversal" on the session after it was last shown in this FSU section on 6/26/20 with an annotated graph under the headline, "Slump Below 50-Day Average Toward Prior Low Raises Concerns".
The 3 latest quarterly comparisons through Mar '20 showed very strong earnings increases well above the +25% minimum guideline (C criteria) with greatly improved sales revenues growth +50% and +40% in the Dec '19 and Mar '20 comparisons, respectively, versus the year ago periods. Annual earnings growth (A criteria) has been very strong after losses in FY '15 and '16. it has a highest possible 99 Earnings Per Share Rating.
AMD hails from the Electronics - Semiconductor Fabless industry which has a Group Relative Strength Rating of 89 (L criteria). It has a large supply of 1.17 billion shares outstanding (S criteria), which makes it less likely to be a quick sprinter. However, the number of top-rated funds owning its shares rose from 1,669 in Jun '19 to 2,069 in Jun '20, a reassuring sign concerning the I criteria. It has a Timeliness Rating of A, a Sponsorship Rating of B, and an Accumulation/Distribution rating of B.
|
|
|
Color Codes Explained :
Y - Better candidates highlighted by our
staff of experts.
G - Previously featured
in past reports as yellow but may no longer be buyable under the
guidelines.
***Last / Change / Volume data in this table is the closing quote data***
Symbol/Exchange
Company Name
Industry Group |
PRICE |
CHANGE
(%Change) |
Day High |
Volume
(% DAV)
(% 50 day avg vol) |
52 Wk Hi
% From Hi |
Featured
Date |
Price
Featured |
Pivot Featured |
|
Max Buy |
 FTNT
-
NASDAQ
FTNT
-
NASDAQ
Fortinet Inc
Computer Sftwr-Security
|
$135.16
|
+0.87
0.65% |
$138.39
|
1,510,619
87.93% of 50 DAV
50 DAV is 1,718,000
|
$151.95
-11.05%
|
6/22/2020
|
$142.68
|
PP = $149.79
|
|
MB = $157.28
|
Most Recent Note - 7/20/2020 2:52:37 PM
G - Rebounding with today's gain backed by light volume after undercutting prior lows in the $128 area with last week's losses which raised concerns. A rebound above its 50 DMA line ($138) is needed for its outlook to improve.
>>> FEATURED STOCK ARTICLE : Best Ever Close With Volume-Driven Gain Approaching Pivot Point - 7/8/2020 |
View all notes |
Set NEW NOTE alert |
Company Profile |
SEC
News |
Chart |
Request a new note
C
A
S
I |
CRL
-
NYSE
Charles River Labs Intl
DRUGS - Biotechnology
|
$198.20
|
+0.04
0.02% |
$202.95
|
312,347
78.68% of 50 DAV
50 DAV is 397,000
|
$201.07
-1.43%
|
7/15/2020
|
$192.66
|
PP = $189.95
|
|
MB = $199.45
|
Most Recent Note - 7/20/2020 5:28:54 PM
Y - Posted a 2nd consecutive gain with lighter volume while approaching its "max buy" level. The prior high ($189.85 on 6/03/20) defines initial support to watch on pullbacks.
>>> FEATURED STOCK ARTICLE : Volume +71% Above Average Behind Breakout - 7/15/2020 |
View all notes |
Set NEW NOTE alert |
Company Profile |
SEC
News |
Chart |
Request a new note
C
A
S
I |
EBS
-
NYSE
Emergent Biosolutions
DRUGS - Biotechnology
|
$88.97
|
-5.01
-5.33% |
$93.62
|
9,301,785
1,308.27% of 50 DAV
50 DAV is 711,000
|
$107.16
-16.97%
|
7/7/2020
|
$89.47
|
PP = $93.68
|
|
MB = $98.36
|
 Most Recent Note - 7/23/2020 12:20:40 PM
Y - Pulling back today for a 4th consecutive volume-driven loss after a "negative reversal" at its all-time high. Slumping below its pivot point raising concerns The next important support to watch is its 50 DMA line ($83.37). Fundamentals remain strong.
>>> FEATURED STOCK ARTICLE : Impressive Rebound to Hit a New High - 7/9/2020 |
View all notes |
Set NEW NOTE alert |
Company Profile |
SEC
News |
Chart |
Request a new note
C
A
S
I |
NBIX
-
NASDAQ
Neurocrine Biosciences
DRUGS - Biotechnology
|
$128.15
|
-2.27
-1.74% |
$132.65
|
465,764
52.27% of 50 DAV
50 DAV is 891,000
|
$136.27
-5.96%
|
5/19/2020
|
$123.71
|
PP = $119.75
|
|
MB = $125.74
|
Most Recent Note - 7/20/2020 2:56:21 PM
G - Matched its all-time high earlier with today's quiet gain. Its 50 DMA line ($122.78) and prior highs in the $119 area define important near-term support to watch. Fundamentals remain strong.
>>> FEATURED STOCK ARTICLE : Pulled Back Below "Max Buy" Level With Loss on Average Volume - 6/30/2020 |
View all notes |
Set NEW NOTE alert |
Company Profile |
SEC
News |
Chart |
Request a new note
C
A
S
I |
BMRN
-
NASDAQ
Biomarin Pharmaceutical
DRUGS - Drug Manufacturers - Other
|
$124.49
|
-3.09
-2.42% |
$129.18
|
958,465
60.13% of 50 DAV
50 DAV is 1,594,000
|
$131.95
-5.65%
|
6/17/2020
|
$110.95
|
PP = $112.67
|
|
MB = $118.30
|
Most Recent Note - 7/23/2020 5:49:24 PM
G - Pulled back from its all-time high with light volume behind today's 3rd consecutive loss. It is extended from any sound base. Fundamentals remain strong. Its 50 DMA line ($114.09) and prior high ($112.57) define near-term support levels to watch.
>>> FEATURED STOCK ARTICLE : Hovering Near High With Volume Totals Cooling - 7/10/2020 |
View all notes |
Set NEW NOTE alert |
Company Profile |
SEC
News |
Chart |
Request a new note
C
A
S
I |
Symbol/Exchange
Company Name
Industry Group |
PRICE |
CHANGE
(%Change) |
Day High |
Volume
(% DAV)
(% 50 day avg vol) |
52 Wk Hi
% From Hi |
Featured
Date |
Price
Featured |
Pivot Featured |
|
Max Buy |
AUDC
-
NASDAQ
Audiocodes Ltd
ELECTRONICS - Scientific and Technical Instrum
|
$42.86
|
-0.15
-0.35% |
$44.90
|
1,030,939
150.28% of 50 DAV
50 DAV is 686,000
|
$43.66
-1.83%
|
7/17/2020
|
$37.16
|
PP = $40.16
|
|
MB = $42.17
|
Most Recent Note - 7/22/2020 12:30:10 PM
Y - Powering to a new 52-week high with today's big volume-driven gain triggering a technical buy signal, however, it is quickly trading up above the "max buy" level. Completed a new Public Offering on 6/08/20. Due to report Jun '20 quarterly results on 7/28/20
>>> FEATURED STOCK ARTICLE : Resilient and High-Ranked VOIP Firm Rebounding Near Highs - 7/17/2020 |
View all notes |
Set NEW NOTE alert |
Company Profile |
SEC
News |
Chart |
Request a new note
C
A
S
I |
AMD
-
NASDAQ
Advanced Micro Devices
ELECTRONICS - Semiconductor - Broad Line
|
$59.57
|
-2.22
-3.59% |
$62.33
|
98,527,300
179.98% of 50 DAV
50 DAV is 54,744,000
|
$62.00
-3.92%
|
7/22/2020
|
$61.73
|
PP = $59.10
|
|
MB = $62.06
|
Most Recent Note - 7/23/2020 5:37:03 PM
Y - Pulled back toward its pivot point with above average volume behind today's big loss. Big gain on the prior session backed by +152% above average volume triggered a technical buy signal. New pivot point was cited based on its 6/10/20 high plus 10 cents. Prior highs in the $59 area define initial support above its 50 DMA line ($54.25). See the latest FSU analysis for more details and a new annotated graph.
>>> FEATURED STOCK ARTICLE : Pullback After Breakout Gain Backed by +152% Above Average Volume - 7/23/2020 |
View all notes |
Set NEW NOTE alert |
Company Profile |
SEC
News |
Chart |
Request a new note
C
A
S
I |
TREX
-
NYSE
Trex Company Inc
MATERIALS and CONSTRUCTION - General Building Materials
|
$133.62
|
-2.16
-1.59% |
$138.72
|
436,988
44.77% of 50 DAV
50 DAV is 976,000
|
$138.34
-3.41%
|
6/26/2020
|
$109.05
|
PP = $132.94
|
|
MB = $139.59
|
Most Recent Note - 7/21/2020 5:42:24 PM
Y - Pulled back today with lighter volume after wedging to new all-time highs with 5 consecutive gains backed by below average volume. Gains above the pivot point must have at least +40% above average volume to trigger a proper new (or add-on) technical buy signal. Important near-term support is at its 50 DMA line ($122.98). Fundamentals remain strong.
>>> FEATURED STOCK ARTICLE : Quietly Perched Near All-Time High After Forming a New Base - 7/6/2020 |
View all notes |
Set NEW NOTE alert |
Company Profile |
SEC
News |
Chart |
Request a new note
C
A
S
I |
NFLX
-
NASDAQ
Netflix Inc
SPECIALTY RETAIL - Music and Video Stores
|
$477.58
|
-12.24
-2.50% |
$491.90
|
7,684,433
98.29% of 50 DAV
50 DAV is 7,818,000
|
$575.37
-17.00%
|
5/14/2020
|
$441.95
|
PP = $449.62
|
|
MB = $472.10
|
Most Recent Note - 7/23/2020 5:52:02 PM
G - Prior highs in the $458 area define near-term support coinciding with its 50 DMA line ($458.79). Pulling back toward its "max buy" level after getting very extended from the prior base. Consolidating after reporting Jun '20 earnings +165% on +25% sales revenues versus the year ago period.
>>> FEATURED STOCK ARTICLE : Powered to New High on Prior Session With Volume Driven Gain - 7/2/2020 |
View all notes |
Set NEW NOTE alert |
Company Profile |
SEC
News |
Chart |
Request a new note
C
A
S
I |
CHGG
-
NYSE
Chegg Inc
Consumer Svcs-Education
|
$74.63
|
-1.37
-1.80% |
$79.09
|
2,948,591
83.06% of 50 DAV
50 DAV is 3,550,000
|
$77.90
-4.20%
|
6/17/2020
|
$63.71
|
PP = $68.08
|
|
MB = $71.48
|
Most Recent Note - 7/20/2020 2:03:06 PM
G - Color code is changed to green after rallying well above its "max buy" level with today's 4th consecutive gain. Prior high in the $68 area defines initial support to watch above its 50 DMA line ($64.89).
>>> FEATURED STOCK ARTICLE : Negative Reversal After Recently Wedging into New High Territory - 7/13/2020 |
View all notes |
Set NEW NOTE alert |
Company Profile |
SEC
News |
Chart |
Request a new note
C
A
S
I |
Symbol/Exchange
Company Name
Industry Group |
PRICE |
CHANGE
(%Change) |
Day High |
Volume
(% DAV)
(% 50 day avg vol) |
52 Wk Hi
% From Hi |
Featured
Date |
Price
Featured |
Pivot Featured |
|
Max Buy |
LGIH
-
NASDAQ
L G I Homes Inc
Bldg-Resident/Comml
|
$112.76
|
-2.23
-1.94% |
$120.54
|
346,823
93.48% of 50 DAV
50 DAV is 371,000
|
$116.82
-3.48%
|
7/7/2020
|
$99.19
|
PP = $95.82
|
|
MB = $100.61
|
Most Recent Note - 7/22/2020 5:49:46 PM
G - Hit another new all-time high with today's gain backed by average volume, getting more extended from the previously noted base. Prior highs in the $95 area define initial support to watch on pullbacks.
>>> FEATURED STOCK ARTICLE : Breakout to New High Backed by 53% Above Average Volume - 7/7/2020 |
View all notes |
Set NEW NOTE alert |
Company Profile |
SEC
News |
Chart |
Request a new note
C
A
S
I |
NOW
-
NYSE
Servicenow Inc
Computer Sftwr-Enterprse
|
$430.85
|
-10.75
-2.43% |
$448.34
|
1,323,533
73.65% of 50 DAV
50 DAV is 1,797,000
|
$454.70
-5.25%
|
4/30/2020
|
$343.05
|
PP = $363.05
|
|
MB = $381.20
|
Most Recent Note - 7/22/2020 5:42:19 PM
G - Perched near its all-time high following a big gain on 7/20/20 backed by +72% above average volume. It has not formed a sound base. Its 50 DMA line ($398) defines important near-term support to watch where a violation may trigger a technical sell signal. See the latest FSU analysis for more details and a new annotated graph.
>>> FEATURED STOCK ARTICLE : Perched Near All-Time High With Earnings News Due Next Week - 7/22/2020 |
View all notes |
Set NEW NOTE alert |
Company Profile |
SEC
News |
Chart |
Request a new note
C
A
S
I |
TEAM
-
NASDAQ
Atlassian Corp Plc Cl A
Comp Sftwr-Spec Enterprs
|
$188.64
|
-2.66
-1.39% |
$196.33
|
2,209,312
117.27% of 50 DAV
50 DAV is 1,884,000
|
$198.41
-4.92%
|
7/7/2020
|
$190.44
|
PP = $191.82
|
|
MB = $201.41
|
Most Recent Note - 7/20/2020 1:15:27 PM
Y - Today's big volume-driven gain has it rebounding above its 50 DMA line ($180) helping its outlook to improve and its color code is changed to yellow. Recent gains above the pivot point lacked the +40% above average volume necessary to trigger a convincing new (or add-on) technical buy signal. The prior low ($160.20 on 5/27/20) defines its next important support above prior highs in the $156 area.
>>> FEATURED STOCK ARTICLE : 50-Day Moving Average Defines Important Near-Term Support - 6/29/2020 |
View all notes |
Set NEW NOTE alert |
Company Profile |
SEC
News |
Chart |
Request a new note
C
A
S
I |
TTD
-
NASDAQ
The Trade Desk Inc Cl A
Comml Svcs-Advertising
|
$424.39
|
-18.93
-4.27% |
$451.50
|
1,244,942
68.78% of 50 DAV
50 DAV is 1,810,000
|
$475.67
-10.78%
|
6/3/2020
|
$340.61
|
PP = $327.35
|
|
MB = $343.72
|
Most Recent Note - 7/23/2020 5:39:38 PM
G - Retreated from near its all-time high with today's loss on higher (but below average) volume. Very extended from any sound base, and its 50 DMA line ($378) defines near-term support to watch.
>>> FEATURED STOCK ARTICLE : Rebounded Near All-Time High With Gain Backed by Light Volume - 7/20/2020 |
View all notes |
Set NEW NOTE alert |
Company Profile |
SEC
News |
Chart |
Request a new note
C
A
S
I |
DOCU
-
NASDAQ
Docusign Inc
Computer Sftwr-Enterprse
|
$198.49
|
-5.49
-2.69% |
$208.80
|
3,295,631
58.58% of 50 DAV
50 DAV is 5,626,000
|
$217.00
-8.53%
|
6/10/2020
|
$149.73
|
PP = $152.10
|
|
MB = $159.71
|
Most Recent Note - 7/23/2020 5:41:44 PM
G - There was a "negative reversal" today for a loss on light volume. It is very extended from any sound base. Its 50 DMA line ($163) defines near-term support to watch on pullbacks. DOCU is now priced +97% above its 200 DMA price, and it is taught in the Certification that a stock trading +70-100% or more above the 200 DMA is to be recognized as a "sell signal".
>>> FEATURED STOCK ARTICLE : Rally From Ascending Base Leaves Stock Very Extended - 7/1/2020 |
View all notes |
Set NEW NOTE alert |
Company Profile |
SEC
News |
Chart |
Request a new note
C
A
S
I |
Symbol/Exchange
Company Name
Industry Group |
PRICE |
CHANGE
(%Change) |
Day High |
Volume
(% DAV)
(% 50 day avg vol) |
52 Wk Hi
% From Hi |
Featured
Date |
Price
Featured |
Pivot Featured |
|
Max Buy |
PING
-
NYSE
Ping Identity Hldg Corp
Computer Sftwr-Security
|
$32.85
|
-1.00
-2.95% |
$34.60
|
755,091
46.61% of 50 DAV
50 DAV is 1,620,000
|
$35.79
-8.21%
|
6/1/2020
|
$29.24
|
PP = $29.90
|
|
MB = $31.40
|
Most Recent Note - 7/23/2020 5:46:22 PM
G - Had "negative reversals" on Tuesday and again today for losses on light volume. Its 50 DMA line ($30.18) and prior highs in the $29 area define important near-term support. It is extended from any sound base. Completed Secondary Offerings on 7/09/20 and 5/15/20.
>>> FEATURED STOCK ARTICLE : Consolidating Above 50-Day Moving Average Following Secondary - 7/16/2020 |
View all notes |
Set NEW NOTE alert |
Company Profile |
SEC
News |
Chart |
Request a new note
C
A
S
I |
AAXN
-
NASDAQ
Axon Enterprise Inc
Security/Sfty
|
$87.53
|
-1.59
-1.78% |
$89.89
|
660,287
51.83% of 50 DAV
50 DAV is 1,274,000
|
$104.90
-16.56%
|
5/8/2020
|
$84.86
|
PP = $90.20
|
|
MB = $94.71
|
Most Recent Note - 7/22/2020 5:45:36 PM
G - Color code is changed to green after slumping to a close below its 50 DMA line ($89.89) with today's loss on below average volume. More damaging losses below the prior low ($887.75 on 7/14/20) would raise serious concerns and trigger a technical sell signal. Completed a new Public Offering on 6/17/20.
>>> FEATURED STOCK ARTICLE : Managed Positive Reversal After Testing 50-Day Moving Average - 7/14/2020 |
View all notes |
Set NEW NOTE alert |
Company Profile |
SEC
News |
Chart |
Request a new note
C
A
S
I |
ZEN
-
NYSE
Zendesk Inc
Computer Sftwr-Enterprse
|
$94.81
|
-1.16
-1.21% |
$97.67
|
2,049,777
99.50% of 50 DAV
50 DAV is 2,060,000
|
$96.99
-2.25%
|
7/21/2020
|
$94.29
|
PP = $94.97
|
|
MB = $99.72
|
Most Recent Note - 7/21/2020 5:35:39 PM
Y - Finished with a loss today backed by +30% above average volume after highlighted in yellow with pivot point cited based on its 7/10/20 high plus 10 cents. It hit new 52-week and all-time highs on the prior session with a gain backed by +70% above average volume triggering a technical buy signal. Quarterly earnings comparisons through Mar '20 have been above year ago periods by more than the +25% minimum guideline (C criteria). After years of shrinking losses it reported solid earnings in FY '18 and '19 (A criteria). Increasing institutional ownership (I criteria) is a reassuring sign. See the latest FSU analysis for more details and a new annotated graph.
>>> FEATURED STOCK ARTICLE : Pullback Below Pivot Point Following Breakout Gain - 7/21/2020 |
View all notes |
Set NEW NOTE alert |
Company Profile |
SEC
News |
Chart |
Request a new note
C
A
S
I |
|
|
|
THESE ARE NOT BUY RECOMMENDATIONS!
Comments contained in the body of this report are technical
opinions only. The material herein has been obtained
from sources believed to be reliable and accurate, however,
its accuracy and completeness cannot be guaranteed.
This site is not an investment advisor, hence it does
not endorse or recommend any securities or other investments.
Any recommendation contained in this report may not
be suitable for all investors and it is not to be deemed
an offer or solicitation on our part with respect to
the purchase or sale of any securities. All trademarks,
service marks and trade names appearing in this report
are the property of their respective owners, and are
likewise used for identification purposes only.
This report is a service available
only to active Paid Premium Members.
You may opt-out of receiving report notifications
at any time. Questions or comments may be submitted
by writing to Premium Membership Services 665 S.E. 10 Street, Suite 201 Deerfield Beach, FL 33441-5634 or by calling 1-800-965-8307
or 954-785-1121.
|
|
|