You are not logged in.
This means you
CAN ONLY VIEW reports that were published prior to Tuesday, February 20, 2024.
You
MUST UPGRADE YOUR MEMBERSHIP if you want to see any current reports.
AFTER MARKET UPDATE - WEDNESDAY, JULY 22ND, 2020
Previous After Market Report Next After Market Report >>>
|
|
|
|
DOW |
+165.44 |
27,005.84 |
+0.62% |
|
Volume |
829,030,361 |
-8% |
|
Volume |
4,055,363,400 |
-23% |
|
NASDAQ |
+28.77 |
10,709.13 |
+0.27% |
|
Advancers |
1,737 |
59% |
|
Advancers |
1,475 |
45% |
|
S&P 500 |
+18.72 |
3,276.02 |
+0.57% |
|
Decliners |
1,203 |
41% |
|
Decliners |
1,782 |
55% |
|
Russell 2000 |
+2.63 |
1,490.14 |
+0.18% |
|
52 Wk Highs |
114 |
|
|
52 Wk Highs |
124 |
|
|
S&P 600 |
+1.26 |
860.64 |
+0.15% |
|
52 Wk Lows |
5 |
|
|
52 Wk Lows |
15 |
|
|
 |
Major Indices Rose With Lighter Volume and Less Leadership
Kenneth J. Gruneisen - Passed the CAN SLIM® Master's Exam
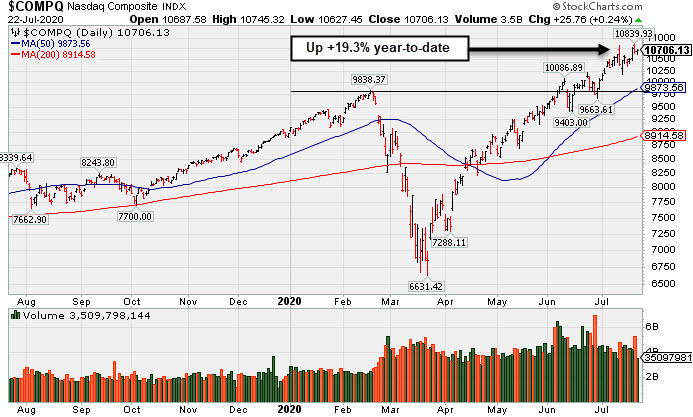
The S&P 500 added 0.6% to touch its best level in five months, now up 1.4% year-to-date. The Dow rose 165 points, while the Nasdaq Composite fluctuated, finally ending the session up 0.2%. Advancers led decliners by almost a 3-2 margin on the NYSE but decliners led advancers by and 6-5 on the Nasdaq exchange. The reported volume totals were lighter than the prior session on the NYSE and on the Nasdaq exchange. There were 80 high-ranked companies from the Leaders List that hit new 52-week highs and were listed on the BreakOuts Page, versus the total of 103 on the prior session. New 52-week highs totals contracted yet still solidly outnumbered new 52-week lows totals on both the NYSE and the Nasdaq exchange. New lows on the NYSE were in the single digits. The major indices are in a confirmed uptrend (M criteria). Any sustainable rally requires a healthy crop of new leaders, so it remains ever-important to see substantial new highs totals. Charts used courtesy of www.stockcharts.com
PICTURED: The Nasdaq Composite Index is +19.3% year-to-date.
Stocks finished higher on Wednesday as investors remained hopeful that U.S. lawmakers could negotiate another coronavirus relief package. Market participants eyed stimulus efforts in Washington, with White House leaders and Senate Republicans considering a short-term extension of COVID-19-related unemployment benefits set to expire at month-end. Also providing a tailwind to equities was news that the U.S. government ordered 100 million doses of Pfizer (PFE +5.10%) and BioNTech’s (BNTX +13.72%) joint coronavirus vaccine candidate, with the agreement including the ability to acquire an additional 500 million doses. Meanwhile, investors seemed to brush off intensifying U.S.-China tensions. The U.S. State Department ordered the closure of China’s Houston consulate in order to “protect American intellectual property.” Beijing vowed to retaliate the move, calling it an “unprecedented escalation.”
Nine of 11 S&P 500 sectors closed in positive territory, with the Energy and Financials groups the two decliners. Utilities paced the gains, advancing 1.5%. In earnings, Snap, Inc. (SNAP -6.22%) fell after the social media company posted a weaker-than-forecasted rise in its daily active users.
On the data front, existing home sales jumped 20.7% in June. Treasuries were little changed, with the yield on the 10-year note steady at 0.60%. In commodities, COMEX gold climbed 1.3% to $1.866.90/ounce as a gauge of the U.S. dollar weakened to a six-month low. Silver extended its recent rally to hit a nearly seven-year high.
|
 Kenneth J. Gruneisen started out as a licensed stockbroker in August 1987, a couple of months prior to the historic stock market crash that took the Dow Jones Industrial Average down -22.6% in a single day. He has published daily fact-based fundamental and technical analysis on high-ranked stocks online for two decades. Through FACTBASEDINVESTING.COM, Kenneth provides educational articles, news, market commentary, and other information regarding proven investment systems that work in good times and bad.
Comments contained in the body of this report are technical opinions only and are not necessarily those of Gruneisen Growth Corp. The material herein has been obtained from sources believed to be reliable and accurate, however, its accuracy and completeness cannot be guaranteed. Our firm, employees, and customers may effect transactions, including transactions contrary to any recommendation herein, or have positions in the securities mentioned herein or options with respect thereto. Any recommendation contained in this report may not be suitable for all investors and it is not to be deemed an offer or solicitation on our part with respect to the purchase or sale of any securities. |
|
 |
Gold & Silver, Semiconductor, and Networking Indexes Rose
Kenneth J. Gruneisen - Passed the CAN SLIM® Master's Exam
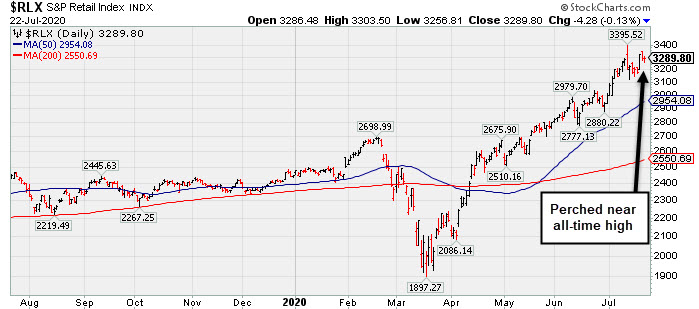
Financials created a drag on the major indices as the Broker/Dealer Index ($XBD -0.98%) and Bank Index ($BKX -0.66%) both edged lower. Commodity-linked groups were mixed as the Gold & Silver Index ($XAU +2.32%) posted a standout gain, meanwhile the Oil Services Index ($OSX -1.09%) and Integrated Oil Index ($XOI -0.91%) both finished lower. The Semiconductor Index ($SOX +0.41%) and Networking Index ($NWX +0.75%) each posted a modest gain, meanwhile the Biotech Index ($BTK -0.43%) edged higher.
PICTURED: The Retail Index ($RLX -0.13%) is perched near its all-time high.
| Oil Services |
$OSX |
35.48 |
-0.39 |
-1.09% |
-54.68% |
| Integrated Oil |
$XOI |
783.43 |
-7.18 |
-0.91% |
-38.34% |
| Semiconductor |
$SOX |
2,105.20 |
+8.61 |
+0.41% |
+13.82% |
| Networking |
$NWX |
586.89 |
+4.34 |
+0.75% |
+0.60% |
| Broker/Dealer |
$XBD |
287.32 |
-2.84 |
-0.98% |
-1.05% |
| Retail |
$RLX |
3,289.80 |
-4.28 |
-0.13% |
+34.32% |
| Gold & Silver |
$XAU |
149.99 |
+3.40 |
+2.32% |
+40.28% |
| Bank |
$BKX |
74.76 |
-0.50 |
-0.66% |
-34.05% |
| Biotech |
$BTK |
5,957.41 |
-25.93 |
-0.43% |
+17.56% |
|
|
|
 |
Perched Near All-Time High With Earnings News Due Next Week
Kenneth J. Gruneisen - Passed the CAN SLIM® Master's Exam
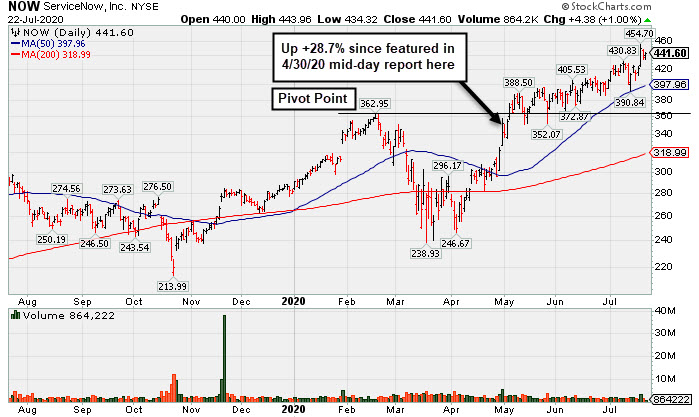
ServiceNow Inc (NOW +$4.38 or +1.00% to $441.60) is perched near its all-time high. On 7/20/20 it posted a big gain for a new high backed by +72% above average volume. It has not formed a sound base. Its 50-day moving average (DMA) line ($398) defines important near-term support to watch where a violation may trigger a technical sell signal.
Keep in mind that the company is due to report earnings results for the Jun '20 quarter on 7/29/20. Volume and volatility often increase near earnings news. NOW is up +28.7% from when it was highlighted in yellow in the 4/30/20 mid-day report with a pivot point based on its 2/19/20 high plus 10 cents (read here). It was last shown in this FSU section on 6/25/20 with an annotated graph under the headline, "Hovering Near All-Time High With Volume Totals Cooling".
Annual earnings (A criteria) growth has been strong since FY '15. Quarterly comparisons through Mar '20 versus the year ago periods have been routinely above the +25% minimum earnings guideline (C criteria). It has an Earnings Per Share Rating of 98. The Computer Software - Enterprise group has a Group Relative Strength Rating of 99, a reassuring sign concerning the L criteria. NOW has a new CEO as of 1/01/20.
The number of top-rated funds owning its shares rose from 1,030 in Jun '17 to 2.188 in Jun '20, a reassuring sign concerning the I criteria. It has a Timeliness Rating of A and a Sponsorship Rating of A. Its current Up/Down Volume Ratio of 1.3 is an unbiased indication its shares have been under accumulation over the past 50 days. |
|
|
Color Codes Explained :
Y - Better candidates highlighted by our
staff of experts.
G - Previously featured
in past reports as yellow but may no longer be buyable under the
guidelines.
***Last / Change / Volume data in this table is the closing quote data***
Symbol/Exchange
Company Name
Industry Group |
PRICE |
CHANGE
(%Change) |
Day High |
Volume
(% DAV)
(% 50 day avg vol) |
52 Wk Hi
% From Hi |
Featured
Date |
Price
Featured |
Pivot Featured |
|
Max Buy |
 FTNT
-
NASDAQ
FTNT
-
NASDAQ
Fortinet Inc
Computer Sftwr-Security
|
$134.29
|
+0.63
0.47% |
$137.39
|
1,642,415
94.61% of 50 DAV
50 DAV is 1,736,000
|
$151.95
-11.62%
|
6/22/2020
|
$142.68
|
PP = $149.79
|
|
MB = $157.28
|
Most Recent Note - 7/20/2020 2:52:37 PM
G - Rebounding with today's gain backed by light volume after undercutting prior lows in the $128 area with last week's losses which raised concerns. A rebound above its 50 DMA line ($138) is needed for its outlook to improve.
>>> FEATURED STOCK ARTICLE : Best Ever Close With Volume-Driven Gain Approaching Pivot Point - 7/8/2020 |
View all notes |
Set NEW NOTE alert |
Company Profile |
SEC
News |
Chart |
Request a new note
C
A
S
I |
CRL
-
NYSE
Charles River Labs Intl
DRUGS - Biotechnology
|
$198.16
|
+0.14
0.07% |
$200.66
|
242,538
60.63% of 50 DAV
50 DAV is 400,000
|
$201.07
-1.45%
|
7/15/2020
|
$192.66
|
PP = $189.95
|
|
MB = $199.45
|
Most Recent Note - 7/20/2020 5:28:54 PM
Y - Posted a 2nd consecutive gain with lighter volume while approaching its "max buy" level. The prior high ($189.85 on 6/03/20) defines initial support to watch on pullbacks.
>>> FEATURED STOCK ARTICLE : Volume +71% Above Average Behind Breakout - 7/15/2020 |
View all notes |
Set NEW NOTE alert |
Company Profile |
SEC
News |
Chart |
Request a new note
C
A
S
I |
EBS
-
NYSE
Emergent Biosolutions
DRUGS - Biotechnology
|
$93.98
|
-0.16
-0.17% |
$96.89
|
1,309,989
188.49% of 50 DAV
50 DAV is 695,000
|
$107.16
-12.30%
|
7/7/2020
|
$89.47
|
PP = $93.68
|
|
MB = $98.36
|
 Most Recent Note - 7/22/2020 12:43:43 PM
Y - Holding its ground today after a gap down on the prior session following a "negative reversal" at its all-time high. Retreated below its "max buy" level and the color code is changed to yellow. Prior high ($93.58 on 6/01/20) defines initial support to watch above its 50 DMA line ($83.19). Fundamentals remain strong.
>>> FEATURED STOCK ARTICLE : Impressive Rebound to Hit a New High - 7/9/2020 |
View all notes |
Set NEW NOTE alert |
Company Profile |
SEC
News |
Chart |
Request a new note
C
A
S
I |
NBIX
-
NASDAQ
Neurocrine Biosciences
DRUGS - Biotechnology
|
$130.42
|
-1.11
-0.84% |
$133.07
|
710,261
79.27% of 50 DAV
50 DAV is 896,000
|
$136.27
-4.29%
|
5/19/2020
|
$123.71
|
PP = $119.75
|
|
MB = $125.74
|
Most Recent Note - 7/20/2020 2:56:21 PM
G - Matched its all-time high earlier with today's quiet gain. Its 50 DMA line ($122.78) and prior highs in the $119 area define important near-term support to watch. Fundamentals remain strong.
>>> FEATURED STOCK ARTICLE : Pulled Back Below "Max Buy" Level With Loss on Average Volume - 6/30/2020 |
View all notes |
Set NEW NOTE alert |
Company Profile |
SEC
News |
Chart |
Request a new note
C
A
S
I |
BMRN
-
NASDAQ
Biomarin Pharmaceutical
DRUGS - Drug Manufacturers - Other
|
$127.58
|
-2.31
-1.78% |
$130.16
|
1,037,925
64.23% of 50 DAV
50 DAV is 1,616,000
|
$131.95
-3.31%
|
6/17/2020
|
$110.95
|
PP = $112.67
|
|
MB = $118.30
|
Most Recent Note - 7/20/2020 2:13:30 PM
G - Hitting yet another new all-time high with today's 5th consecutive gain, getting more extended from any sound base. Fundamentals remain strong. Prior high ($112.57) and its 50 DMA line ($112.20) coincide defining near-term support to watch on pullbacks.
>>> FEATURED STOCK ARTICLE : Hovering Near High With Volume Totals Cooling - 7/10/2020 |
View all notes |
Set NEW NOTE alert |
Company Profile |
SEC
News |
Chart |
Request a new note
C
A
S
I |
Symbol/Exchange
Company Name
Industry Group |
PRICE |
CHANGE
(%Change) |
Day High |
Volume
(% DAV)
(% 50 day avg vol) |
52 Wk Hi
% From Hi |
Featured
Date |
Price
Featured |
Pivot Featured |
|
Max Buy |
AUDC
-
NASDAQ
Audiocodes Ltd
ELECTRONICS - Scientific and Technical Instrum
|
$43.01
|
+4.00
10.25% |
$43.66
|
1,936,985
286.54% of 50 DAV
50 DAV is 676,000
|
$40.06
7.36%
|
7/17/2020
|
$37.16
|
PP = $40.16
|
|
MB = $42.17
|
Most Recent Note - 7/22/2020 12:30:10 PM
Y - Powering to a new 52-week high with today's big volume-driven gain triggering a technical buy signal, however, it is quickly trading up above the "max buy" level. Completed a new Public Offering on 6/08/20. Due to report Jun '20 quarterly results on 7/28/20
>>> FEATURED STOCK ARTICLE : Resilient and High-Ranked VOIP Firm Rebounding Near Highs - 7/17/2020 |
View all notes |
Set NEW NOTE alert |
Company Profile |
SEC
News |
Chart |
Request a new note
C
A
S
I |
AMD
-
NASDAQ
Advanced Micro Devices
ELECTRONICS - Semiconductor - Broad Line
|
$61.79
|
+4.79
8.40% |
$62.00
|
134,433,379
251.67% of 50 DAV
50 DAV is 53,416,000
|
$59.27
4.25%
|
7/22/2020
|
$61.73
|
PP = $59.10
|
|
MB = $62.06
|
Most Recent Note - 7/22/2020 5:47:57 PM
Y - Hit a new 52-week high with today's big gain backed by +152% above average volume triggering a technical buy signal. New pivot point was cited based on its 6/10/20 high plus 10 cents. Its 50 DMA line ($54.14 and prior low ($48.42 on 6/29/20) define important near-term support to watch on pullbacks. Previously met stubborn resistance in the $57-59 area. Those prior highs now define initial support to watch on pullbacks.
>>> FEATURED STOCK ARTICLE : Slump Below 50-Day Average Toward Prior Low Raises Concerns - 6/26/2020 |
View all notes |
Set NEW NOTE alert |
Company Profile |
SEC
News |
Chart |
Request a new note
C
A
S
I |
TREX
-
NYSE
Trex Company Inc
MATERIALS and CONSTRUCTION - General Building Materials
|
$135.78
|
+2.53
1.90% |
$137.17
|
373,096
37.76% of 50 DAV
50 DAV is 988,000
|
$138.34
-1.85%
|
6/26/2020
|
$109.05
|
PP = $132.94
|
|
MB = $139.59
|
Most Recent Note - 7/21/2020 5:42:24 PM
Y - Pulled back today with lighter volume after wedging to new all-time highs with 5 consecutive gains backed by below average volume. Gains above the pivot point must have at least +40% above average volume to trigger a proper new (or add-on) technical buy signal. Important near-term support is at its 50 DMA line ($122.98). Fundamentals remain strong.
>>> FEATURED STOCK ARTICLE : Quietly Perched Near All-Time High After Forming a New Base - 7/6/2020 |
View all notes |
Set NEW NOTE alert |
Company Profile |
SEC
News |
Chart |
Request a new note
C
A
S
I |
NFLX
-
NASDAQ
Netflix Inc
SPECIALTY RETAIL - Music and Video Stores
|
$489.82
|
-0.28
-0.06% |
$497.20
|
6,839,377
87.81% of 50 DAV
50 DAV is 7,789,000
|
$575.37
-14.87%
|
5/14/2020
|
$441.95
|
PP = $449.62
|
|
MB = $472.10
|
Most Recent Note - 7/20/2020 1:10:50 PM
G - Very extended from any sound base. Consolidating after reporting Jun '20 earnings +165% on +25% sales revenues versus the year ago period. Prior highs in the $458 area define near-term support along with its 50 DMA line ($455).
>>> FEATURED STOCK ARTICLE : Powered to New High on Prior Session With Volume Driven Gain - 7/2/2020 |
View all notes |
Set NEW NOTE alert |
Company Profile |
SEC
News |
Chart |
Request a new note
C
A
S
I |
CHGG
-
NYSE
Chegg Inc
Consumer Svcs-Education
|
$76.00
|
-0.58
-0.76% |
$77.23
|
1,211,105
33.66% of 50 DAV
50 DAV is 3,598,000
|
$77.90
-2.44%
|
6/17/2020
|
$63.71
|
PP = $68.08
|
|
MB = $71.48
|
Most Recent Note - 7/20/2020 2:03:06 PM
G - Color code is changed to green after rallying well above its "max buy" level with today's 4th consecutive gain. Prior high in the $68 area defines initial support to watch above its 50 DMA line ($64.89).
>>> FEATURED STOCK ARTICLE : Negative Reversal After Recently Wedging into New High Territory - 7/13/2020 |
View all notes |
Set NEW NOTE alert |
Company Profile |
SEC
News |
Chart |
Request a new note
C
A
S
I |
Symbol/Exchange
Company Name
Industry Group |
PRICE |
CHANGE
(%Change) |
Day High |
Volume
(% DAV)
(% 50 day avg vol) |
52 Wk Hi
% From Hi |
Featured
Date |
Price
Featured |
Pivot Featured |
|
Max Buy |
LGIH
-
NASDAQ
L G I Homes Inc
Bldg-Resident/Comml
|
$114.99
|
+4.04
3.64% |
$116.82
|
356,906
96.20% of 50 DAV
50 DAV is 371,000
|
$114.49
0.44%
|
7/7/2020
|
$99.19
|
PP = $95.82
|
|
MB = $100.61
|
Most Recent Note - 7/22/2020 5:49:46 PM
G - Hit another new all-time high with today's gain backed by average volume, getting more extended from the previously noted base. Prior highs in the $95 area define initial support to watch on pullbacks.
>>> FEATURED STOCK ARTICLE : Breakout to New High Backed by 53% Above Average Volume - 7/7/2020 |
View all notes |
Set NEW NOTE alert |
Company Profile |
SEC
News |
Chart |
Request a new note
C
A
S
I |
NOW
-
NYSE
Servicenow Inc
Computer Sftwr-Enterprse
|
$441.60
|
+4.38
1.00% |
$443.96
|
864,158
47.72% of 50 DAV
50 DAV is 1,811,000
|
$454.70
-2.88%
|
4/30/2020
|
$343.05
|
PP = $363.05
|
|
MB = $381.20
|
Most Recent Note - 7/22/2020 5:42:19 PM
G - Perched near its all-time high following a big gain on 7/20/20 backed by +72% above average volume. It has not formed a sound base. Its 50 DMA line ($398) defines important near-term support to watch where a violation may trigger a technical sell signal. See the latest FSU analysis for more details and a new annotated graph.
>>> FEATURED STOCK ARTICLE : Perched Near All-Time High With Earnings News Due Next Week - 7/22/2020 |
View all notes |
Set NEW NOTE alert |
Company Profile |
SEC
News |
Chart |
Request a new note
C
A
S
I |
TEAM
-
NASDAQ
Atlassian Corp Plc Cl A
Comp Sftwr-Spec Enterprs
|
$191.30
|
-1.19
-0.62% |
$195.29
|
784,322
41.41% of 50 DAV
50 DAV is 1,894,000
|
$198.41
-3.58%
|
7/7/2020
|
$190.44
|
PP = $191.82
|
|
MB = $201.41
|
Most Recent Note - 7/20/2020 1:15:27 PM
Y - Today's big volume-driven gain has it rebounding above its 50 DMA line ($180) helping its outlook to improve and its color code is changed to yellow. Recent gains above the pivot point lacked the +40% above average volume necessary to trigger a convincing new (or add-on) technical buy signal. The prior low ($160.20 on 5/27/20) defines its next important support above prior highs in the $156 area.
>>> FEATURED STOCK ARTICLE : 50-Day Moving Average Defines Important Near-Term Support - 6/29/2020 |
View all notes |
Set NEW NOTE alert |
Company Profile |
SEC
News |
Chart |
Request a new note
C
A
S
I |
TTD
-
NASDAQ
The Trade Desk Inc Cl A
Comml Svcs-Advertising
|
$443.32
|
-0.76
-0.17% |
$453.99
|
584,385
31.47% of 50 DAV
50 DAV is 1,857,000
|
$475.67
-6.80%
|
6/3/2020
|
$340.61
|
PP = $327.35
|
|
MB = $343.72
|
Most Recent Note - 7/21/2020 5:44:06 PM
G - Hovering near its all-time high with volume totals cooling. Very extended from any sound base, and its 50 DMA line ($373) defines near-term support to watch. See the latest FSU analysis for more details and an annotated graph.
>>> FEATURED STOCK ARTICLE : Rebounded Near All-Time High With Gain Backed by Light Volume - 7/20/2020 |
View all notes |
Set NEW NOTE alert |
Company Profile |
SEC
News |
Chart |
Request a new note
C
A
S
I |
DOCU
-
NASDAQ
Docusign Inc
Computer Sftwr-Enterprse
|
$203.98
|
+2.95
1.47% |
$204.50
|
2,997,202
53.05% of 50 DAV
50 DAV is 5,650,000
|
$217.00
-6.00%
|
6/10/2020
|
$149.73
|
PP = $152.10
|
|
MB = $159.71
|
Most Recent Note - 7/20/2020 2:14:55 PM
G - Very extended from any sound base. Its 50 DMA line ($158) defines near-term support to watch on pullbacks. DOCU is now priced +102% above its 200 DMA price, and it is taught in the Certification that a stock trading +70-100% or more above the 200 DMA is to be recognized as a "sell signal".
>>> FEATURED STOCK ARTICLE : Rally From Ascending Base Leaves Stock Very Extended - 7/1/2020 |
View all notes |
Set NEW NOTE alert |
Company Profile |
SEC
News |
Chart |
Request a new note
C
A
S
I |
Symbol/Exchange
Company Name
Industry Group |
PRICE |
CHANGE
(%Change) |
Day High |
Volume
(% DAV)
(% 50 day avg vol) |
52 Wk Hi
% From Hi |
Featured
Date |
Price
Featured |
Pivot Featured |
|
Max Buy |
PING
-
NYSE
Ping Identity Hldg Corp
Computer Sftwr-Security
|
$33.85
|
+0.49
1.47% |
$34.20
|
766,608
46.97% of 50 DAV
50 DAV is 1,632,000
|
$35.79
-5.42%
|
6/1/2020
|
$29.24
|
PP = $29.90
|
|
MB = $31.40
|
Most Recent Note - 7/21/2020 5:40:17 PM
G - Had a "negative reversal" today after hitting a new all-time high. Prior highs in the $29 area and its 50 DMA line ($29.94) define important near-term support. Priced another Secondary Offering on 7/09/20 after an earlier Secondary Offering on 5/15/20. It did not form a sound base of sufficient length.
>>> FEATURED STOCK ARTICLE : Consolidating Above 50-Day Moving Average Following Secondary - 7/16/2020 |
View all notes |
Set NEW NOTE alert |
Company Profile |
SEC
News |
Chart |
Request a new note
C
A
S
I |
AAXN
-
NASDAQ
Axon Enterprise Inc
Security/Sfty
|
$89.12
|
-2.99
-3.25% |
$93.06
|
816,387
63.53% of 50 DAV
50 DAV is 1,285,000
|
$104.90
-15.04%
|
5/8/2020
|
$84.86
|
PP = $90.20
|
|
MB = $94.71
|
Most Recent Note - 7/22/2020 5:45:36 PM
G - Color code is changed to green after slumping to a close below its 50 DMA line ($89.89) with today's loss on below average volume. More damaging losses below the prior low ($887.75 on 7/14/20) would raise serious concerns and trigger a technical sell signal. Completed a new Public Offering on 6/17/20.
>>> FEATURED STOCK ARTICLE : Managed Positive Reversal After Testing 50-Day Moving Average - 7/14/2020 |
View all notes |
Set NEW NOTE alert |
Company Profile |
SEC
News |
Chart |
Request a new note
C
A
S
I |
ZEN
-
NYSE
Zendesk Inc
Computer Sftwr-Enterprse
|
$95.97
|
+1.67
1.77% |
$96.99
|
2,044,860
98.83% of 50 DAV
50 DAV is 2,069,000
|
$96.80
-0.86%
|
7/21/2020
|
$94.29
|
PP = $94.97
|
|
MB = $99.72
|
Most Recent Note - 7/21/2020 5:35:39 PM
Y - Finished with a loss today backed by +30% above average volume after highlighted in yellow with pivot point cited based on its 7/10/20 high plus 10 cents. It hit new 52-week and all-time highs on the prior session with a gain backed by +70% above average volume triggering a technical buy signal. Quarterly earnings comparisons through Mar '20 have been above year ago periods by more than the +25% minimum guideline (C criteria). After years of shrinking losses it reported solid earnings in FY '18 and '19 (A criteria). Increasing institutional ownership (I criteria) is a reassuring sign. See the latest FSU analysis for more details and a new annotated graph.
>>> FEATURED STOCK ARTICLE : Pullback Below Pivot Point Following Breakout Gain - 7/21/2020 |
View all notes |
Set NEW NOTE alert |
Company Profile |
SEC
News |
Chart |
Request a new note
C
A
S
I |
|
|
|
THESE ARE NOT BUY RECOMMENDATIONS!
Comments contained in the body of this report are technical
opinions only. The material herein has been obtained
from sources believed to be reliable and accurate, however,
its accuracy and completeness cannot be guaranteed.
This site is not an investment advisor, hence it does
not endorse or recommend any securities or other investments.
Any recommendation contained in this report may not
be suitable for all investors and it is not to be deemed
an offer or solicitation on our part with respect to
the purchase or sale of any securities. All trademarks,
service marks and trade names appearing in this report
are the property of their respective owners, and are
likewise used for identification purposes only.
This report is a service available
only to active Paid Premium Members.
You may opt-out of receiving report notifications
at any time. Questions or comments may be submitted
by writing to Premium Membership Services 665 S.E. 10 Street, Suite 201 Deerfield Beach, FL 33441-5634 or by calling 1-800-965-8307
or 954-785-1121.
|
|
|