You are not logged in.
This means you
CAN ONLY VIEW reports that were published prior to Monday, February 19, 2024.
You
MUST UPGRADE YOUR MEMBERSHIP if you want to see any current reports.
AFTER MARKET UPDATE - THURSDAY, JULY 21ST, 2022
Previous After Market Report Next After Market Report >>>
|
|
|
|
DOW |
+162.06 |
32,036.90 |
+0.51% |
|
Volume |
891,627,049 |
-5% |
|
Volume |
4,604,628,700 |
-15% |
|
NASDAQ |
+161.96 |
12,059.61 |
+1.36% |
|
Advancers |
1,938 |
62% |
|
Advancers |
2,546 |
59% |
|
S&P 500 |
+39.05 |
3,998.95 |
+0.99% |
|
Decliners |
1,196 |
38% |
|
Decliners |
1,804 |
41% |
|
Russell 2000 |
+8.74 |
1,836.69 |
+0.48% |
|
52 Wk Highs |
12 |
|
|
52 Wk Highs |
34 |
|
|
S&P 600 |
+3.38 |
1,196.51 |
+0.28% |
|
52 Wk Lows |
42 |
|
|
52 Wk Lows |
78 |
|
|
 |
Major Indices Rose With Lighter Volume and Less Leadership
Kenneth J. Gruneisen - Passed the CAN SLIM® Master's Exam
The Dow gained 162 points, while the S&P 500 rose 1%. The Nasdaq Composite climbed 1.4% as growth-related shares extend their recent outperformance. The volume totals reported were lighter than the prior session on the NYSE and on the Nasdaq exchange. Breadth was positive as advancers led decliners by a 5-3 margin on the NYSE and 4-3 on the Nasdaq exchange. There were 10 high-ranked companies from the Leaders List that hit new 52-week high and were listed on the BreakOuts Page, versus the total of 12 on the prior session. New 52-week lows totals expanded and outnumbered shrinking new 52-week highs totals on the NYSE and on the Nasdaq exchange. The market uptrend is under pressure (M criteria). Any sustainable rally requires a healthy crop of leading stocks hitting new highs, but leadership has been very thin.
Chart courtesy of www.stockcharts.com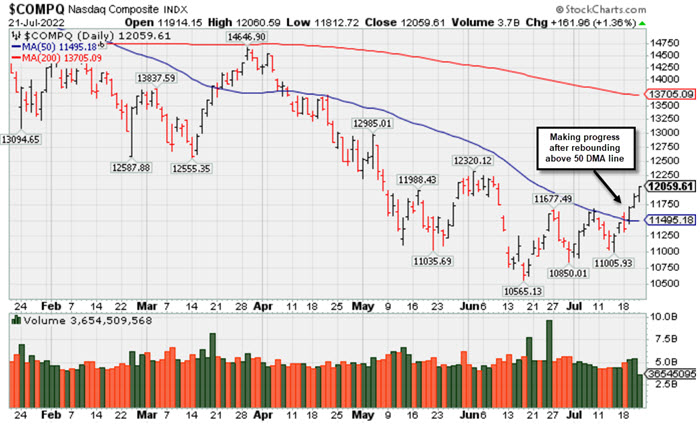 PICTURED: The Nasdaq Composite Index is making progress after rebounding above its 50-day moving average (DMA) line. It remains well below its 200 DMA line.
U.S. equities finished higher on Thursday as investors digested a flurry of corporate profit tallies and central bank updates. The European Central Bank (ECB) opted for a larger-than-expected 0.50% rate hike, implementing their first increase in 11 years. Treasuries spiked, with the inversion between the 10- and 2-year note yields persisting. The yield on the longer-date maturity plunged 13 basis points (0.13%) to 2.90%. In FOREX, the U.S. dollar eased 0.3%, weighed down by a stronger euro following the ECB’s rate hike announcement.
Nine of 11 S&P 500 sectors closed in positive territory, with Energy shares underperforming. West Texas Intermediate crude fell 3.6% to $96.28/barrel, as elevated domestic stockpiles and rate hikes stoked demand concerns. In earnings, United Airlines Holdings Inc. (UAL -10.17%) and American Airlines Group Inc. (AAL -7.43%) each slumped after both noted a reduction in flight capacity. Elsewhere, AT&T Inc. (T -7.62%) fell after trimming its free cash flow (amount of cash left over after expenses) forecast for 2022. Tesla Inc. (TSLA +9.78%) rose after posting better-than-feared quarterly figures and maintaining a 50% average annual production growth target.
On the data front, the Leading Economic index fell 0.8% in June following a downwardly revised 0.6% decline in May. Separately, a gauge of the business outlook in the Philadelphia Fed region unexpectedly deteriorated. Meanwhile, initial jobless claims hit the highest level since November (+251,000). In another sign of a loosening labor market, Microsoft Corp. became the latest Tech company to curb hiring plans.
|
 Kenneth J. Gruneisen started out as a licensed stockbroker in August 1987, a couple of months prior to the historic stock market crash that took the Dow Jones Industrial Average down -22.6% in a single day. He has published daily fact-based fundamental and technical analysis on high-ranked stocks online for two decades. Through FACTBASEDINVESTING.COM, Kenneth provides educational articles, news, market commentary, and other information regarding proven investment systems that work in good times and bad.
Comments contained in the body of this report are technical opinions only and are not necessarily those of Gruneisen Growth Corp. The material herein has been obtained from sources believed to be reliable and accurate, however, its accuracy and completeness cannot be guaranteed. Our firm, employees, and customers may effect transactions, including transactions contrary to any recommendation herein, or have positions in the securities mentioned herein or options with respect thereto. Any recommendation contained in this report may not be suitable for all investors and it is not to be deemed an offer or solicitation on our part with respect to the purchase or sale of any securities. |
|
 |
Financial, Retail, Tech, and Gold & Silver Indexes Rose
Kenneth J. Gruneisen - Passed the CAN SLIM® Master's Exam
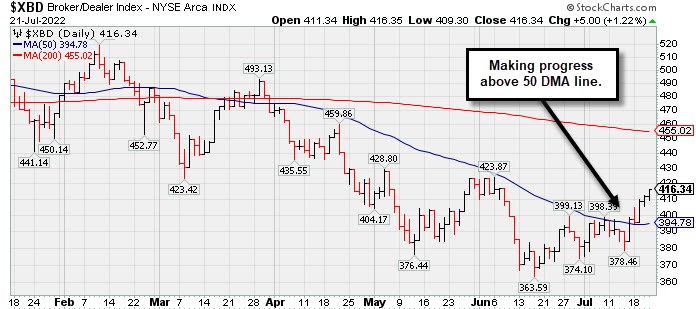
The Retail Index ($RLX +0.98%), Broker/Dealer Index ($XBD +1.22%), and Bank Index ($BKX +0.63%) each posted gains that helped give the major averages a lift. The Semiconductor Index ($SOX +1.53%), Networking Index ($NWX +1.99%), and Biotech Index ($BTK +0.77%) each posted gains. Commodity-linked groups were mixed as the Oil Services Index ($OSX -3.55%) and Integrated Oil Index ($XOI -2.01%) both were standout decliners, meanwhile the Gold & Silver Index ($XAU +1.33%) rose.
PICTURED: The Broker/Dealer Index ($XBD +1.22%) is making gradual progress above its 50-day moving average (DMA) line but still well below its 200 DMA line.
| Oil Services |
$OSX |
60.97 |
-2.24 |
-3.55% |
+15.64% |
| Integrated Oil |
$XOI |
1,468.60 |
-30.10 |
-2.01% |
+24.65% |
| Semiconductor |
$SOX |
2,916.81 |
+43.85 |
+1.53% |
-26.08% |
| Networking |
$NWX |
737.53 |
+14.38 |
+1.99% |
-24.05% |
| Broker/Dealer |
$XBD |
416.34 |
+5.00 |
+1.22% |
-14.48% |
| Retail |
$RLX |
3,233.89 |
+31.26 |
+0.98% |
-23.48% |
| Gold & Silver |
$XAU |
104.39 |
+1.37 |
+1.33% |
-21.18% |
| Bank |
$BKX |
107.81 |
+0.68 |
+0.63% |
-18.46% |
| Biotech |
$BTK |
4,808.57 |
+36.80 |
+0.77% |
-12.86% |
|
|
|
 |
Featured Stocks
Kenneth J. Gruneisen - Passed the CAN SLIM® Master's Exam
|
|
|
Color Codes Explained :
Y - Better candidates highlighted by our
staff of experts.
G - Previously featured
in past reports as yellow but may no longer be buyable under the
guidelines.
***Last / Change / Volume data in this table is the closing quote data***
Symbol/Exchange
Company Name
Industry Group |
PRICE |
CHANGE
(%Change) |
Day High |
Volume
(% DAV)
(% 50 day avg vol) |
52 Wk Hi
% From Hi |
Featured
Date |
Price
Featured |
Pivot Featured |
|
Max Buy |
 LLY
-
NYSE
LLY
-
NYSE
Eli Lilly & Co
Medical-Diversified
|
$326.92
|
+4.89
1.52% |
$328.05
|
1,692,002
57.05% of 50 DAV
50 DAV is 2,966,000
|
$335.33
-2.51%
|
5/16/2022
|
$302.46
|
PP = $314.10
|
|
MB = $329.81
|
 Most Recent Note - 7/21/2022 5:09:01 PM
Y - Posted a quiet gain today. Hovering near its all-time high with light volume totals in recent weeks. Its 50 DMA line ($310) defines near-term support to watch.
>>> FEATURED STOCK ARTICLE : Lilly Quietly Wedged to a New All-Time High This Week - 7/8/2022 |
View all notes |
Set NEW NOTE alert |
Company Profile |
SEC
News |
Chart |
Request a new note
C
A
S
I |
IMXI
-
NASDAQ
International Money Exp
Financial Svcs-Specialty
|
$23.10
|
+0.60
2.67% |
$23.52
|
813,505
203.38% of 50 DAV
50 DAV is 400,000
|
$22.94
0.70%
|
7/1/2022
|
$21.27
|
PP = $21.38
|
|
MB = $22.45
|
Most Recent Note - 7/21/2022 5:08:21 PM
Y - Posted a 5th consecutive gain today with +103% above average volume and hit a new 52-week high. Held its ground after it recently broke out of a "double bottom" base. Its 50 DMA line ($20.47) defines important near-term support to watch. Fundamentals through the Mar '22 quarter have been strong.
>>> FEATURED STOCK ARTICLE : Stalled Since Clearing Double Bottom Base - 7/15/2022 |
View all notes |
Set NEW NOTE alert |
Company Profile |
SEC
News |
Chart |
Request a new note
C
A
S
I |
HRMY
-
NASDAQ
Harmony Biosciences Hldg
Medical-Biomed/Biotech
|
$52.59
|
-0.47
-0.89% |
$54.09
|
266,066
55.09% of 50 DAV
50 DAV is 483,000
|
$57.13
-7.95%
|
7/6/2022
|
$54.12
|
PP = $52.85
|
|
MB = $55.49
|
Most Recent Note - 7/21/2022 5:07:26 PM
Y - Pulled back today with lighter volume. Showed resilience after undercutting recent lows in the $51.50 area. The 7/19/22 low ($50.18) now defines important near-term support to watch above its 50 DMA line ($46.51).
>>> FEATURED STOCK ARTICLE : Harmony Has Been Encountering Distributional Pressure - 7/18/2022 |
View all notes |
Set NEW NOTE alert |
Company Profile |
SEC
News |
Chart |
Request a new note
C
A
S
I |
CI
-
NYSE
Cigna Corp
Medical-Managed Care
|
$266.35
|
-0.37
-0.14% |
$267.75
|
1,703,231
87.12% of 50 DAV
50 DAV is 1,955,000
|
$282.33
-5.66%
|
7/7/2022
|
$276.55
|
PP = $273.68
|
|
MB = $287.36
|
Most Recent Note - 7/21/2022 5:05:54 PM
Y - Pulled back for a 2nd consecutive loss today with lighter (below average) volume. Undercutting prior highs in the $273 area and sinking near support at its 50 DMA line ($263) following the recent technical breakout. More damaging losses would raise greater concerns.
>>> FEATURED STOCK ARTICLE : Pulled Back and Tested Support at 50-Day Moving Average - 7/19/2022 |
View all notes |
Set NEW NOTE alert |
Company Profile |
SEC
News |
Chart |
Request a new note
C
A
S
I |
AN
-
NYSE
Autonation Inc
SPECIALTY RETAIL - Auto Dealerships
|
$115.62
|
-6.56
-5.37% |
$122.09
|
1,383,951
184.28% of 50 DAV
50 DAV is 751,000
|
$133.48
-13.38%
|
7/20/2022
|
$122.03
|
PP = $126.49
|
|
MB = $132.81
|
Most Recent Note - 7/21/2022 5:04:50 PM
G - Pulled back today for a 2nd consecutive volume-driven loss and its color code is changed top green after closing below its 50 DMA line ($116). Highlighted in yellow with pivot point cited based on its 5/04/22 high plus 10 cents in the prior mid-day report. A prompt rebound above the 50 DMA line is needed for its outlook to improve. Subsequent volume-driven gains above the pivot point may trigger a technical buy signal. Reported Jun '22 quarterly earnings +34% on -2% sales revenues versus the year ago period. Volume and volatility often increase near earnings news. Still perched within striking distance of prior highs in the $126 area, and it faces some resistance due to overhead supply up to the $133 level. Rebounded above its 50 and 200 DMA lines with recent volume-driven gains. Reported Mar quarterly earnings +107% on +14% sales revenues versus the year ago period, its 7th very strong earnings comparison. Annual earnings growth has been strong. See the latest FSU analysis for more details and an annotated graph.
>>> FEATURED STOCK ARTICLE : Autonation Earnings Due While Perched Near Pivot Point - 7/20/2022 |
View all notes |
Set NEW NOTE alert |
Company Profile |
SEC
News |
Chart |
Request a new note
C
A
S
I |
Symbol/Exchange
Company Name
Industry Group |
PRICE |
CHANGE
(%Change) |
Day High |
Volume
(% DAV)
(% 50 day avg vol) |
52 Wk Hi
% From Hi |
Featured
Date |
Price
Featured |
Pivot Featured |
|
Max Buy |
|
|
|
THESE ARE NOT BUY RECOMMENDATIONS!
Comments contained in the body of this report are technical
opinions only. The material herein has been obtained
from sources believed to be reliable and accurate, however,
its accuracy and completeness cannot be guaranteed.
This site is not an investment advisor, hence it does
not endorse or recommend any securities or other investments.
Any recommendation contained in this report may not
be suitable for all investors and it is not to be deemed
an offer or solicitation on our part with respect to
the purchase or sale of any securities. All trademarks,
service marks and trade names appearing in this report
are the property of their respective owners, and are
likewise used for identification purposes only.
This report is a service available
only to active Paid Premium Members.
You may opt-out of receiving report notifications
at any time. Questions or comments may be submitted
by writing to Premium Membership Services 665 S.E. 10 Street, Suite 201 Deerfield Beach, FL 33441-5634 or by calling 1-800-965-8307
or 954-785-1121.
|
|
|