You are not logged in.
This means you
CAN ONLY VIEW reports that were published prior to Friday, February 23, 2024.
You
MUST UPGRADE YOUR MEMBERSHIP if you want to see any current reports.
AFTER MARKET UPDATE - TUESDAY, JULY 21ST, 2020
Previous After Market Report Next After Market Report >>>
|
|
|
|
DOW |
+159.53 |
26,840.40 |
+0.60% |
|
Volume |
898,235,462 |
+14% |
|
Volume |
5,273,334,300 |
+24% |
|
NASDAQ |
-86.73 |
10,680.36 |
-0.81% |
|
Advancers |
2,255 |
76% |
|
Advancers |
2,047 |
63% |
|
S&P 500 |
+5.46 |
3,257.30 |
+0.17% |
|
Decliners |
700 |
24% |
|
Decliners |
1,198 |
37% |
|
Russell 2000 |
+19.56 |
1,487.51 |
+1.33% |
|
52 Wk Highs |
141 |
|
|
52 Wk Highs |
191 |
|
|
S&P 600 |
+17.51 |
859.38 |
+2.08% |
|
52 Wk Lows |
3 |
|
|
52 Wk Lows |
13 |
|
|
 |
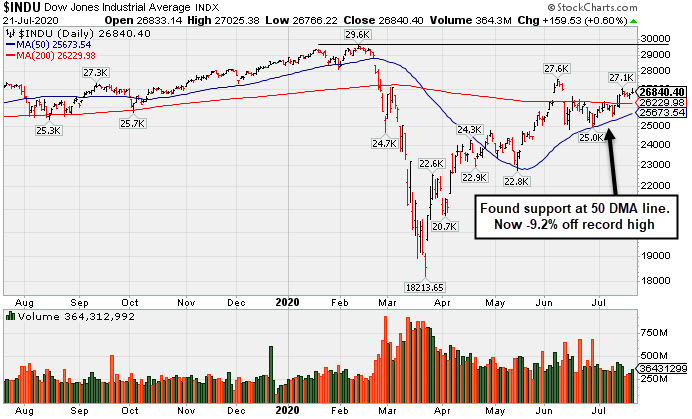
Major Indices Ended Mixed as Tech Weakness Pressured Nasdaq
Kenneth J. Gruneisen - Passed the CAN SLIM® Master's Exam
The Dow added 159 points, while the S&P 500 climbed 0.2%. The Nasdaq Composite bucked the uptrend, falling 0.8% a day after closing at a fresh record high. Advancers led decliners by a 3-1 margin on the NYSE and 5-3 on the Nasdaq exchange. The reported volume totals were higher than the prior session on the NYSE and on the Nasdaq exchange. There were 103 high-ranked companies from the Leaders List that hit new 52-week highs and were listed on the BreakOuts Page, versus the total of 89 on the prior session. New 52-week highs totals expanded and solidly outnumbered shrinking new 52-week lows totals on both the NYSE and the Nasdaq exchange. The major indices are in a confirmed uptrend (M criteria). Any sustainable rally requires a healthy crop of new leaders, so it remains ever-important to see substantial new highs totals. Charts used courtesy of www.stockcharts.com
PICTURED: The Dow Jones Industrial Average is perched -9.2% off its all-time high. It found support at its 50-day moving average (DMA) line during the recent consolidation.
U.S. equities finished mostly higher on Tuesday as investors digested generally upbeat corporate earnings results and stimulus updates. Seven of 11 S&P 500 sectors advanced, with the more economically sensitive cyclical stocks outperforming. The Energy group rose more than 6% as WTI crude gained 2.8% to $41.96/barrel on the NYMEX. Declines in mega-cap Technology and Tech-related companies limited the upside, with the oft-cited FAANG cohort losing 1.7%. In earnings, Coca-Cola (KO +2.34%) rose following its top line beat, however year-over-year sales declined roughly 29%. Elsewhere, Lockheed Martin (LMT +2.62%) after the defense contractor topped analyst earnings and sales estimates and lifted its full-year guidance. In other corporate news, Tesla (TSLA -4.54%) fell after being the subject of an analyst downgrade.
Global risk sentiment was supported following news the European Commission agreed on a stimulus package worth 750 billion euros. Meanwhile, U.S. lawmakers held discussions for the next coronavirus relief bill, which could range anywhere between $1 trillion to $3 trillion. The U.S. dollar index fell 0.8% against a basket of its peers, helping to lift gold by 1.3% to $1,841.70/ounce. Silver surged 7.2%, surpassing the $20/ounce level for the first time since 2016 on its third straight daily advance. On the data front, the Chicago Fed National Activity Index rose to an all-time high of 4.11 in June. Treasuries advanced with the yield on the 10-year note off one basis point to 0.60%.
|
 Kenneth J. Gruneisen started out as a licensed stockbroker in August 1987, a couple of months prior to the historic stock market crash that took the Dow Jones Industrial Average down -22.6% in a single day. He has published daily fact-based fundamental and technical analysis on high-ranked stocks online for two decades. Through FACTBASEDINVESTING.COM, Kenneth provides educational articles, news, market commentary, and other information regarding proven investment systems that work in good times and bad.
Comments contained in the body of this report are technical opinions only and are not necessarily those of Gruneisen Growth Corp. The material herein has been obtained from sources believed to be reliable and accurate, however, its accuracy and completeness cannot be guaranteed. Our firm, employees, and customers may effect transactions, including transactions contrary to any recommendation herein, or have positions in the securities mentioned herein or options with respect thereto. Any recommendation contained in this report may not be suitable for all investors and it is not to be deemed an offer or solicitation on our part with respect to the purchase or sale of any securities. |
|
 |
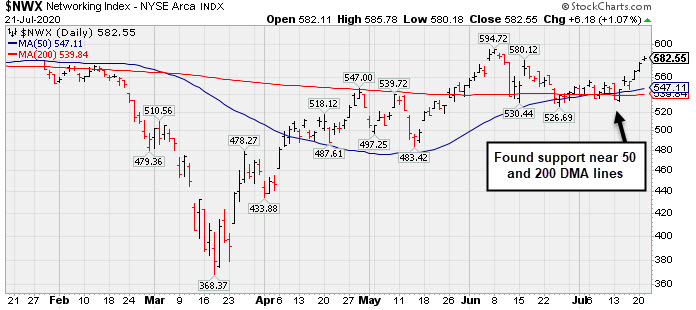
Energy-Linked Groups, Financial, and Networking Indexes Rose
Kenneth J. Gruneisen - Passed the CAN SLIM® Master's Exam
Energy-linked groups were standout gainers on Tuesday as the Oil Services Index ($OSX +6.88%) and Integrated Oil Index ($XOI +5.91%) both notched solid gains. The Gold & Silver Index ($XAU +1.56%) also rose. Financials had a positive bias as the Bank Index ($BKX +3.91%) and the Broker/Dealer Index ($XBD +1.44%) rose, meanwhile, the Retail Index ($RLX -0.82%) slumped. The Biotech Index ($BTK -2.60%) outpaced the Semiconductor Index ($SOX -0.66%) to the downside.
PICTURED: The Networking Index ($NWX +1.07%) posted a 3rd consecutive gain. It found support near the 50 and 200 DMA lines during the recent consolidation.
| Oil Services |
$OSX |
35.87 |
+2.31 |
+6.88% |
-54.18% |
| Integrated Oil |
$XOI |
790.61 |
+44.11 |
+5.91% |
-37.77% |
| Semiconductor |
$SOX |
2,096.59 |
-13.88 |
-0.66% |
+13.35% |
| Networking |
$NWX |
582.55 |
+6.18 |
+1.07% |
-0.15% |
| Broker/Dealer |
$XBD |
290.16 |
+4.12 |
+1.44% |
-0.08% |
| Retail |
$RLX |
3,294.08 |
-27.37 |
-0.82% |
+34.49% |
| Gold & Silver |
$XAU |
146.59 |
+2.25 |
+1.56% |
+37.10% |
| Bank |
$BKX |
75.27 |
+2.83 |
+3.91% |
-33.60% |
| Biotech |
$BTK |
5,983.33 |
-159.63 |
-2.60% |
+18.07% |
|
|
|
 |
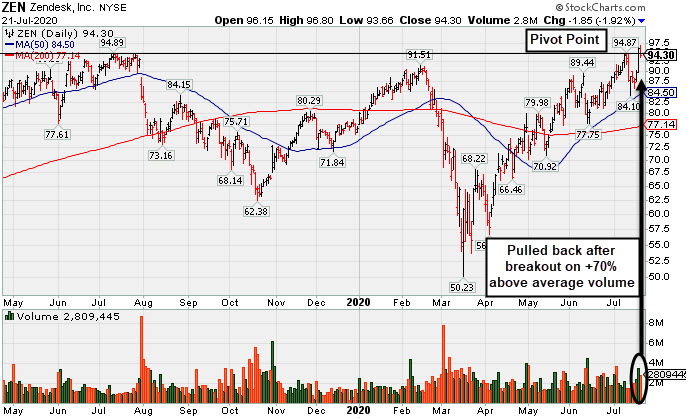
Pullback Below Pivot Point Following Breakout Gain
Kenneth J. Gruneisen - Passed the CAN SLIM® Master's Exam
Zendesk Inc (ZEN -$1.85 or -1.92% to $94.30) finished near the session low and raised some concerns as it fell back below its pivot point with a loss today after highlighted in yellow with pivot point cited based on its 7/10/20 high plus 10 cents in the earlier mid-day report (read here). It hit new 52-week and all-time highs (N criteria) on the prior session with a gain backed by +70% above average volume triggering a technical buy signal. Confirming volume-driven gains would be a reassuring sign of fresh institutional accumulation.
Quarterly earnings comparisons through Mar '20 have been above year ago periods by more than the +25% minimum guideline (C criteria). After years of shrinking losses it reported solid earnings in FY '18 and '19 (A criteria). Increasing institutional ownership (I criteria) is a reassuring sign. The number of top-rated funds owning its shares rose from 566 in Dec '19 to 601 in Jun '20. Its current Up/Down Volume Ratio of 1.7 is an unbiased indication its shares have been under accumulation overt the past 50 days. It has 114.2 million shares outstanding (S criteria).
ZEN has an A Timeliness Rating and a B Sponsorship Rating. It hails from the Computer Software-Enterprise group which is currently ranked 2nd among the 197 Industry Groups (L criteria).
|
|
|
Color Codes Explained :
Y - Better candidates highlighted by our
staff of experts.
G - Previously featured
in past reports as yellow but may no longer be buyable under the
guidelines.
***Last / Change / Volume data in this table is the closing quote data***
Symbol/Exchange
Company Name
Industry Group |
PRICE |
CHANGE
(%Change) |
Day High |
Volume
(% DAV)
(% 50 day avg vol) |
52 Wk Hi
% From Hi |
Featured
Date |
Price
Featured |
Pivot Featured |
|
Max Buy |
 FTNT
-
NASDAQ
FTNT
-
NASDAQ
Fortinet Inc
Computer Sftwr-Security
|
$133.66
|
-1.13
-0.84% |
$136.20
|
1,210,672
68.71% of 50 DAV
50 DAV is 1,762,000
|
$151.95
-12.04%
|
6/22/2020
|
$142.68
|
PP = $149.79
|
|
MB = $157.28
|
Most Recent Note - 7/20/2020 2:52:37 PM
G - Rebounding with today's gain backed by light volume after undercutting prior lows in the $128 area with last week's losses which raised concerns. A rebound above its 50 DMA line ($138) is needed for its outlook to improve.
>>> FEATURED STOCK ARTICLE : Best Ever Close With Volume-Driven Gain Approaching Pivot Point - 7/8/2020 |
View all notes |
Set NEW NOTE alert |
Company Profile |
SEC
News |
Chart |
Request a new note
C
A
S
I |
CRL
-
NYSE
Charles River Labs Intl
DRUGS - Biotechnology
|
$198.02
|
+0.08
0.04% |
$201.07
|
319,552
79.49% of 50 DAV
50 DAV is 402,000
|
$198.80
-0.39%
|
7/15/2020
|
$192.66
|
PP = $189.95
|
|
MB = $199.45
|
Most Recent Note - 7/20/2020 5:28:54 PM
Y - Posted a 2nd consecutive gain with lighter volume while approaching its "max buy" level. The prior high ($189.85 on 6/03/20) defines initial support to watch on pullbacks.
>>> FEATURED STOCK ARTICLE : Volume +71% Above Average Behind Breakout - 7/15/2020 |
View all notes |
Set NEW NOTE alert |
Company Profile |
SEC
News |
Chart |
Request a new note
C
A
S
I |
EBS
-
NYSE
Emergent Biosolutions
DRUGS - Biotechnology
|
$94.14
|
-7.92
-7.76% |
$96.32
|
2,144,472
324.92% of 50 DAV
50 DAV is 660,000
|
$107.16
-12.15%
|
7/7/2020
|
$89.47
|
PP = $93.68
|
|
MB = $98.36
|
 Most Recent Note - 7/21/2020 12:46:06 PM
Y - Gapped down today following a "negative reversal" on the prior session. Retreating below its "max buy" level and the color code is changed to yellow. Prior high ($93.58 on 6/01/20) defines initial support to watch above its 50 DMA line ($82.96). Fundamentals remain strong.
>>> FEATURED STOCK ARTICLE : Impressive Rebound to Hit a New High - 7/9/2020 |
View all notes |
Set NEW NOTE alert |
Company Profile |
SEC
News |
Chart |
Request a new note
C
A
S
I |
NBIX
-
NASDAQ
Neurocrine Biosciences
DRUGS - Biotechnology
|
$131.53
|
-2.41
-1.80% |
$134.35
|
440,402
48.88% of 50 DAV
50 DAV is 901,000
|
$136.27
-3.48%
|
5/19/2020
|
$123.71
|
PP = $119.75
|
|
MB = $125.74
|
Most Recent Note - 7/20/2020 2:56:21 PM
G - Matched its all-time high earlier with today's quiet gain. Its 50 DMA line ($122.78) and prior highs in the $119 area define important near-term support to watch. Fundamentals remain strong.
>>> FEATURED STOCK ARTICLE : Pulled Back Below "Max Buy" Level With Loss on Average Volume - 6/30/2020 |
View all notes |
Set NEW NOTE alert |
Company Profile |
SEC
News |
Chart |
Request a new note
C
A
S
I |
BMRN
-
NASDAQ
Biomarin Pharmaceutical
DRUGS - Drug Manufacturers - Other
|
$129.89
|
-1.14
-0.87% |
$131.95
|
761,648
46.87% of 50 DAV
50 DAV is 1,625,000
|
$131.73
-1.40%
|
6/17/2020
|
$110.95
|
PP = $112.67
|
|
MB = $118.30
|
Most Recent Note - 7/20/2020 2:13:30 PM
G - Hitting yet another new all-time high with today's 5th consecutive gain, getting more extended from any sound base. Fundamentals remain strong. Prior high ($112.57) and its 50 DMA line ($112.20) coincide defining near-term support to watch on pullbacks.
>>> FEATURED STOCK ARTICLE : Hovering Near High With Volume Totals Cooling - 7/10/2020 |
View all notes |
Set NEW NOTE alert |
Company Profile |
SEC
News |
Chart |
Request a new note
C
A
S
I |
Symbol/Exchange
Company Name
Industry Group |
PRICE |
CHANGE
(%Change) |
Day High |
Volume
(% DAV)
(% 50 day avg vol) |
52 Wk Hi
% From Hi |
Featured
Date |
Price
Featured |
Pivot Featured |
|
Max Buy |
AUDC
-
NASDAQ
Audiocodes Ltd
ELECTRONICS - Scientific and Technical Instrum
|
$39.01
|
-0.13
-0.33% |
$39.45
|
976,489
147.28% of 50 DAV
50 DAV is 663,000
|
$40.06
-2.62%
|
7/17/2020
|
$37.16
|
PP = $40.16
|
|
MB = $42.17
|
Most Recent Note - 7/20/2020 2:54:45 PM
Y - Challenging its 52-week high with today's 5th consecutive gain. Finished strong on the prior session after highlighted in yellow in the mid-day report with a new pivot point cited based on its 6/03/20 high plus 10 cents. Outlook improved after recovering above its 50 DMA line ($33.47). Subsequent gains above the pivot point backed by at least +40% above average volume are needed to trigger a technical buy signal. Completed a new Public Offering on 6/08/20. Fundamentals remain strong after it reported earnings +39% on +12% sales revenues for the Mar '20 quarter. Rebounded impressively after a deep pullback since dropped from the Featured Stocks list on 2/27/20.
>>> FEATURED STOCK ARTICLE : Resilient and High-Ranked VOIP Firm Rebounding Near Highs - 7/17/2020 |
View all notes |
Set NEW NOTE alert |
Company Profile |
SEC
News |
Chart |
Request a new note
C
A
S
I |
AMD
-
NASDAQ
Advanced Micro Devices
ELECTRONICS - Semiconductor - Broad Line
|
$57.00
|
-0.46
-0.80% |
$58.50
|
44,391,798
83.23% of 50 DAV
50 DAV is 53,336,000
|
$59.27
-3.83%
|
6/9/2020
|
$55.41
|
PP = $56.98
|
|
MB = $59.83
|
Most Recent Note - 7/20/2020 2:11:31 PM
Y - Consolidating above its 50 DMA line ($53.92). Prior low ($48.42 on 6/29/20) defines the next important support. Previously met stubborn resistance in the $57-59 area. Subsequent gains above the pivot point backed by at least +40% above average volume may trigger a technical buy signal.
>>> FEATURED STOCK ARTICLE : Slump Below 50-Day Average Toward Prior Low Raises Concerns - 6/26/2020 |
View all notes |
Set NEW NOTE alert |
Company Profile |
SEC
News |
Chart |
Request a new note
C
A
S
I |
TREX
-
NYSE
Trex Company Inc
MATERIALS and CONSTRUCTION - General Building Materials
|
$133.25
|
-3.02
-2.22% |
$136.01
|
516,016
51.86% of 50 DAV
50 DAV is 995,000
|
$138.34
-3.68%
|
6/26/2020
|
$109.05
|
PP = $132.94
|
|
MB = $139.59
|
Most Recent Note - 7/21/2020 5:42:24 PM
Y - Pulled back today with lighter volume after wedging to new all-time highs with 5 consecutive gains backed by below average volume. Gains above the pivot point must have at least +40% above average volume to trigger a proper new (or add-on) technical buy signal. Important near-term support is at its 50 DMA line ($122.98). Fundamentals remain strong.
>>> FEATURED STOCK ARTICLE : Quietly Perched Near All-Time High After Forming a New Base - 7/6/2020 |
View all notes |
Set NEW NOTE alert |
Company Profile |
SEC
News |
Chart |
Request a new note
C
A
S
I |
NFLX
-
NASDAQ
Netflix Inc
SPECIALTY RETAIL - Music and Video Stores
|
$490.10
|
-12.31
-2.45% |
$506.22
|
9,076,680
117.77% of 50 DAV
50 DAV is 7,707,000
|
$575.37
-14.82%
|
5/14/2020
|
$441.95
|
PP = $449.62
|
|
MB = $472.10
|
Most Recent Note - 7/20/2020 1:10:50 PM
G - Very extended from any sound base. Consolidating after reporting Jun '20 earnings +165% on +25% sales revenues versus the year ago period. Prior highs in the $458 area define near-term support along with its 50 DMA line ($455).
>>> FEATURED STOCK ARTICLE : Powered to New High on Prior Session With Volume Driven Gain - 7/2/2020 |
View all notes |
Set NEW NOTE alert |
Company Profile |
SEC
News |
Chart |
Request a new note
C
A
S
I |
CHGG
-
NYSE
Chegg Inc
Consumer Svcs-Education
|
$76.58
|
-0.36
-0.47% |
$77.64
|
2,262,315
61.66% of 50 DAV
50 DAV is 3,669,000
|
$77.90
-1.69%
|
6/17/2020
|
$63.71
|
PP = $68.08
|
|
MB = $71.48
|
Most Recent Note - 7/20/2020 2:03:06 PM
G - Color code is changed to green after rallying well above its "max buy" level with today's 4th consecutive gain. Prior high in the $68 area defines initial support to watch above its 50 DMA line ($64.89).
>>> FEATURED STOCK ARTICLE : Negative Reversal After Recently Wedging into New High Territory - 7/13/2020 |
View all notes |
Set NEW NOTE alert |
Company Profile |
SEC
News |
Chart |
Request a new note
C
A
S
I |
Symbol/Exchange
Company Name
Industry Group |
PRICE |
CHANGE
(%Change) |
Day High |
Volume
(% DAV)
(% 50 day avg vol) |
52 Wk Hi
% From Hi |
Featured
Date |
Price
Featured |
Pivot Featured |
|
Max Buy |
LGIH
-
NASDAQ
L G I Homes Inc
Bldg-Resident/Comml
|
$110.95
|
+0.03
0.03% |
$112.98
|
237,322
63.12% of 50 DAV
50 DAV is 376,000
|
$114.49
-3.09%
|
7/7/2020
|
$99.19
|
PP = $95.82
|
|
MB = $100.61
|
Most Recent Note - 7/20/2020 5:31:14 PM
G - Held its ground today perched near its all-time high following a recent streak of gains backed by light or average volume. Prior highs in the $95 area define initial support to watch on pullbacks.
>>> FEATURED STOCK ARTICLE : Breakout to New High Backed by 53% Above Average Volume - 7/7/2020 |
View all notes |
Set NEW NOTE alert |
Company Profile |
SEC
News |
Chart |
Request a new note
C
A
S
I |
NOW
-
NYSE
Servicenow Inc
Computer Sftwr-Enterprse
|
$437.22
|
-12.05
-2.68% |
$447.47
|
1,473,875
80.89% of 50 DAV
50 DAV is 1,822,000
|
$454.70
-3.84%
|
4/30/2020
|
$343.05
|
PP = $363.05
|
|
MB = $381.20
|
Most Recent Note - 7/21/2020 5:38:38 PM
G - Pulled back today with light volume after hitting a new all-time high on the prior session with a big gain backed by +72% above average volume. It has not formed a sound base. Its 50 DMA line ($396.80) defines important near-term support to watch where a violation may trigger a technical sell signal.
>>> FEATURED STOCK ARTICLE : Hovering Near All-Time High With Volume Totals Cooling - 6/25/2020 |
View all notes |
Set NEW NOTE alert |
Company Profile |
SEC
News |
Chart |
Request a new note
C
A
S
I |
TEAM
-
NASDAQ
Atlassian Corp Plc Cl A
Comp Sftwr-Spec Enterprs
|
$192.49
|
+2.17
1.14% |
$195.31
|
2,361,209
125.46% of 50 DAV
50 DAV is 1,882,000
|
$198.41
-2.98%
|
7/7/2020
|
$190.44
|
PP = $191.82
|
|
MB = $201.41
|
Most Recent Note - 7/20/2020 1:15:27 PM
Y - Today's big volume-driven gain has it rebounding above its 50 DMA line ($180) helping its outlook to improve and its color code is changed to yellow. Recent gains above the pivot point lacked the +40% above average volume necessary to trigger a convincing new (or add-on) technical buy signal. The prior low ($160.20 on 5/27/20) defines its next important support above prior highs in the $156 area.
>>> FEATURED STOCK ARTICLE : 50-Day Moving Average Defines Important Near-Term Support - 6/29/2020 |
View all notes |
Set NEW NOTE alert |
Company Profile |
SEC
News |
Chart |
Request a new note
C
A
S
I |
TTD
-
NASDAQ
The Trade Desk Inc Cl A
Comml Svcs-Advertising
|
$444.08
|
-13.57
-2.97% |
$461.35
|
902,863
46.47% of 50 DAV
50 DAV is 1,943,000
|
$475.67
-6.64%
|
6/3/2020
|
$340.61
|
PP = $327.35
|
|
MB = $343.72
|
Most Recent Note - 7/21/2020 5:44:06 PM
G - Hovering near its all-time high with volume totals cooling. Very extended from any sound base, and its 50 DMA line ($373) defines near-term support to watch. See the latest FSU analysis for more details and an annotated graph.
>>> FEATURED STOCK ARTICLE : Rebounded Near All-Time High With Gain Backed by Light Volume - 7/20/2020 |
View all notes |
Set NEW NOTE alert |
Company Profile |
SEC
News |
Chart |
Request a new note
C
A
S
I |
DOCU
-
NASDAQ
Docusign Inc
Computer Sftwr-Enterprse
|
$201.03
|
-0.96
-0.48% |
$204.87
|
3,935,219
69.85% of 50 DAV
50 DAV is 5,634,000
|
$217.00
-7.36%
|
6/10/2020
|
$149.73
|
PP = $152.10
|
|
MB = $159.71
|
Most Recent Note - 7/20/2020 2:14:55 PM
G - Very extended from any sound base. Its 50 DMA line ($158) defines near-term support to watch on pullbacks. DOCU is now priced +102% above its 200 DMA price, and it is taught in the Certification that a stock trading +70-100% or more above the 200 DMA is to be recognized as a "sell signal".
>>> FEATURED STOCK ARTICLE : Rally From Ascending Base Leaves Stock Very Extended - 7/1/2020 |
View all notes |
Set NEW NOTE alert |
Company Profile |
SEC
News |
Chart |
Request a new note
C
A
S
I |
Symbol/Exchange
Company Name
Industry Group |
PRICE |
CHANGE
(%Change) |
Day High |
Volume
(% DAV)
(% 50 day avg vol) |
52 Wk Hi
% From Hi |
Featured
Date |
Price
Featured |
Pivot Featured |
|
Max Buy |
PING
-
NYSE
Ping Identity Hldg Corp
Computer Sftwr-Security
|
$33.36
|
-1.45
-4.17% |
$35.79
|
1,187,415
73.16% of 50 DAV
50 DAV is 1,623,000
|
$35.36
-5.66%
|
6/1/2020
|
$29.24
|
PP = $29.90
|
|
MB = $31.40
|
Most Recent Note - 7/21/2020 5:40:17 PM
G - Had a "negative reversal" today after hitting a new all-time high. Prior highs in the $29 area and its 50 DMA line ($29.94) define important near-term support. Priced another Secondary Offering on 7/09/20 after an earlier Secondary Offering on 5/15/20. It did not form a sound base of sufficient length.
>>> FEATURED STOCK ARTICLE : Consolidating Above 50-Day Moving Average Following Secondary - 7/16/2020 |
View all notes |
Set NEW NOTE alert |
Company Profile |
SEC
News |
Chart |
Request a new note
C
A
S
I |
AAXN
-
NASDAQ
Axon Enterprise Inc
Security/Sfty
|
$92.11
|
-0.13
-0.14% |
$95.00
|
545,743
40.64% of 50 DAV
50 DAV is 1,343,000
|
$104.90
-12.19%
|
5/8/2020
|
$84.86
|
PP = $90.20
|
|
MB = $94.71
|
Most Recent Note - 7/20/2020 2:09:48 PM
Y - Found prompt support near prior highs and its 50 DMA line ($89.69). More damaging losses would raise concerns and trigger a technical sell signal. Completed a new Public Offering on 6/17/20.
>>> FEATURED STOCK ARTICLE : Managed Positive Reversal After Testing 50-Day Moving Average - 7/14/2020 |
View all notes |
Set NEW NOTE alert |
Company Profile |
SEC
News |
Chart |
Request a new note
C
A
S
I |
ZEN
-
NYSE
Zendesk Inc
Computer Sftwr-Enterprse
|
$94.30
|
-1.85
-1.92% |
$96.80
|
2,640,121
129.74% of 50 DAV
50 DAV is 2,035,000
|
$96.29
-2.07%
|
7/21/2020
|
$94.29
|
PP = $94.97
|
|
MB = $99.72
|
Most Recent Note - 7/21/2020 5:35:39 PM
Y - Finished with a loss today backed by +30% above average volume after highlighted in yellow with pivot point cited based on its 7/10/20 high plus 10 cents. It hit new 52-week and all-time highs on the prior session with a gain backed by +70% above average volume triggering a technical buy signal. Quarterly earnings comparisons through Mar '20 have been above year ago periods by more than the +25% minimum guideline (C criteria). After years of shrinking losses it reported solid earnings in FY '18 and '19 (A criteria). Increasing institutional ownership (I criteria) is a reassuring sign. See the latest FSU analysis for more details and a new annotated graph.
>>> FEATURED STOCK ARTICLE : Pullback Below Pivot Point Following Breakout Gain - 7/21/2020 |
View all notes |
Set NEW NOTE alert |
Company Profile |
SEC
News |
Chart |
Request a new note
C
A
S
I |
|
|
|
THESE ARE NOT BUY RECOMMENDATIONS!
Comments contained in the body of this report are technical
opinions only. The material herein has been obtained
from sources believed to be reliable and accurate, however,
its accuracy and completeness cannot be guaranteed.
This site is not an investment advisor, hence it does
not endorse or recommend any securities or other investments.
Any recommendation contained in this report may not
be suitable for all investors and it is not to be deemed
an offer or solicitation on our part with respect to
the purchase or sale of any securities. All trademarks,
service marks and trade names appearing in this report
are the property of their respective owners, and are
likewise used for identification purposes only.
This report is a service available
only to active Paid Premium Members.
You may opt-out of receiving report notifications
at any time. Questions or comments may be submitted
by writing to Premium Membership Services 665 S.E. 10 Street, Suite 201 Deerfield Beach, FL 33441-5634 or by calling 1-800-965-8307
or 954-785-1121.
|
|
|