You are not logged in.
This means you
CAN ONLY VIEW reports that were published prior to Saturday, February 24, 2024.
You
MUST UPGRADE YOUR MEMBERSHIP if you want to see any current reports.
AFTER MARKET UPDATE - WEDNESDAY, JULY 20TH, 2022
Previous After Market Report Next After Market Report >>>
|
|
|
|
DOW |
+47.79 |
31,874.84 |
+0.15% |
|
Volume |
938,556,481 |
+4% |
|
Volume |
5,404,100,200 |
+4% |
|
NASDAQ |
+184.50 |
11,897.65 |
+1.58% |
|
Advancers |
2,108 |
68% |
|
Advancers |
2,839 |
67% |
|
S&P 500 |
+23.21 |
3,959.90 |
+0.59% |
|
Decliners |
986 |
32% |
|
Decliners |
1,385 |
33% |
|
Russell 2000 |
+28.62 |
1,827.95 |
+1.59% |
|
52 Wk Highs |
13 |
|
|
52 Wk Highs |
45 |
|
|
S&P 600 |
+16.73 |
1,193.13 |
+1.42% |
|
52 Wk Lows |
31 |
|
|
52 Wk Lows |
61 |
|
|
 |
Breadth Positive as Major Indices Rose Again With Higher Volume
Kenneth J. Gruneisen - Passed the CAN SLIM® Master's Exam
The Dow rose 47 points, while the S&P 500 advanced 0.6%. Meanwhile, the Nasdaq Composite rallied 1.6% as growth-related shares outperformed. The volume totals reported were higher than the prior session on the NYSE and on the Nasdaq exchange. Breadth was positive as advancers led decliners by a 2-1 margin on the NYSE and on the Nasdaq exchange. There were 12 high-ranked companies from the Leaders List that hit new 52-week high and were listed on the BreakOuts Page, versus the total of 14 on the prior session. New 52-week lows totals still outnumbered new 52-week highs totals on the NYSE and on the Nasdaq exchange. The market uptrend is under pressure (M criteria). Any sustainable rally requires a healthy crop of leading stocks hitting new highs, but leadership has been very thin.
Chart courtesy of www.stockcharts.com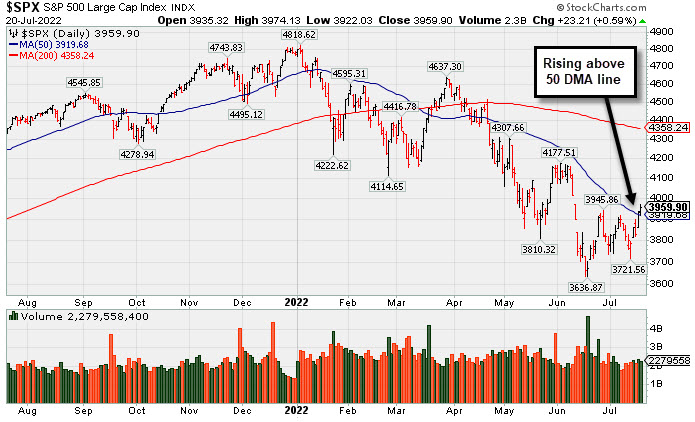 PICTURED: The S&P 500 Index is quietly rising above its 50-day moving average (DMA) line. It remains well below its 200 DMA line.
U.S. stocks finished higher on Wednesday as the latest round of corporate earnings buoyed risk sentiment. All three indices extended yesterday’s broad-based rally, which pushed each benchmark above their 50-day moving averages for the first time since April. Roughly 10% of S&P 500 companies reported earnings so far this quarter, with nearly 69% topping analyst expectations, according to FactSet.
Seven of 11 S&P 500 sectors closed in positive territory, with gains in Tech and Consumer Discretionary shares offsetting declines in defensive groups. In earnings, Netflix Inc. (NFLX +7.36%) rose after losing fewer than expected subscribers and projecting an increase of 1 million net new subscribers during the current period. Health Care stocks lagged with Elevance Health Inc. (ELV -7.62%), formerly known as Anthem, dropping as elevated medical costs overshadowed an upbeat profit tally. Meanwhile, Biogen Inc. (BIIB -5.80%) fell after missing revenue forecast.
Treasuries were mixed, with the yield on the 10-year note up one basis point (0.01%) to 3.03%. The yield curve remains inverted as recessionary concerns remain in focus. On the data front, MBA mortgage applications fell to a 22-year low in the latest week, while existing home sales dropped for a fifth straight month to a two-year low.
In commodities, West Texas Intermediate crude dipped 1.9% to $102.26/barrel despite weekly inventory data showing an unexpected drawdown in domestic crude stockpiles. Elsewhere, Russian President Putin suggested the Nord Stream pipeline (Europe’s primary conduit for gas flows) would soon resume operation, albeit with conditions.
|
 Kenneth J. Gruneisen started out as a licensed stockbroker in August 1987, a couple of months prior to the historic stock market crash that took the Dow Jones Industrial Average down -22.6% in a single day. He has published daily fact-based fundamental and technical analysis on high-ranked stocks online for two decades. Through FACTBASEDINVESTING.COM, Kenneth provides educational articles, news, market commentary, and other information regarding proven investment systems that work in good times and bad.
Comments contained in the body of this report are technical opinions only and are not necessarily those of Gruneisen Growth Corp. The material herein has been obtained from sources believed to be reliable and accurate, however, its accuracy and completeness cannot be guaranteed. Our firm, employees, and customers may effect transactions, including transactions contrary to any recommendation herein, or have positions in the securities mentioned herein or options with respect thereto. Any recommendation contained in this report may not be suitable for all investors and it is not to be deemed an offer or solicitation on our part with respect to the purchase or sale of any securities. |
|
 |
Retail, Broker/Dealer, Tech, and Integrated Oil Indexes Rose
Kenneth J. Gruneisen - Passed the CAN SLIM® Master's Exam
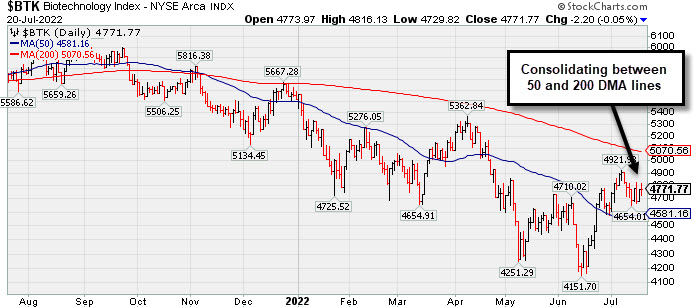
The Retail Index ($RLX +2.48%) posted an influential gain and the Broker/Dealer Index ($XBD +0.73%) also rose while the Bank Index ($BKX +0.04%) finished flat. The Semiconductor Index ($SOX +2.49%) led the tech sector higher and the Networking Index ($NWX +0.89%) posted a small gain while the Biotech Index ($BTK -0.05%) finished flat. Commodity-linked groups were mixed as the Gold & Silver Index ($XAU -2.69%) fell while the Oil Services Index ($OSX -0.02%) finished flat and the Integrated Oil Index ($XOI +1.11%) rose.
PICTURED: The Biotech Index ($BTK -0.05%) is consolidating above its 50-day moving average (DMA) line and below its 200 DMA line.
| Oil Services |
$OSX |
63.21 |
-0.01 |
-0.02% |
+19.89% |
| Integrated Oil |
$XOI |
1,498.69 |
+16.42 |
+1.11% |
+27.20% |
| Semiconductor |
$SOX |
2,872.96 |
+69.82 |
+2.49% |
-27.20% |
| Networking |
$NWX |
723.14 |
+6.37 |
+0.89% |
-25.53% |
| Broker/Dealer |
$XBD |
411.34 |
+3.00 |
+0.73% |
-15.51% |
| Retail |
$RLX |
3,202.63 |
+77.53 |
+2.48% |
-24.22% |
| Gold & Silver |
$XAU |
103.02 |
-2.85 |
-2.69% |
-22.22% |
| Bank |
$BKX |
107.14 |
+0.05 |
+0.04% |
-18.97% |
| Biotech |
$BTK |
4,771.77 |
-2.20 |
-0.05% |
-13.53% |
|
|
|
 |
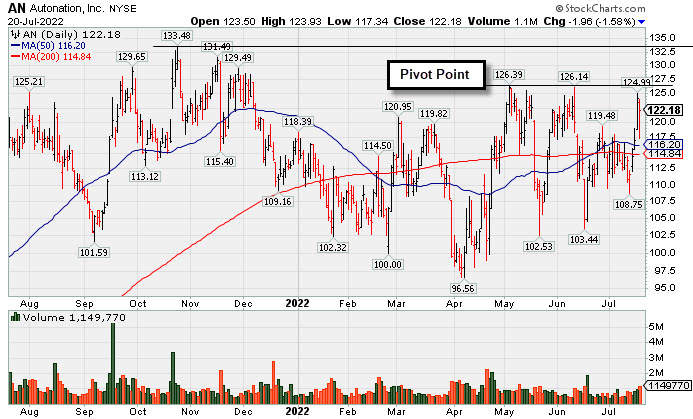
Autonation Earnings Due While Perched Near Pivot Point
Kenneth J. Gruneisen - Passed the CAN SLIM® Master's Exam
Autonation Inc (AN -$1.96 or -1.58% to $122.18) was highlighted in yellow with pivot point cited based on its 5/04/22 high plus 10 cents in the earlier mid-day report. Subsequent volume-driven gains above the pivot point may trigger a technical buy signal. It pulled back while perched within striking distance of prior highs in the $126 area, and it faces some resistance due to overhead supply up to the $133 level. Its recent rebound above its 50 and 200 DMA lines with volume-driven gains helped its outlook improve.
It has a 98 Earnings Per Share Rating. Keep in mind it is due to report Jun '22 quarterly results on 7/21/22. Volume and volatility often increase near earnings news. It reported Mar quarterly earnings +107% on +14% sales revenues versus the year ago period, its 7th very strong earnings comparison. Annual earnings growth has been strong.
AN hails from the Retail/Wholesale Automobile group which is currently ranked 49th on the 197 Industry Groups list (L criteria). It has 58.3 million shares outstanding (S criteria) which can contribute to greater price volatility in the event of institutional buying or selling. The number of top-rated funds owning its shares rose from 671 in Sep '21 to 720 in Jun '22, a reassuring sign concerning the I criteria. |
|
|
Color Codes Explained :
Y - Better candidates highlighted by our
staff of experts.
G - Previously featured
in past reports as yellow but may no longer be buyable under the
guidelines.
***Last / Change / Volume data in this table is the closing quote data***
Symbol/Exchange
Company Name
Industry Group |
PRICE |
CHANGE
(%Change) |
Day High |
Volume
(% DAV)
(% 50 day avg vol) |
52 Wk Hi
% From Hi |
Featured
Date |
Price
Featured |
Pivot Featured |
|
Max Buy |
 LLY
-
NYSE
LLY
-
NYSE
Eli Lilly & Co
Medical-Diversified
|
$322.03
|
-4.17
-1.28% |
$327.82
|
1,848,233
61.96% of 50 DAV
50 DAV is 2,983,000
|
$335.33
-3.97%
|
5/16/2022
|
$302.46
|
PP = $314.10
|
|
MB = $329.81
|
 Most Recent Note - 7/20/2022 6:47:07 PM
Y - Hovering near its all-time high with light volume totals in recent weeks. Its 50 DMA line ($309.42) defines near-term support to watch.
>>> FEATURED STOCK ARTICLE : Lilly Quietly Wedged to a New All-Time High This Week - 7/8/2022 |
View all notes |
Set NEW NOTE alert |
Company Profile |
SEC
News |
Chart |
Request a new note
C
A
S
I |
IMXI
-
NASDAQ
International Money Exp
Financial Svcs-Specialty
|
$22.50
|
+0.02
0.09% |
$22.70
|
408,404
102.61% of 50 DAV
50 DAV is 398,000
|
$22.94
-1.92%
|
7/1/2022
|
$21.27
|
PP = $21.38
|
|
MB = $22.45
|
Most Recent Note - 7/20/2022 6:45:44 PM
Y - Posted a 4th consecutive gain today with near average volume and closed 2 cents off its best ever close, perched near its 52-week high. Held its ground after it recently broke out of a "double bottom" base. Its 50 DMA line ($20.41) defines important near-term support to watch. Fundamentals through the Mar '22 quarter have been strong.
>>> FEATURED STOCK ARTICLE : Stalled Since Clearing Double Bottom Base - 7/15/2022 |
View all notes |
Set NEW NOTE alert |
Company Profile |
SEC
News |
Chart |
Request a new note
C
A
S
I |
HRMY
-
NASDAQ
Harmony Biosciences Hldg
Medical-Biomed/Biotech
|
$53.06
|
+0.45
0.86% |
$55.19
|
437,925
89.74% of 50 DAV
50 DAV is 488,000
|
$57.13
-7.12%
|
7/6/2022
|
$54.12
|
PP = $52.85
|
|
MB = $55.49
|
Most Recent Note - 7/20/2022 6:44:16 PM
Y - Posted a small gain today with lighter volume after a "positive reversal" on the prior session, showing resilience after undercutting recent lows in the $51.50 area. The prior session's low ($50.18) now defines important near-term support to watch above its 50 DMA line ($46.13).
>>> FEATURED STOCK ARTICLE : Harmony Has Been Encountering Distributional Pressure - 7/18/2022 |
View all notes |
Set NEW NOTE alert |
Company Profile |
SEC
News |
Chart |
Request a new note
C
A
S
I |
CI
-
NYSE
Cigna Corp
Medical-Managed Care
|
$266.72
|
-7.88
-2.87% |
$274.18
|
1,657,778
84.32% of 50 DAV
50 DAV is 1,966,000
|
$282.33
-5.53%
|
7/7/2022
|
$276.55
|
PP = $273.68
|
|
MB = $287.36
|
Most Recent Note - 7/20/2022 5:14:25 PM
Y - Suffered a big loss today with lighter (below average) volume. Undercutting prior highs in the $273 area and sinking near support at its 50 DMA line ($263) following the recent technical breakout. More damaging losses would raise greater concerns. See the latest FSU analysis for more details and an annotated graph.
>>> FEATURED STOCK ARTICLE : Pulled Back and Tested Support at 50-Day Moving Average - 7/19/2022 |
View all notes |
Set NEW NOTE alert |
Company Profile |
SEC
News |
Chart |
Request a new note
C
A
S
I |
AN
-
NYSE
Autonation Inc
SPECIALTY RETAIL - Auto Dealerships
|
$122.18
|
-1.96
-1.58% |
$123.93
|
1,149,770
154.54% of 50 DAV
50 DAV is 744,000
|
$133.48
-8.47%
|
7/20/2022
|
$122.03
|
PP = $126.49
|
|
MB = $132.81
|
Most Recent Note - 7/20/2022 6:42:42 PM
Y - Highlighted in yellow with pivot point cited based on its 5/04/22 high plus 10 cents in the earlier mid-day report. Subsequent volume-driven gains above the pivot point may trigger a technical buy signal. Due to report Jun '22 quarterly results on 7/21/22. Volume and volatility often increase near earnings news. Pulling back today while perched within striking distance of prior highs in the $126 area, and it faces some resistance due to overhead supply up to the $133 level. Rebounded above its 50 and 200 DMA lines with recent volume-driven gains. Reported Mar quarterly earnings +107% on +14% sales revenues versus the year ago period, its 7th very strong earnings comparison. Annual earnings growth has been strong. See the latest FSU analysis for more details and a new annotated graph.
>>> FEATURED STOCK ARTICLE : Autonation Earnings Due While Perched Near Pivot Point - 7/20/2022 |
View all notes |
Set NEW NOTE alert |
Company Profile |
SEC
News |
Chart |
Request a new note
C
A
S
I |
Symbol/Exchange
Company Name
Industry Group |
PRICE |
CHANGE
(%Change) |
Day High |
Volume
(% DAV)
(% 50 day avg vol) |
52 Wk Hi
% From Hi |
Featured
Date |
Price
Featured |
Pivot Featured |
|
Max Buy |
|
|
|
THESE ARE NOT BUY RECOMMENDATIONS!
Comments contained in the body of this report are technical
opinions only. The material herein has been obtained
from sources believed to be reliable and accurate, however,
its accuracy and completeness cannot be guaranteed.
This site is not an investment advisor, hence it does
not endorse or recommend any securities or other investments.
Any recommendation contained in this report may not
be suitable for all investors and it is not to be deemed
an offer or solicitation on our part with respect to
the purchase or sale of any securities. All trademarks,
service marks and trade names appearing in this report
are the property of their respective owners, and are
likewise used for identification purposes only.
This report is a service available
only to active Paid Premium Members.
You may opt-out of receiving report notifications
at any time. Questions or comments may be submitted
by writing to Premium Membership Services 665 S.E. 10 Street, Suite 201 Deerfield Beach, FL 33441-5634 or by calling 1-800-965-8307
or 954-785-1121.
|
|
|