You are not logged in.
This means you
CAN ONLY VIEW reports that were published prior to Monday, February 19, 2024.
You
MUST UPGRADE YOUR MEMBERSHIP if you want to see any current reports.
AFTER MARKET UPDATE - MONDAY, JULY 20TH, 2020
Previous After Market Report Next After Market Report >>>
|
|
|
|
DOW |
+8.92 |
26,680.87 |
+0.03% |
|
Volume |
785,400,445 |
-10% |
|
Volume |
4,239,215,900 |
-1% |
|
NASDAQ |
+262.62 |
10,765.81 |
+2.50% |
|
Advancers |
1,280 |
43% |
|
Advancers |
1,689 |
52% |
|
S&P 500 |
+27.11 |
3,251.84 |
+0.84% |
|
Decliners |
1,676 |
57% |
|
Decliners |
1,559 |
48% |
|
Russell 2000 |
-5.36 |
1,467.95 |
-0.36% |
|
52 Wk Highs |
113 |
|
|
52 Wk Highs |
179 |
|
|
S&P 600 |
-5.31 |
841.87 |
-0.63% |
|
52 Wk Lows |
10 |
|
|
52 Wk Lows |
17 |
|
|
 |
Major Indices Rose With Greater Leadership
Kenneth J. Gruneisen - Passed the CAN SLIM® Master's Exam
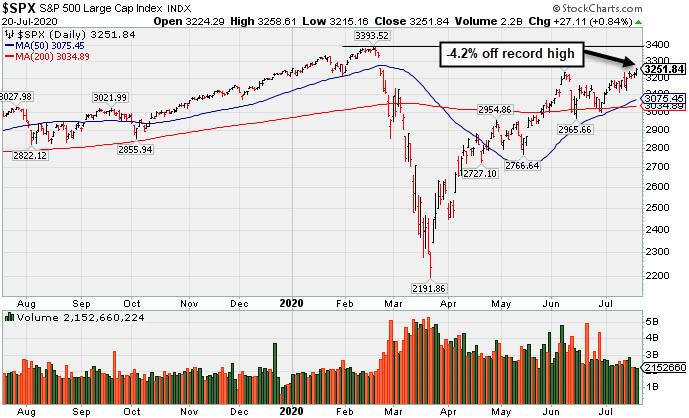
The Dow reversed an early session decline to rise 8 points, while the S&P 500 added 0.8%, now up 0.7% year-to-date. The Nasdaq Composite closed at a fresh all-time high, climbing 2.5% on strength in Tech and Tech-related shares. Decliners led advancers by a 4-3 margin on the NYSE, meanwhile advancers narrowly outnumbered decliners on the Nasdaq exchange. The reported volume totals were lighter than the prior session on the NYSE and on the Nasdaq exchange. There were 89 high-ranked companies from the Leaders List that hit new 52-week highs and were listed on the BreakOuts Page, versus the total of 60 on the prior session. New 52-week highs totals expanded and solidly outnumbered new 52-week lows totals on both the NYSE and the Nasdaq exchange. The major indices are in a confirmed uptrend (M criteria). Any sustainable rally requires a healthy crop of new leaders, so it remains ever-important to see substantial new highs totals. Charts used courtesy of www.stockcharts.com
PICTURED: The S&P 500 Index is perched -4.2% off its all-time high. Its 50-day moving average (DMA) line recently crossed above its 200 DMA line, a bullish technical indicator termed a "golden cross".
Stocks finished higher on Monday as investors eyed the possibility of additional fiscal stimulus and optimistic COVID-19 vaccine updates. Pfizer (PFE +0.69%) and German company BioNTech (BNTX +3.46%) both traded higher on more encouraging data surrounding their collaborative vaccine candidate, while AstraZeneca’s (AZN -3.96%) gains faded despite encouraging updates from its experimental vaccine. Meanwhile, Congress will debate a fresh coronavirus relief package this week, while across the pond, the European Union remains in the midst of negotiating another massive round of aid.
Eight of 11 S&P 500 sectors closed in negative territory, with Energy and Utilities leading decliners. The Consumer Discretionary and Technology groups were among the standouts, rebounding from last week’s underperformance. Amazon (AMZN +7.93%) rallied after being the subject of multiple Wall Street analyst price target increases. In M&A news, shares of Noble Energy (NBL +5.44%) after agreeing to be acquired by Chevron (CVX -2.20%) in a $5 billion all-stock deal, making it the largest takeover in the oil space since the start of the pandemic. In earnings, Halliburton (HAL +2.52%) after the oilfield services company posted a surprise quarterly profit.
Treasuries were little changed with the yield on the 10-year note down one basis point to 0.61%. In commodities, WTI crude rose 0.1% to $40.70/barrel, while COMEX gold gained 0.5% to $1,818.70/ounce.
|
 Kenneth J. Gruneisen started out as a licensed stockbroker in August 1987, a couple of months prior to the historic stock market crash that took the Dow Jones Industrial Average down -22.6% in a single day. He has published daily fact-based fundamental and technical analysis on high-ranked stocks online for two decades. Through FACTBASEDINVESTING.COM, Kenneth provides educational articles, news, market commentary, and other information regarding proven investment systems that work in good times and bad.
Comments contained in the body of this report are technical opinions only and are not necessarily those of Gruneisen Growth Corp. The material herein has been obtained from sources believed to be reliable and accurate, however, its accuracy and completeness cannot be guaranteed. Our firm, employees, and customers may effect transactions, including transactions contrary to any recommendation herein, or have positions in the securities mentioned herein or options with respect thereto. Any recommendation contained in this report may not be suitable for all investors and it is not to be deemed an offer or solicitation on our part with respect to the purchase or sale of any securities. |
|
 |
Retail, Tech, and Gold & Silver Indexes Rose
Kenneth J. Gruneisen - Passed the CAN SLIM® Master's Exam
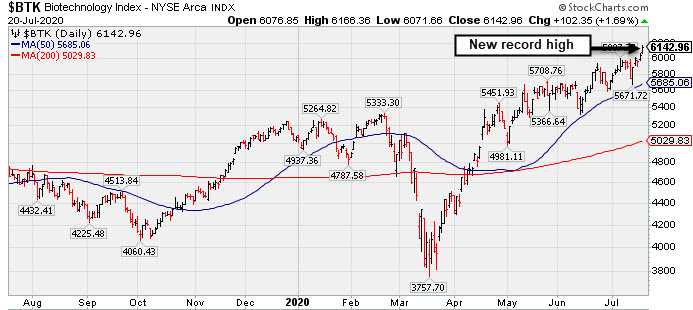
The Retail Index ($RLX +4.46%) posted a standout gain. The tech sector had a positive bias as the Semiconductor ($SOX +2.02%), Biotech ($BTK +1.69%), and the Networking ($NWX +1.57%) indexes each posted gains. The Broker/Dealer Index ($XBD +0.06%) finished flat but the Bank Index ($BKX -0.92%) suffered a loss. The Gold & Silver Index ($XAU +3.00%) notched a solid gain as the Oil Services Index ($OSX +0.27%) edged higher, meanwhile the Integrated Oil Index ($XOI -1.31%) was a standout decliner.
PICTURED: The Biotech Index ($BTK +1.69%) rallied to a new high.
| Oil Services |
$OSX |
33.56 |
+0.09 |
+0.27% |
-57.13% |
| Integrated Oil |
$XOI |
746.51 |
-9.92 |
-1.31% |
-41.25% |
| Semiconductor |
$SOX |
2,110.86 |
+41.87 |
+2.02% |
+14.12% |
| Networking |
$NWX |
576.37 |
+8.93 |
+1.57% |
-1.21% |
| Broker/Dealer |
$XBD |
286.04 |
+0.18 |
+0.06% |
-1.49% |
| Retail |
$RLX |
3,321.45 |
+141.88 |
+4.46% |
+35.61% |
| Gold & Silver |
$XAU |
144.36 |
+4.20 |
+3.00% |
+35.02% |
| Bank |
$BKX |
72.44 |
-0.67 |
-0.92% |
-36.10% |
| Biotech |
$BTK |
6,142.96 |
+102.35 |
+1.69% |
+21.22% |
|
|
|
 |
Rebounded Near All-Time High With Gain Backed by Light Volume
Kenneth J. Gruneisen - Passed the CAN SLIM® Master's Exam
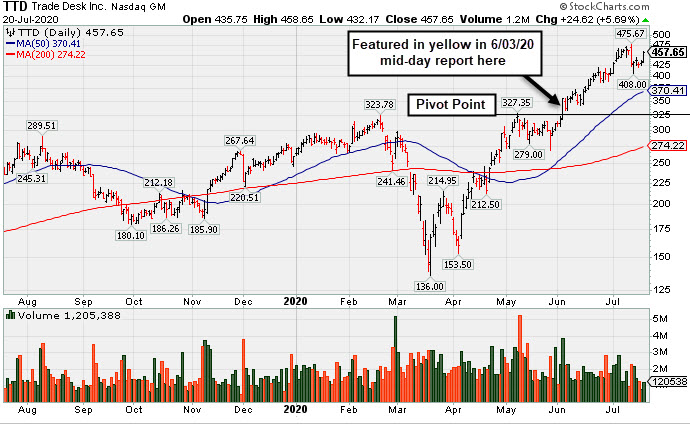
The Trade Desk Inc Cl A (TTD $457.65 +$24.62 +5.69% ) posted a big gain today with light volume, rallying toward its all-time high. It is very extended from any sound base. Its 50-day moving average (DMA) line ($370.41) defines near-term support to watch on pullbacks.
TTD traded up as much as +39.65% since highlighted in yellow with new pivot point cited based on its 5/07/20 high in the 6/03/20 mid-day report (read here). The Comml Svcs-Advertising firm was last shown in this FSU section on 6/24/20 with an annotated graph under the headline, "Pullback Breaks Streak of 8 Straight Gains Into New High Ground".
Fundamentals remain strong after it reported Mar '20 quarterly earnings +84% on +33% sales revenues, and 6 of the past 7 quarterly comparisons were above the +25% minimum earnings guideline (C criteria). Its annual earnings (A criteria) history has been strong, and it has a highest possible 99 Earnings Per Share Rating.
The number of top-rated funds owning its shares rose from 280 in Mar '18 to 689 in Mar '20, a reassuring sign concerning the I criteria. Its current Up/Down Volume Ratio of 1.8 is an unbiased indication its shares have been under accumulation over the past 50 days. It has a Timeliness Rating of A and a Sponsorship Rating of B. There are only 46.1 million shares outstanding (S criteria) which can contribute to greater volatility in the event of institutional buying or selling.
Charts courtesy of www.stockcharts.com
 |
|
|
Color Codes Explained :
Y - Better candidates highlighted by our
staff of experts.
G - Previously featured
in past reports as yellow but may no longer be buyable under the
guidelines.
***Last / Change / Volume data in this table is the closing quote data***
Symbol/Exchange
Company Name
Industry Group |
PRICE |
CHANGE
(%Change) |
Day High |
Volume
(% DAV)
(% 50 day avg vol) |
52 Wk Hi
% From Hi |
Featured
Date |
Price
Featured |
Pivot Featured |
|
Max Buy |
 FTNT
-
NASDAQ
FTNT
-
NASDAQ
Fortinet Inc
Computer Sftwr-Security
|
$134.79
|
+5.67
4.39% |
$135.13
|
1,297,212
70.39% of 50 DAV
50 DAV is 1,843,000
|
$151.95
-11.29%
|
6/22/2020
|
$142.68
|
PP = $149.79
|
|
MB = $157.28
|
 Most Recent Note - 7/20/2020 2:52:37 PM
G - Rebounding with today's gain backed by light volume after undercutting prior lows in the $128 area with last week's losses which raised concerns. A rebound above its 50 DMA line ($138) is needed for its outlook to improve.
>>> FEATURED STOCK ARTICLE : Best Ever Close With Volume-Driven Gain Approaching Pivot Point - 7/8/2020 |
View all notes |
Set NEW NOTE alert |
Company Profile |
SEC
News |
Chart |
Request a new note
C
A
S
I |
CRL
-
NYSE
Charles River Labs Intl
DRUGS - Biotechnology
|
$197.94
|
+1.68
0.86% |
$198.80
|
340,998
82.97% of 50 DAV
50 DAV is 411,000
|
$197.47
0.24%
|
7/15/2020
|
$192.66
|
PP = $189.95
|
|
MB = $199.45
|
Most Recent Note - 7/20/2020 5:28:54 PM
Y - Posted a 2nd consecutive gain with lighter volume while approaching its "max buy" level. The prior high ($189.85 on 6/03/20) defines initial support to watch on pullbacks.
>>> FEATURED STOCK ARTICLE : Volume +71% Above Average Behind Breakout - 7/15/2020 |
View all notes |
Set NEW NOTE alert |
Company Profile |
SEC
News |
Chart |
Request a new note
C
A
S
I |
EBS
-
NYSE
Emergent Biosolutions
DRUGS - Biotechnology
|
$102.06
|
-2.14
-2.05% |
$107.16
|
924,480
142.45% of 50 DAV
50 DAV is 649,000
|
$106.74
-4.38%
|
7/7/2020
|
$89.47
|
PP = $93.68
|
|
MB = $98.36
|
Most Recent Note - 7/20/2020 12:37:28 PM
G - Reversed today's early gain after getting extended from the latest base with 4 consecutive gains. Prior high ($93.58 on 6/01/20) defines initial support to watch. Fundamentals remain strong.
>>> FEATURED STOCK ARTICLE : Impressive Rebound to Hit a New High - 7/9/2020 |
View all notes |
Set NEW NOTE alert |
Company Profile |
SEC
News |
Chart |
Request a new note
C
A
S
I |
NBIX
-
NASDAQ
Neurocrine Biosciences
DRUGS - Biotechnology
|
$133.94
|
+3.42
2.62% |
$136.26
|
556,856
59.94% of 50 DAV
50 DAV is 929,000
|
$136.27
-1.71%
|
5/19/2020
|
$123.71
|
PP = $119.75
|
|
MB = $125.74
|
Most Recent Note - 7/20/2020 2:56:21 PM
G - Matched its all-time high earlier with today's quiet gain. Its 50 DMA line ($122.78) and prior highs in the $119 area define important near-term support to watch. Fundamentals remain strong.
>>> FEATURED STOCK ARTICLE : Pulled Back Below "Max Buy" Level With Loss on Average Volume - 6/30/2020 |
View all notes |
Set NEW NOTE alert |
Company Profile |
SEC
News |
Chart |
Request a new note
C
A
S
I |
BMRN
-
NASDAQ
Biomarin Pharmaceutical
DRUGS - Drug Manufacturers - Other
|
$131.03
|
+2.82
2.20% |
$131.73
|
1,113,603
68.40% of 50 DAV
50 DAV is 1,628,000
|
$130.04
0.76%
|
6/17/2020
|
$110.95
|
PP = $112.67
|
|
MB = $118.30
|
Most Recent Note - 7/20/2020 2:13:30 PM
G - Hitting yet another new all-time high with today's 5th consecutive gain, getting more extended from any sound base. Fundamentals remain strong. Prior high ($112.57) and its 50 DMA line ($112.20) coincide defining near-term support to watch on pullbacks.
>>> FEATURED STOCK ARTICLE : Hovering Near High With Volume Totals Cooling - 7/10/2020 |
View all notes |
Set NEW NOTE alert |
Company Profile |
SEC
News |
Chart |
Request a new note
C
A
S
I |
Symbol/Exchange
Company Name
Industry Group |
PRICE |
CHANGE
(%Change) |
Day High |
Volume
(% DAV)
(% 50 day avg vol) |
52 Wk Hi
% From Hi |
Featured
Date |
Price
Featured |
Pivot Featured |
|
Max Buy |
AUDC
-
NASDAQ
Audiocodes Ltd
ELECTRONICS - Scientific and Technical Instrum
|
$39.14
|
+1.43
3.79% |
$39.33
|
752,389
114.34% of 50 DAV
50 DAV is 658,000
|
$40.06
-2.30%
|
7/17/2020
|
$37.16
|
PP = $40.16
|
|
MB = $42.17
|
Most Recent Note - 7/20/2020 2:54:45 PM
Y - Challenging its 52-week high with today's 5th consecutive gain. Finished strong on the prior session after highlighted in yellow in the mid-day report with a new pivot point cited based on its 6/03/20 high plus 10 cents. Outlook improved after recovering above its 50 DMA line ($33.47). Subsequent gains above the pivot point backed by at least +40% above average volume are needed to trigger a technical buy signal. Completed a new Public Offering on 6/08/20. Fundamentals remain strong after it reported earnings +39% on +12% sales revenues for the Mar '20 quarter. Rebounded impressively after a deep pullback since dropped from the Featured Stocks list on 2/27/20.
>>> FEATURED STOCK ARTICLE : Resilient and High-Ranked VOIP Firm Rebounding Near Highs - 7/17/2020 |
View all notes |
Set NEW NOTE alert |
Company Profile |
SEC
News |
Chart |
Request a new note
C
A
S
I |
AMD
-
NASDAQ
Advanced Micro Devices
ELECTRONICS - Semiconductor - Broad Line
|
$57.46
|
+2.42
4.40% |
$57.53
|
44,729,850
83.74% of 50 DAV
50 DAV is 53,414,000
|
$59.27
-3.05%
|
6/9/2020
|
$55.41
|
PP = $56.98
|
|
MB = $59.83
|
Most Recent Note - 7/20/2020 2:11:31 PM
Y - Consolidating above its 50 DMA line ($53.92). Prior low ($48.42 on 6/29/20) defines the next important support. Previously met stubborn resistance in the $57-59 area. Subsequent gains above the pivot point backed by at least +40% above average volume may trigger a technical buy signal.
>>> FEATURED STOCK ARTICLE : Slump Below 50-Day Average Toward Prior Low Raises Concerns - 6/26/2020 |
View all notes |
Set NEW NOTE alert |
Company Profile |
SEC
News |
Chart |
Request a new note
C
A
S
I |
TREX
-
NYSE
Trex Company Inc
MATERIALS and CONSTRUCTION - General Building Materials
|
$136.27
|
+2.24
1.67% |
$138.34
|
759,877
76.22% of 50 DAV
50 DAV is 997,000
|
$135.32
0.70%
|
6/26/2020
|
$109.05
|
PP = $132.94
|
|
MB = $139.59
|
Most Recent Note - 7/20/2020 2:18:36 PM
Y - Wedging to new all-time highs today with its 5th consecutive gain backed by below average volume. Gains above the pivot point must have at least +40% above average volume to trigger a proper new (or add-on) technical buy signal. Important near-term support is at its 50 DMA line ($122.63). Fundamentals remain strong.
>>> FEATURED STOCK ARTICLE : Quietly Perched Near All-Time High After Forming a New Base - 7/6/2020 |
View all notes |
Set NEW NOTE alert |
Company Profile |
SEC
News |
Chart |
Request a new note
C
A
S
I |
NFLX
-
NASDAQ
Netflix Inc
SPECIALTY RETAIL - Music and Video Stores
|
$502.41
|
+9.42
1.91% |
$504.50
|
11,879,098
156.70% of 50 DAV
50 DAV is 7,581,000
|
$575.37
-12.68%
|
5/14/2020
|
$441.95
|
PP = $449.62
|
|
MB = $472.10
|
Most Recent Note - 7/20/2020 1:10:50 PM
G - Very extended from any sound base. Consolidating after reporting Jun '20 earnings +165% on +25% sales revenues versus the year ago period. Prior highs in the $458 area define near-term support along with its 50 DMA line ($455).
>>> FEATURED STOCK ARTICLE : Powered to New High on Prior Session With Volume Driven Gain - 7/2/2020 |
View all notes |
Set NEW NOTE alert |
Company Profile |
SEC
News |
Chart |
Request a new note
C
A
S
I |
CHGG
-
NYSE
Chegg Inc
Consumer Svcs-Education
|
$76.94
|
+3.94
5.40% |
$77.90
|
2,904,666
78.21% of 50 DAV
50 DAV is 3,714,000
|
$77.42
-0.62%
|
6/17/2020
|
$63.71
|
PP = $68.08
|
|
MB = $71.48
|
Most Recent Note - 7/20/2020 2:03:06 PM
G - Color code is changed to green after rallying well above its "max buy" level with today's 4th consecutive gain. Prior high in the $68 area defines initial support to watch above its 50 DMA line ($64.89).
>>> FEATURED STOCK ARTICLE : Negative Reversal After Recently Wedging into New High Territory - 7/13/2020 |
View all notes |
Set NEW NOTE alert |
Company Profile |
SEC
News |
Chart |
Request a new note
C
A
S
I |
Symbol/Exchange
Company Name
Industry Group |
PRICE |
CHANGE
(%Change) |
Day High |
Volume
(% DAV)
(% 50 day avg vol) |
52 Wk Hi
% From Hi |
Featured
Date |
Price
Featured |
Pivot Featured |
|
Max Buy |
LGIH
-
NASDAQ
L G I Homes Inc
Bldg-Resident/Comml
|
$110.92
|
-0.56
-0.50% |
$112.76
|
246,295
64.81% of 50 DAV
50 DAV is 380,000
|
$114.49
-3.12%
|
7/7/2020
|
$99.19
|
PP = $95.82
|
|
MB = $100.61
|
Most Recent Note - 7/20/2020 5:31:14 PM
G - Held its ground today perched near its all-time high following a recent streak of gains backed by light or average volume. Prior highs in the $95 area define initial support to watch on pullbacks.
>>> FEATURED STOCK ARTICLE : Breakout to New High Backed by 53% Above Average Volume - 7/7/2020 |
View all notes |
Set NEW NOTE alert |
Company Profile |
SEC
News |
Chart |
Request a new note
C
A
S
I |
NOW
-
NYSE
Servicenow Inc
Computer Sftwr-Enterprse
|
$449.27
|
+27.46
6.51% |
$454.70
|
3,113,591
171.64% of 50 DAV
50 DAV is 1,814,000
|
$430.83
4.28%
|
4/30/2020
|
$343.05
|
PP = $363.05
|
|
MB = $381.20
|
Most Recent Note - 7/20/2020 2:07:49 PM
G - Hitting yet another new all-time high with today's gain backed by above average volume. It has not formed a sound base. Its 50 DMA line ($395.51) defines important near-term support to watch where a violation may trigger a technical sell signal.
>>> FEATURED STOCK ARTICLE : Hovering Near All-Time High With Volume Totals Cooling - 6/25/2020 |
View all notes |
Set NEW NOTE alert |
Company Profile |
SEC
News |
Chart |
Request a new note
C
A
S
I |
TEAM
-
NASDAQ
Atlassian Corp Plc Cl A
Comp Sftwr-Spec Enterprs
|
$190.32
|
+17.46
10.10% |
$191.55
|
2,758,829
147.37% of 50 DAV
50 DAV is 1,872,000
|
$198.41
-4.08%
|
7/7/2020
|
$190.44
|
PP = $191.82
|
|
MB = $201.41
|
Most Recent Note - 7/20/2020 1:15:27 PM
Y - Today's big volume-driven gain has it rebounding above its 50 DMA line ($180) helping its outlook to improve and its color code is changed to yellow. Recent gains above the pivot point lacked the +40% above average volume necessary to trigger a convincing new (or add-on) technical buy signal. The prior low ($160.20 on 5/27/20) defines its next important support above prior highs in the $156 area.
>>> FEATURED STOCK ARTICLE : 50-Day Moving Average Defines Important Near-Term Support - 6/29/2020 |
View all notes |
Set NEW NOTE alert |
Company Profile |
SEC
News |
Chart |
Request a new note
C
A
S
I |
TTD
-
NASDAQ
The Trade Desk Inc Cl A
Comml Svcs-Advertising
|
$457.65
|
+24.62
5.69% |
$458.65
|
1,183,510
59.77% of 50 DAV
50 DAV is 1,980,000
|
$475.67
-3.79%
|
6/3/2020
|
$340.61
|
PP = $327.35
|
|
MB = $343.72
|
Most Recent Note - 7/20/2020 5:26:33 PM
G - Rebounded toward its all-time high with today's big gain on light volume. It is very extended from any sound base. Its 50 DMA line ($370.41) defines near-term support to watch. See the latest FSU analysis for more details and a new annotated graph.
>>> FEATURED STOCK ARTICLE : Rebounded Near All-Time High With Gain Backed by Light Volume - 7/20/2020 |
View all notes |
Set NEW NOTE alert |
Company Profile |
SEC
News |
Chart |
Request a new note
C
A
S
I |
DOCU
-
NASDAQ
Docusign Inc
Computer Sftwr-Enterprse
|
$201.99
|
+5.58
2.84% |
$202.91
|
4,302,776
76.52% of 50 DAV
50 DAV is 5,623,000
|
$217.00
-6.92%
|
6/10/2020
|
$149.73
|
PP = $152.10
|
|
MB = $159.71
|
Most Recent Note - 7/20/2020 2:14:55 PM
G - Very extended from any sound base. Its 50 DMA line ($158) defines near-term support to watch on pullbacks. DOCU is now priced +102% above its 200 DMA price, and it is taught in the Certification that a stock trading +70-100% or more above the 200 DMA is to be recognized as a "sell signal".
>>> FEATURED STOCK ARTICLE : Rally From Ascending Base Leaves Stock Very Extended - 7/1/2020 |
View all notes |
Set NEW NOTE alert |
Company Profile |
SEC
News |
Chart |
Request a new note
C
A
S
I |
Symbol/Exchange
Company Name
Industry Group |
PRICE |
CHANGE
(%Change) |
Day High |
Volume
(% DAV)
(% 50 day avg vol) |
52 Wk Hi
% From Hi |
Featured
Date |
Price
Featured |
Pivot Featured |
|
Max Buy |
PING
-
NYSE
Ping Identity Hldg Corp
Computer Sftwr-Security
|
$34.81
|
+3.16
9.98% |
$35.08
|
2,591,637
160.97% of 50 DAV
50 DAV is 1,610,000
|
$35.36
-1.56%
|
6/1/2020
|
$29.24
|
PP = $29.90
|
|
MB = $31.40
|
Most Recent Note - 7/20/2020 2:04:56 PM
G - Color code is changed to green after rebounding above its "max buy" level. Prior highs in the $29 area and its 50 DMA line ($29.77) define important near-term support. Priced another Secondary Offering on 7/09/20 after an earlier Secondary Offering on 5/15/20. It has not formed a sound base of sufficient length.
>>> FEATURED STOCK ARTICLE : Consolidating Above 50-Day Moving Average Following Secondary - 7/16/2020 |
View all notes |
Set NEW NOTE alert |
Company Profile |
SEC
News |
Chart |
Request a new note
C
A
S
I |
AAXN
-
NASDAQ
Axon Enterprise Inc
Security/Sfty
|
$92.24
|
+1.52
1.68% |
$93.40
|
670,655
49.83% of 50 DAV
50 DAV is 1,346,000
|
$104.90
-12.07%
|
5/8/2020
|
$84.86
|
PP = $90.20
|
|
MB = $94.71
|
Most Recent Note - 7/20/2020 2:09:48 PM
Y - Found prompt support near prior highs and its 50 DMA line ($89.69). More damaging losses would raise concerns and trigger a technical sell signal. Completed a new Public Offering on 6/17/20.
>>> FEATURED STOCK ARTICLE : Managed Positive Reversal After Testing 50-Day Moving Average - 7/14/2020 |
View all notes |
Set NEW NOTE alert |
Company Profile |
SEC
News |
Chart |
Request a new note
C
A
S
I |
|
|
|
THESE ARE NOT BUY RECOMMENDATIONS!
Comments contained in the body of this report are technical
opinions only. The material herein has been obtained
from sources believed to be reliable and accurate, however,
its accuracy and completeness cannot be guaranteed.
This site is not an investment advisor, hence it does
not endorse or recommend any securities or other investments.
Any recommendation contained in this report may not
be suitable for all investors and it is not to be deemed
an offer or solicitation on our part with respect to
the purchase or sale of any securities. All trademarks,
service marks and trade names appearing in this report
are the property of their respective owners, and are
likewise used for identification purposes only.
This report is a service available
only to active Paid Premium Members.
You may opt-out of receiving report notifications
at any time. Questions or comments may be submitted
by writing to Premium Membership Services 665 S.E. 10 Street, Suite 201 Deerfield Beach, FL 33441-5634 or by calling 1-800-965-8307
or 954-785-1121.
|
|
|