You are not logged in.
This means you
CAN ONLY VIEW reports that were published prior to Tuesday, February 20, 2024.
You
MUST UPGRADE YOUR MEMBERSHIP if you want to see any current reports.
AFTER MARKET UPDATE - THURSDAY, JULY 16TH, 2020
Previous After Market Report Next After Market Report >>>
|
|
|
|
DOW |
-135.39 |
26,734.71 |
-0.50% |
|
Volume |
776,902,615 |
-18% |
|
Volume |
4,226,915,300 |
-7% |
|
NASDAQ |
-76.66 |
10,473.83 |
-0.73% |
|
Advancers |
1,355 |
46% |
|
Advancers |
1,321 |
41% |
|
S&P 500 |
-10.99 |
3,215.57 |
-0.34% |
|
Decliners |
1,568 |
54% |
|
Decliners |
1,921 |
59% |
|
Russell 2000 |
-10.71 |
1,467.56 |
-0.72% |
|
52 Wk Highs |
58 |
|
|
52 Wk Highs |
80 |
|
|
S&P 600 |
-5.79 |
847.31 |
-0.68% |
|
52 Wk Lows |
6 |
|
|
52 Wk Lows |
12 |
|
|
 |
Major Indices Pulled Back With Lighter Volume Totals
Kenneth J. Gruneisen - Passed the CAN SLIM® Master's Exam
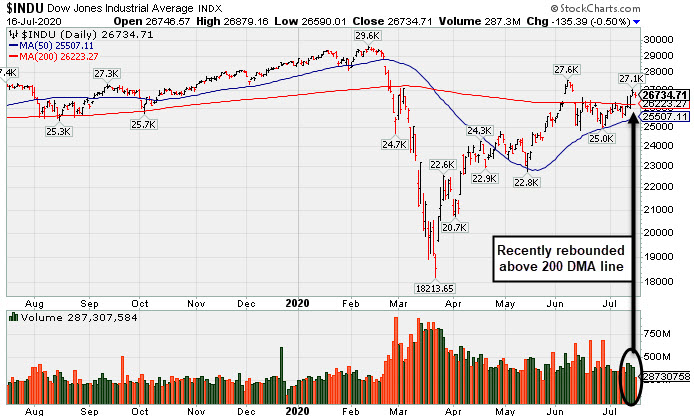
The Dow declined 135 points, snapping a four-session winning streak. Technology shares led the S&P 500 and Nasdaq Composite lower for the first time in three days, with the benchmarks slipping 0.3% and 0.7%, respectively. Breadth was negative as decliners led advancers by an 8-7 margin on the NYSE and 3-2 on the Nasdaq exchange. The reported volume totals were lighter than the prior session on the NYSE and on the Nasdaq exchange, indicative of light selling conviction coming from institutional investors. There were 43 high-ranked companies from the Leaders List that hit new 52-week highs and were listed on the BreakOuts Page, versus the total of 61 on the prior session. New 52-week highs totals contracted yet solidly outnumbered new 52-week lows totals which were in the single digits on the NYSE for a second consecutive session. The major indices are in a confirmed uptrend (M criteria). Any sustainable rally requires a healthy crop of new leaders, so it remains ever-important to see substantial new highs totals. Charts used courtesy of www.stockcharts.com
PICTURED: The Dow Jones Industrial Average recently rebounded above its 200-day moving average (DMA) line. It is -9.6% off its all-time high hit on February 12, 2020.
U.S. equities finished lower on Thursday as investors digested a handful of corporate earnings reports and parsed through economic releases. The more cyclical and value-oriented stocks extended their weekly gains over their growth peers, with the Utilities and Materials both ending in positive territory. The Information Technology sector lagged, with shares of Microsoft (MSFT -1.98%) and Apple (AAPL -1.23%) losing ground. In earnings, Morgan Stanley (MS +2.51%) rose after reporting record net revenue and net income figures amid strength in its trading division. Bank of America (BAC -2.72%) fell after posting a 52% drop in its quarterly profit. In the healthcare space, Johnson & Johnson (JNJ +0.67%) edged higher as investors weighed declining demand for the company’s medical devices against strength in the its pharmaceutical business and a boost to its full-year guidance. Stocks were thinly traded, with trading volume in the S&P 500 -27% below its 30-day average.
On the data front, U.S. retail sales increased 7.5% in June, above expectations but still slowing from May’s upwardly revised 18.2% record uptick. Another report showed initial jobless claims came in at 1.30 million in the week ended July 11, roughly unchanged from the previous period’s 1.31 million figure. A separate report showed homebuilder sentiment jumped to 72 in July, matching the March pre-pandemic reading. Treasuries were little changed, with the yield on the 10-year note holding steady at 0.62%.
|
 Kenneth J. Gruneisen started out as a licensed stockbroker in August 1987, a couple of months prior to the historic stock market crash that took the Dow Jones Industrial Average down -22.6% in a single day. He has published daily fact-based fundamental and technical analysis on high-ranked stocks online for two decades. Through FACTBASEDINVESTING.COM, Kenneth provides educational articles, news, market commentary, and other information regarding proven investment systems that work in good times and bad.
Comments contained in the body of this report are technical opinions only and are not necessarily those of Gruneisen Growth Corp. The material herein has been obtained from sources believed to be reliable and accurate, however, its accuracy and completeness cannot be guaranteed. Our firm, employees, and customers may effect transactions, including transactions contrary to any recommendation herein, or have positions in the securities mentioned herein or options with respect thereto. Any recommendation contained in this report may not be suitable for all investors and it is not to be deemed an offer or solicitation on our part with respect to the purchase or sale of any securities. |
|
 |
Financial, Retail, Tech, and Commodity-Linked Groups Fell
Kenneth J. Gruneisen - Passed the CAN SLIM® Master's Exam
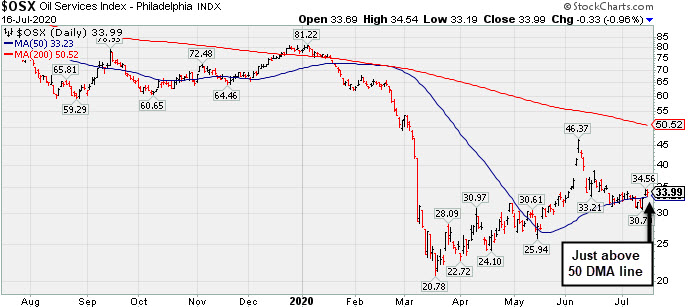
The Broker/Dealer ($XBD -0.64%) and Bank ($BKX -0.25%) both edged lower and the Retail ($RLX -0.11%) finished slightly in the red. The Gold & Silver ($XAU -1.46%) outpaced the Oil Services ($OSX -0.96%) and Integrated Oil ($XOI -0.68%) to the downside as commodity-linked groups had a negative bias. The Biotech ($BTK -0.53%) and Semiconductor ($SOX -0.40%) both edged lower and the Networking ($NWX -0.06%) finished flat.
PICTURED: The Oil Services ($OSX -0.96%) recently rebounded and is trading just above its 50-day moving average (DMA) line.
| Oil Services |
$OSX |
33.99 |
-0.33 |
-0.96% |
-56.58% |
| Integrated Oil |
$XOI |
767.38 |
-5.27 |
-0.68% |
-39.60% |
| Semiconductor |
$SOX |
2,055.92 |
-8.25 |
-0.40% |
+11.15% |
| Networking |
$NWX |
554.85 |
-0.34 |
-0.06% |
-4.89% |
| Broker/Dealer |
$XBD |
288.74 |
-1.85 |
-0.64% |
-0.57% |
| Retail |
$RLX |
3,200.80 |
-3.66 |
-0.11% |
+30.68% |
| Gold & Silver |
$XAU |
135.92 |
-2.01 |
-1.46% |
+27.12% |
| Bank |
$BKX |
74.96 |
-0.19 |
-0.25% |
-33.87% |
| Biotech |
$BTK |
5,971.07 |
-31.74 |
-0.53% |
+17.83% |
|
|
|
 |
Consolidating Above 50-Day Moving Average Following Secondary
Kenneth J. Gruneisen - Passed the CAN SLIM® Master's Exam
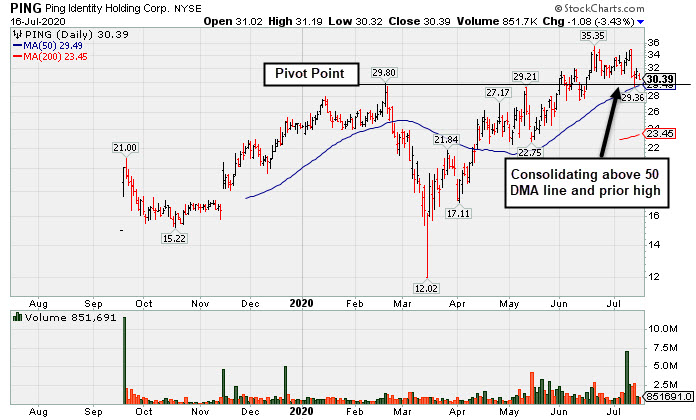
Ping Identity Hldg Corp (PING -$1.08 or -3.43% to $30.39) abruptly retreated from its all-time high with a big loss on 7/13/20 backed by above average volume. The company priced another Secondary Offering on 7/09/20 after an earlier Secondary Offering on 5/15/20. It has not formed a sound base of sufficient length. Prior highs in the $29 area define initial support to watch above its 50-day moving average (DMA) line ($29.49).
PING was highlighted in yellow with new pivot point cited based on its 2/20/20 high plus 10 cents in the 6/01/20 mid-day report (read here). The gain above the pivot point on 6/18/20 was backed by +127% above average volume triggering a technical buy signal as it hit a new 52-week high (N criteria). It was last shown in this FSU section on 6/22/20 with an annotated graph under the headline, "Gain for Recent New High Backed by +71% Above Average Volume".
Its $15 IPO was completed on 9/19/19. The number of top-rated funds owning its shares rose from 83 in Sep '19 to 181 in Jun '20, a reassuring sign concerning the I criteria. Its current Up/Down Volume Ratio of 1.4 is an unbiased indication its shares have been under accumulation over the past 50 days.
The Computer Software-Security firm is due to report Jun '20 quarterly results on 7/28/20. It has reported strong earnings results well above the +25% minimum guideline (C criteria) in the 4 latest quarterly comparisons through Mar '20 versus the year ago periods. Limited earnings history is a concern, however, leadership in the Computer Software - Security industry group (L criteria) is a reassuring sign. The groups is currently ranked 20th of the 197 industry groups.
|
|
|
Color Codes Explained :
Y - Better candidates highlighted by our
staff of experts.
G - Previously featured
in past reports as yellow but may no longer be buyable under the
guidelines.
***Last / Change / Volume data in this table is the closing quote data***
Symbol/Exchange
Company Name
Industry Group |
PRICE |
CHANGE
(%Change) |
Day High |
Volume
(% DAV)
(% 50 day avg vol) |
52 Wk Hi
% From Hi |
Featured
Date |
Price
Featured |
Pivot Featured |
|
Max Buy |
 FTNT
-
NASDAQ
FTNT
-
NASDAQ
Fortinet Inc
Computer Sftwr-Security
|
$127.35
|
-1.97
-1.52% |
$128.50
|
1,637,567
88.95% of 50 DAV
50 DAV is 1,841,000
|
$151.95
-16.19%
|
6/22/2020
|
$142.68
|
PP = $149.79
|
|
MB = $157.28
|
Most Recent Note - 7/15/2020 7:28:50 PM
G - Undercut prior lows in the $128 area with today's damaging volume-driven loss raising greater concerns. A rebound above its 50 DMA line ($137.32) is needed for its outlook to improve.
>>> FEATURED STOCK ARTICLE : Best Ever Close With Volume-Driven Gain Approaching Pivot Point - 7/8/2020 |
View all notes |
Set NEW NOTE alert |
Company Profile |
SEC
News |
Chart |
Request a new note
C
A
S
I |
CRL
-
NYSE
Charles River Labs Intl
DRUGS - Biotechnology
|
$190.70
|
-2.75
-1.42% |
$193.20
|
381,465
93.73% of 50 DAV
50 DAV is 407,000
|
$195.15
-2.28%
|
7/15/2020
|
$192.66
|
PP = $189.95
|
|
MB = $199.45
|
Most Recent Note - 7/15/2020 7:23:32 PM
Y - Finished strong after highlighted in yellow in the earlier mid-day report with a pivot point cited based on its 6/03/20 high plus 10 cents. Hit a new all-time high and closed above the pivot point with s solid gain backed by +71% above average volume triggering a proper technical buy signal. Reported earnings +31% on +17% sales revenues for the Mar '20 quarter, its 2nd quarterly earnings increase above the +25% minimum guideline (C criteria) of the fact-based investment system. It has a 96 Earnings Per Share Rating. Sequential quarterly comparisons show encouraging sales revenues and earnings acceleration. Annual earnings (A criteria) history has been strong and steady. See the latest FSU analysis for more details and a new annotated graph.
>>> FEATURED STOCK ARTICLE : Volume +71% Above Average Behind Breakout - 7/15/2020 |
View all notes |
Set NEW NOTE alert |
Company Profile |
SEC
News |
Chart |
Request a new note
C
A
S
I |
EBS
-
NYSE
Emergent Biosolutions
DRUGS - Biotechnology
|
$99.47
|
+1.31
1.33% |
$99.63
|
590,438
93.42% of 50 DAV
50 DAV is 632,000
|
$101.34
-1.85%
|
7/7/2020
|
$89.47
|
PP = $93.68
|
|
MB = $98.36
|
 Most Recent Note - 7/16/2020 6:29:37 PM
G - Color code is changed to green after rising above its "max buy" level for a best ever close with today's gain on below average volume. Recent gains above the new pivot point cited lacked great volume conviction. No resistance remains due to overhead supply. Fundamentals remain strong.
>>> FEATURED STOCK ARTICLE : Impressive Rebound to Hit a New High - 7/9/2020 |
View all notes |
Set NEW NOTE alert |
Company Profile |
SEC
News |
Chart |
Request a new note
C
A
S
I |
NBIX
-
NASDAQ
Neurocrine Biosciences
DRUGS - Biotechnology
|
$133.37
|
-1.78
-1.32% |
$134.78
|
585,051
63.39% of 50 DAV
50 DAV is 923,000
|
$136.27
-2.13%
|
5/19/2020
|
$123.71
|
PP = $119.75
|
|
MB = $125.74
|
Most Recent Note - 7/15/2020 7:31:39 PM
G - Gapped up and posted a solid gain today with near average volume for its best ever close. Its 50 DMA line ($121.11) and prior highs in the $119 area define important near-term support to watch. Fundamentals remain strong.
>>> FEATURED STOCK ARTICLE : Pulled Back Below "Max Buy" Level With Loss on Average Volume - 6/30/2020 |
View all notes |
Set NEW NOTE alert |
Company Profile |
SEC
News |
Chart |
Request a new note
C
A
S
I |
BMRN
-
NASDAQ
Biomarin Pharmaceutical
DRUGS - Drug Manufacturers - Other
|
$127.78
|
+1.04
0.82% |
$128.63
|
1,068,053
65.44% of 50 DAV
50 DAV is 1,632,000
|
$130.04
-1.74%
|
6/17/2020
|
$110.95
|
PP = $112.67
|
|
MB = $118.30
|
Most Recent Note - 7/14/2020 5:29:06 PM
G - Managed a "positive reversal" today and it remains perched near its all-time high, very extended from any sound base. Fundamentals remain strong. Prior high ($112.57) and its 50 DMA line ($109.34) define near-term support to watch on pullbacks.
>>> FEATURED STOCK ARTICLE : Hovering Near High With Volume Totals Cooling - 7/10/2020 |
View all notes |
Set NEW NOTE alert |
Company Profile |
SEC
News |
Chart |
Request a new note
C
A
S
I |
Symbol/Exchange
Company Name
Industry Group |
PRICE |
CHANGE
(%Change) |
Day High |
Volume
(% DAV)
(% 50 day avg vol) |
52 Wk Hi
% From Hi |
Featured
Date |
Price
Featured |
Pivot Featured |
|
Max Buy |
AMD
-
NASDAQ
Advanced Micro Devices
ELECTRONICS - Semiconductor - Broad Line
|
$54.92
|
-0.42
-0.76% |
$55.15
|
36,790,883
68.04% of 50 DAV
50 DAV is 54,076,000
|
$59.27
-7.34%
|
6/9/2020
|
$55.41
|
PP = $56.98
|
|
MB = $59.83
|
Most Recent Note - 7/14/2020 5:34:14 PM
Y - Managed a "positive reversal" today after undercutting its 50 DMA line ($53.66). Previously met stubborn resistance in the $57-59 area. Subsequent gains above the pivot point backed by at least +40% above average volume may trigger a technical buy signal.
>>> FEATURED STOCK ARTICLE : Slump Below 50-Day Average Toward Prior Low Raises Concerns - 6/26/2020 |
View all notes |
Set NEW NOTE alert |
Company Profile |
SEC
News |
Chart |
Request a new note
C
A
S
I |
TREX
-
NYSE
Trex Company Inc
MATERIALS and CONSTRUCTION - General Building Materials
|
$132.59
|
+0.50
0.38% |
$134.20
|
524,904
50.47% of 50 DAV
50 DAV is 1,040,000
|
$135.32
-2.02%
|
6/26/2020
|
$109.05
|
PP = $132.94
|
|
MB = $139.59
|
Most Recent Note - 7/14/2020 5:27:09 PM
Y - Posted a solid gain today with light volume. Remains perched near its all-time high. Subsequent volume-driven gains and a close above the pivot point may clinch a new (or add-on) technical buy signal. Important near-term support is at its 50 DMA line ($120.55). Fundamentals remain strong.
>>> FEATURED STOCK ARTICLE : Quietly Perched Near All-Time High After Forming a New Base - 7/6/2020 |
View all notes |
Set NEW NOTE alert |
Company Profile |
SEC
News |
Chart |
Request a new note
C
A
S
I |
NFLX
-
NASDAQ
Netflix Inc
SPECIALTY RETAIL - Music and Video Stores
|
$527.39
|
+4.13
0.79% |
$535.54
|
23,117,173
337.48% of 50 DAV
50 DAV is 6,850,000
|
$575.37
-8.34%
|
5/14/2020
|
$441.95
|
PP = $449.62
|
|
MB = $472.10
|
Most Recent Note - 7/16/2020 1:08:28 PM
G - Very extended from any sound base, consolidating near its all-time high following a big volume-driven gain on 7/10/20. Prior highs in the $458 area define near-term support above its 50 DMA line ($453).
>>> FEATURED STOCK ARTICLE : Powered to New High on Prior Session With Volume Driven Gain - 7/2/2020 |
View all notes |
Set NEW NOTE alert |
Company Profile |
SEC
News |
Chart |
Request a new note
C
A
S
I |
CHGG
-
NYSE
Chegg Inc
Consumer Svcs-Education
|
$71.00
|
+0.09
0.13% |
$71.63
|
1,572,236
33.18% of 50 DAV
50 DAV is 4,739,000
|
$77.42
-8.29%
|
6/17/2020
|
$63.71
|
PP = $68.08
|
|
MB = $71.48
|
Most Recent Note - 7/13/2020 6:29:50 PM
Y - Color code is changed to yellow after pulling back below its "max buy" level with today's loss on average volume. Prior high in the $68 area defines initial support to watch on pullbacks. See the latest FSU analysis for more details and a new annotated graph.
>>> FEATURED STOCK ARTICLE : Negative Reversal After Recently Wedging into New High Territory - 7/13/2020 |
View all notes |
Set NEW NOTE alert |
Company Profile |
SEC
News |
Chart |
Request a new note
C
A
S
I |
LGIH
-
NASDAQ
L G I Homes Inc
Bldg-Resident/Comml
|
$110.16
|
+0.76
0.69% |
$111.43
|
208,133
52.56% of 50 DAV
50 DAV is 396,000
|
$111.00
-0.76%
|
7/7/2020
|
$99.19
|
PP = $95.82
|
|
MB = $100.61
|
Most Recent Note - 7/15/2020 7:30:10 PM
G - Rallied further above its "max buy" level with another big gain today on only +7% above average volume. Prior highs in the $95 area define initial support to watch following its recent technical breakout.
>>> FEATURED STOCK ARTICLE : Breakout to New High Backed by 53% Above Average Volume - 7/7/2020 |
View all notes |
Set NEW NOTE alert |
Company Profile |
SEC
News |
Chart |
Request a new note
C
A
S
I |
Symbol/Exchange
Company Name
Industry Group |
PRICE |
CHANGE
(%Change) |
Day High |
Volume
(% DAV)
(% 50 day avg vol) |
52 Wk Hi
% From Hi |
Featured
Date |
Price
Featured |
Pivot Featured |
|
Max Buy |
NOW
-
NYSE
Servicenow Inc
Computer Sftwr-Enterprse
|
$413.88
|
-9.68
-2.29% |
$418.26
|
1,444,689
77.21% of 50 DAV
50 DAV is 1,871,000
|
$430.83
-3.93%
|
4/30/2020
|
$343.05
|
PP = $363.05
|
|
MB = $381.20
|
Most Recent Note - 7/16/2020 6:31:26 PM
G - Pulled back from its all-time high with a gap down and loss today on below average volume. It has not formed a sound base. Its 50 DMA line ($393) defines important near-term support to watch where a violation may trigger a technical sell signal.
>>> FEATURED STOCK ARTICLE : Hovering Near All-Time High With Volume Totals Cooling - 6/25/2020 |
View all notes |
Set NEW NOTE alert |
Company Profile |
SEC
News |
Chart |
Request a new note
C
A
S
I |
TEAM
-
NASDAQ
Atlassian Corp Plc Cl A
Comp Sftwr-Spec Enterprs
|
$171.24
|
-4.08
-2.33% |
$175.00
|
1,934,382
100.64% of 50 DAV
50 DAV is 1,922,000
|
$198.41
-13.69%
|
7/7/2020
|
$190.44
|
PP = $191.82
|
|
MB = $201.41
|
Most Recent Note - 7/16/2020 6:27:13 PM
G - Slumped further below its 50 DMA line ($179.85) with today's loss on average volume. A rebound above the 50 DMA line is needed for its outlook to improve after recently triggering a technical sell signal. Recent gains above the pivot point lacked the +40% above average volume necessary to trigger a convincing new (or add-on) technical buy signal. The prior low ($160.20 on 5/27/20) defines its next important support above prior highs in the $156 area.
>>> FEATURED STOCK ARTICLE : 50-Day Moving Average Defines Important Near-Term Support - 6/29/2020 |
View all notes |
Set NEW NOTE alert |
Company Profile |
SEC
News |
Chart |
Request a new note
C
A
S
I |
TTD
-
NASDAQ
The Trade Desk Inc Cl A
Comml Svcs-Advertising
|
$429.11
|
-7.26
-1.66% |
$432.75
|
1,264,462
61.47% of 50 DAV
50 DAV is 2,057,000
|
$475.67
-9.79%
|
6/3/2020
|
$340.61
|
PP = $327.35
|
|
MB = $343.72
|
Most Recent Note - 7/13/2020 6:49:47 PM
G - Suffered a "negative reversal today after hitting a new all-time high. Very extended from any sound base. Its 50 DMA line ($356.80) defines near-term support to watch.
>>> FEATURED STOCK ARTICLE : Pullback Breaks Streak of 8 Straight Gains Into New High Ground - 6/24/2020 |
View all notes |
Set NEW NOTE alert |
Company Profile |
SEC
News |
Chart |
Request a new note
C
A
S
I |
DOCU
-
NASDAQ
Docusign Inc
Computer Sftwr-Enterprse
|
$191.72
|
-1.11
-0.58% |
$193.50
|
3,754,737
67.22% of 50 DAV
50 DAV is 5,586,000
|
$217.00
-11.65%
|
6/10/2020
|
$149.73
|
PP = $152.10
|
|
MB = $159.71
|
Most Recent Note - 7/14/2020 12:37:07 PM
G - Abruptly retreated with a big loss on above average volume on the prior session. Very extended from any sound base. Its 50 DMA line ($151.33) defines near-term support to watch on pullbacks. DOCU is now priced +99% above its 200 DMA price, and it is taught in the Certification that a stock trading +70-100% or more above the 200 DMA is to be recognized as a "sell signal".
>>> FEATURED STOCK ARTICLE : Rally From Ascending Base Leaves Stock Very Extended - 7/1/2020 |
View all notes |
Set NEW NOTE alert |
Company Profile |
SEC
News |
Chart |
Request a new note
C
A
S
I |
PING
-
NYSE
Ping Identity Hldg Corp
Computer Sftwr-Security
|
$30.39
|
-1.08
-3.43% |
$31.20
|
851,281
52.87% of 50 DAV
50 DAV is 1,610,000
|
$35.36
-14.06%
|
6/1/2020
|
$29.24
|
PP = $29.90
|
|
MB = $31.40
|
Most Recent Note - 7/16/2020 6:20:27 PM
Y - Color code is changed to yellow while consolidating above its prior highs in the $29 area and its 50 DMA line ($29.49) which define important near-term support. Priced another Secondary Offering on 7/09/20 after an earlier Secondary Offering on 5/15/20. It has not formed a sound base of sufficient length. See the latest FSU analysis for more details and a new annotated graph.
>>> FEATURED STOCK ARTICLE : Consolidating Above 50-Day Moving Average Following Secondary - 7/16/2020 |
View all notes |
Set NEW NOTE alert |
Company Profile |
SEC
News |
Chart |
Request a new note
C
A
S
I |
Symbol/Exchange
Company Name
Industry Group |
PRICE |
CHANGE
(%Change) |
Day High |
Volume
(% DAV)
(% 50 day avg vol) |
52 Wk Hi
% From Hi |
Featured
Date |
Price
Featured |
Pivot Featured |
|
Max Buy |
AAXN
-
NASDAQ
Axon Enterprise Inc
Security/Sfty
|
$91.08
|
-1.56
-1.68% |
$92.35
|
446,245
33.06% of 50 DAV
50 DAV is 1,350,000
|
$104.90
-13.17%
|
5/8/2020
|
$84.86
|
PP = $90.20
|
|
MB = $94.71
|
Most Recent Note - 7/14/2020 5:33:08 PM
Y - Undercut prior highs in the $90-91 area and managed a "positive reversal" today after testing support at its 50 DMA line ($87.74). More damaging losses would raise concerns and trigger a technical sell signal. Completed a new Public Offering on 6/17/20. See the latest FSU analysis for more details and a new annotated graph.
>>> FEATURED STOCK ARTICLE : Managed Positive Reversal After Testing 50-Day Moving Average - 7/14/2020 |
View all notes |
Set NEW NOTE alert |
Company Profile |
SEC
News |
Chart |
Request a new note
C
A
S
I |
|
|
|
THESE ARE NOT BUY RECOMMENDATIONS!
Comments contained in the body of this report are technical
opinions only. The material herein has been obtained
from sources believed to be reliable and accurate, however,
its accuracy and completeness cannot be guaranteed.
This site is not an investment advisor, hence it does
not endorse or recommend any securities or other investments.
Any recommendation contained in this report may not
be suitable for all investors and it is not to be deemed
an offer or solicitation on our part with respect to
the purchase or sale of any securities. All trademarks,
service marks and trade names appearing in this report
are the property of their respective owners, and are
likewise used for identification purposes only.
This report is a service available
only to active Paid Premium Members.
You may opt-out of receiving report notifications
at any time. Questions or comments may be submitted
by writing to Premium Membership Services 665 S.E. 10 Street, Suite 201 Deerfield Beach, FL 33441-5634 or by calling 1-800-965-8307
or 954-785-1121.
|
|
|