You are not logged in.
This means you
CAN ONLY VIEW reports that were published prior to Monday, February 19, 2024.
You
MUST UPGRADE YOUR MEMBERSHIP if you want to see any current reports.
AFTER MARKET UPDATE - FRIDAY, JULY 15TH, 2022
Previous After Market Report Next After Market Report >>>
|
|
|
|
DOW |
+658.09 |
31,288.26 |
+2.15% |
|
Volume |
1,000,943,041 |
+11% |
|
Volume |
4,317,379,500 |
-3% |
|
NASDAQ |
+201.24 |
11,452.42 |
+1.79% |
|
Advancers |
2,559 |
83% |
|
Advancers |
2,846 |
68% |
|
S&P 500 |
+72.78 |
3,863.16 |
+1.92% |
|
Decliners |
533 |
17% |
|
Decliners |
1,361 |
32% |
|
Russell 2000 |
+36.87 |
1,744.37 |
+2.16% |
|
52 Wk Highs |
9 |
|
|
52 Wk Highs |
38 |
|
|
S&P 600 |
+23.41 |
1,137.14 |
+2.10% |
|
52 Wk Lows |
90 |
|
|
52 Wk Lows |
166 |
|
|
 |
Major Indices Snapped Losing Streak With Solid Friday Gains
Kenneth J. Gruneisen - Passed the CAN SLIM® Master's Exam
The S&P 500 advanced 1.9% for its best day since June 24. The benchmark snapped a five-session losing streak and pared its weekly loss to 0.9%. The Dow added 658 points, while the Nasdaq rallied 1.8%, trimming their weekly declines to 0.2% and 1.6%, respectively. The volume totals reported were mixed, higher than the prior session on the NYSE and lower on the Nasdaq exchange. Breadth was positive as advancers led decliners by almost a 5-1 margin on the NYSE and by more than a 2-1 margin on the Nasdaq exchange. There were 6 high-ranked companies from the Leaders List that hit new 52-week high and were listed on the BreakOuts Page, versus the total of 1 on the prior session. New 52-week lows totals still outnumbered new 52-week highs totals on the NYSE and on the Nasdaq exchange. The brief new market uptrend is already under pressure (M criteria). Any sustainable rally requires a healthy crop of leading stocks hitting new highs, but leadership has been very thin.
Chart courtesy of www.stockcharts.com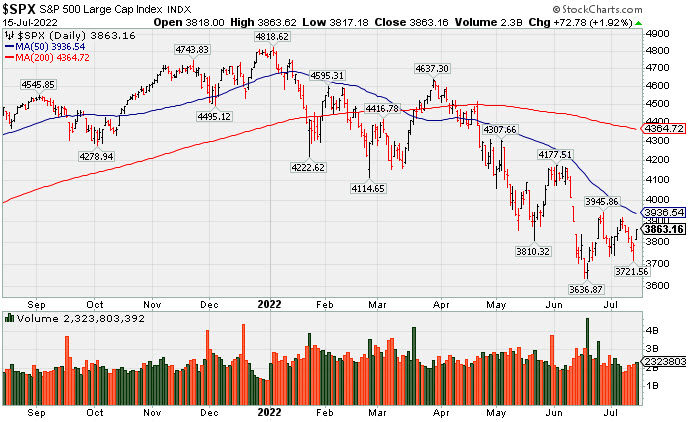 PICTURED: The S&P 500 Index posted a gain on Friday to break a 5 session losing streak. It remains below its 50-day moving average (DMA) line and well below its 200 DMA after slumping as much as -24.5% from its January 4, 2022 record high.
U.S. stocks finished higher on Friday as investors assessed economic data and corporate earnings results. All 11 S&P 500 sectors closed in positive territory, with Financials pacing gains. Citigroup Inc. (C +13.23%) soared following a top and bottom line beat as the firm caught a tailwind from higher interest rates and increased trading activity. UnitedHealth Group Inc. (UNH +5.44%) rallied on upbeat results and a boost to its full-year guidance.
On the data front, U.S. retail sales jumped a stronger-than-anticipated 1% in June, rebounding from May’s 0.1% decline. However, spending on gasoline accounted for a large portion of the advance. Additionally, a preliminary July update from the University of Michigan revealed consumer sentiment recovered from an all-time low, edging up to 51.1 from the previous 50.0 figure. Also buoying the mood, the report revealed 5-10-year inflation expectations slipped to a one-year low of 2.8%. The updates, along with recent Federal Reserve commentary, helped ease market forecasts of an ultra-aggressive 1.00% central bank rate hike later this month, though another 0.75% increase remained widely anticipated.
Treasuries strengthened, with the yield on the 10-year note down four basis points (0.04%) to 2.92%. However, the yield on the two-year note ended the session at 3.12%, marking the deepest inversion since 2000 amid rising concerns about a looming recession. In commodities, West Texas Intermediate crude settled the week below $100/barrel for the first time since April.
|
 Kenneth J. Gruneisen started out as a licensed stockbroker in August 1987, a couple of months prior to the historic stock market crash that took the Dow Jones Industrial Average down -22.6% in a single day. He has published daily fact-based fundamental and technical analysis on high-ranked stocks online for two decades. Through FACTBASEDINVESTING.COM, Kenneth provides educational articles, news, market commentary, and other information regarding proven investment systems that work in good times and bad.
Comments contained in the body of this report are technical opinions only and are not necessarily those of Gruneisen Growth Corp. The material herein has been obtained from sources believed to be reliable and accurate, however, its accuracy and completeness cannot be guaranteed. Our firm, employees, and customers may effect transactions, including transactions contrary to any recommendation herein, or have positions in the securities mentioned herein or options with respect thereto. Any recommendation contained in this report may not be suitable for all investors and it is not to be deemed an offer or solicitation on our part with respect to the purchase or sale of any securities. |
|
 |
Financial, Retail, Tech, and Energy- Linked Indices Rose
Kenneth J. Gruneisen - Passed the CAN SLIM® Master's Exam
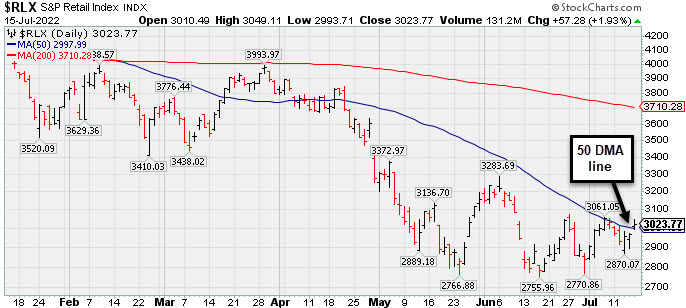
Financials had a positive influence on the major indices Friday as the Bank Index ($BKX +5.76%) and Broker/Dealer Index ($XBD +3.39%) both posted standout gains. The Oil Services Index ($OSX +2.38%) and Integrated Oil Index ($XOI +2.38%) both posted solid gains while the Gold & Silver Index ($XAU -0.19%) finished flat. The tech sector had a positive bias as the Semiconductor Index ($SOX +2.54%), Networking Index ($NWX +2.83%), and Biotech Index ($BTK +1.99%) each posted a solid gain.
PICTURED: The Retail Index ($RLX +1.93%) ratcheted higher to close above its 50-day moving average (line) for the first time since April.
| Oil Services |
$OSX |
58.97 |
+1.37 |
+2.38% |
+11.85% |
| Integrated Oil |
$XOI |
1,401.89 |
+32.61 |
+2.38% |
+18.99% |
| Semiconductor |
$SOX |
2,693.77 |
+66.85 |
+2.54% |
-31.74% |
| Networking |
$NWX |
699.22 |
+19.28 |
+2.83% |
-28.00% |
| Broker/Dealer |
$XBD |
397.04 |
+13.02 |
+3.39% |
-18.45% |
| Retail |
$RLX |
3,023.77 |
+57.28 |
+1.93% |
-28.46% |
| Gold & Silver |
$XAU |
103.24 |
-0.20 |
-0.19% |
-22.05% |
| Bank |
$BKX |
104.03 |
+5.67 |
+5.76% |
-21.32% |
| Biotech |
$BTK |
4,779.85 |
+93.49 |
+1.99% |
-13.38% |
|
|
|
 |
Stalled Since Clearing Double Bottom Base
Kenneth J. Gruneisen - Passed the CAN SLIM® Master's Exam
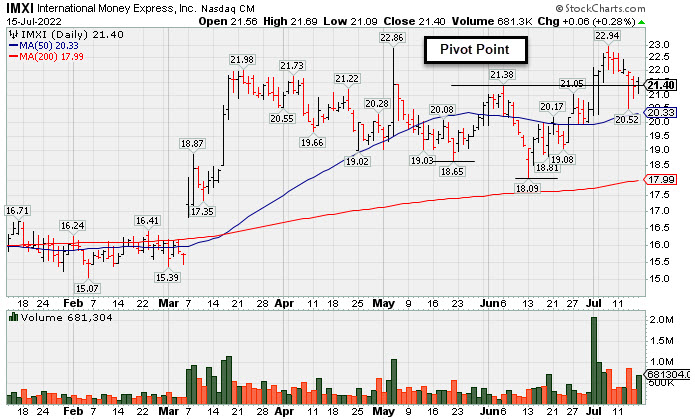
International Money Express (IMXI +$0.06 or +0.28% to $21.40) encountered distributional pressure recently after touching a new 52-week high. Its 50-day moving average (DMA) line ($20.32) defines important near-term support to watch, where any violation may trigger a technical sell signal. IMXI was highlighted in yellow in the 7/01/22 mid-day report (read here) with new pivot point cited based on its 6/06/22 high after a "double bottom" base. The big gain above the pivot point was backed by +438% above average volume triggering a technical buy signal. It was last shown with detailed analysis on 5/12/22 with an annotated graph under the headline, "Volume Heavy While Rallying from Double Bottom Base". However, since then it met stubborn resistance near the prior high.
IMXI has a 96 Earnings Per Share rating. It reported Mar '22 quarterly earnings +26% on +21% sales revenues versus the year ago period. The Financial Services-Specialty firm's quarterly and annual earnings (C and A criteria) history has been strong and backed by solid sales revenues growth. The past 7 quarterly comparisons showed earnings increases above the year ago period by more than +25% (C criteria).
There is a small supply of only 38.4 million shares outstanding (S criteria) which can contribute to greater price volatility in the event of institutional buying or selling. The number of top-rated funds owning its shares rose from 210 in Mar '21 to 300 in Jun '22, a reassuring sign concerning the I criteria. Its current Up/Down Volume Ratio of 1.4 is an unbiased indication its shares have been under accumulation over the past 50 days. |
|
|
Color Codes Explained :
Y - Better candidates highlighted by our
staff of experts.
G - Previously featured
in past reports as yellow but may no longer be buyable under the
guidelines.
***Last / Change / Volume data in this table is the closing quote data***
Symbol/Exchange
Company Name
Industry Group |
PRICE |
CHANGE
(%Change) |
Day High |
Volume
(% DAV)
(% 50 day avg vol) |
52 Wk Hi
% From Hi |
Featured
Date |
Price
Featured |
Pivot Featured |
|
Max Buy |
 LLY
-
NYSE
LLY
-
NYSE
Eli Lilly & Co
Medical-Diversified
|
$331.60
|
+4.71
1.44% |
$335.33
|
3,309,074
110.27% of 50 DAV
50 DAV is 3,001,000
|
$334.52
-0.87%
|
5/16/2022
|
$302.46
|
PP = $314.10
|
|
MB = $329.81
|
 Most Recent Note - 7/15/2022 5:24:54 PM
Y - Posted a gain today backed by +10% above average volume for a best ever close following a "positive reversal" on the prior session. Held its ground with light volume totals in recent weeks. Its 50 DMA line ($307.70) defines near-term support above prior lows.
>>> FEATURED STOCK ARTICLE : Lilly Quietly Wedged to a New All-Time High This Week - 7/8/2022 |
View all notes |
Set NEW NOTE alert |
Company Profile |
SEC
News |
Chart |
Request a new note
C
A
S
I |
IMXI
-
NASDAQ
International Money Exp
Financial Svcs-Specialty
|
$21.40
|
+0.06
0.28% |
$21.69
|
681,809
167.11% of 50 DAV
50 DAV is 408,000
|
$22.94
-6.71%
|
7/1/2022
|
$21.27
|
PP = $21.38
|
|
MB = $22.45
|
Most Recent Note - 7/15/2022 5:10:50 PM
Y - Consolidating near its pivot point, it stalled after reaching a new 52-week high. Recently broke out of a "double bottom" base. Its 50 DMA line ($20.32) defines important near-term support to watch. Fundamentals through the Mar '22 quarter have been strong. See the latest FSU analysis for more details and a new annotated graph.
>>> FEATURED STOCK ARTICLE : Stalled Since Clearing Double Bottom Base - 7/15/2022 |
View all notes |
Set NEW NOTE alert |
Company Profile |
SEC
News |
Chart |
Request a new note
C
A
S
I |
HRMY
-
NASDAQ
Harmony Biosciences Hldg
Medical-Biomed/Biotech
|
$53.65
|
+0.68
1.28% |
$54.29
|
525,649
101.48% of 50 DAV
50 DAV is 518,000
|
$57.13
-6.09%
|
7/6/2022
|
$54.12
|
PP = $52.85
|
|
MB = $55.49
|
Most Recent Note - 7/15/2022 5:21:59 PM
Y - Posted a gain today breaking a streak of 5 consecutive losses, still consolidating near its high after triggering a technical buy signal. Prior highs in the $52-54 area define initial support to watch on pullbacks. Reported strong sales revenues and earnings increases in quarterly comparisons through Mar '22 versus the year ago periods. Annual earnings history is limited. Completed its $24 IPO on 8/19/20.
>>> FEATURED STOCK ARTICLE : Volume-Driven Breakout For Biotech Firm - 7/6/2022 |
View all notes |
Set NEW NOTE alert |
Company Profile |
SEC
News |
Chart |
Request a new note
C
A
S
I |
CI
-
NYSE
Cigna Corp
Medical-Managed Care
|
$274.11
|
+9.20
3.47% |
$274.38
|
1,874,013
97.00% of 50 DAV
50 DAV is 1,932,000
|
$282.33
-2.91%
|
7/7/2022
|
$276.55
|
PP = $273.68
|
|
MB = $287.36
|
Most Recent Note - 7/15/2022 5:12:25 PM
Y - Posted a big gain today, rebounding after undercutting prior highs in the $273 area and testing its 50 DMA line ($262.45). More damaging losses would raise greater concerns.
>>> FEATURED STOCK ARTICLE : Volume-Driven Breakout for Cigna Corp - 7/7/2022 |
View all notes |
Set NEW NOTE alert |
Company Profile |
SEC
News |
Chart |
Request a new note
C
A
S
I |
|
|
|
THESE ARE NOT BUY RECOMMENDATIONS!
Comments contained in the body of this report are technical
opinions only. The material herein has been obtained
from sources believed to be reliable and accurate, however,
its accuracy and completeness cannot be guaranteed.
This site is not an investment advisor, hence it does
not endorse or recommend any securities or other investments.
Any recommendation contained in this report may not
be suitable for all investors and it is not to be deemed
an offer or solicitation on our part with respect to
the purchase or sale of any securities. All trademarks,
service marks and trade names appearing in this report
are the property of their respective owners, and are
likewise used for identification purposes only.
This report is a service available
only to active Paid Premium Members.
You may opt-out of receiving report notifications
at any time. Questions or comments may be submitted
by writing to Premium Membership Services 665 S.E. 10 Street, Suite 201 Deerfield Beach, FL 33441-5634 or by calling 1-800-965-8307
or 954-785-1121.
|
|
|