You are not logged in.
This means you
CAN ONLY VIEW reports that were published prior to Tuesday, February 20, 2024.
You
MUST UPGRADE YOUR MEMBERSHIP if you want to see any current reports.
AFTER MARKET UPDATE - TUESDAY, JULY 14TH, 2020
Previous After Market Report Next After Market Report >>>
|
|
|
|
DOW |
+556.79 |
26,642.59 |
+2.13% |
|
Volume |
908,562,086 |
-10% |
|
Volume |
4,373,430,000 |
-9% |
|
NASDAQ |
+97.74 |
10,488.58 |
+0.94% |
|
Advancers |
1,903 |
65% |
|
Advancers |
1,911 |
62% |
|
S&P 500 |
+42.30 |
3,197.52 |
+1.34% |
|
Decliners |
1,009 |
35% |
|
Decliners |
1,188 |
38% |
|
Russell 2000 |
+24.69 |
1,428.26 |
+1.76% |
|
52 Wk Highs |
27 |
|
|
52 Wk Highs |
51 |
|
|
S&P 600 |
+13.52 |
822.99 |
+1.67% |
|
52 Wk Lows |
12 |
|
|
52 Wk Lows |
32 |
|
|
 |
Major Indices Rebounded With Lighter Volume and Less Leadership
Kenneth J. Gruneisen - Passed the CAN SLIM® Master's Exam
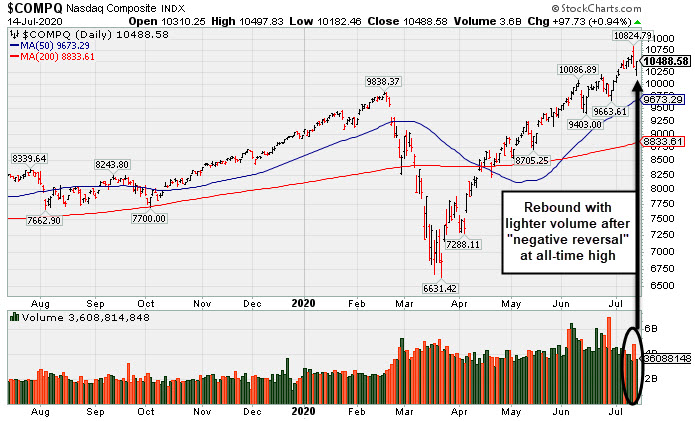
The Dow extended its midday gains, climbing 556 points to its highest level in five weeks. The S&P 500 rose 1.3% after fluctuating earlier in the session. The Nasdaq Composite reversed a 2% decline to advance 0.9%. Breadth was positive as advancers led decliners by almost a 2-1 margin on the NYSE and more than 3-2 on the Nasdaq exchange. The reported volume totals were lighter than the prior session on the NYSE and on the Nasdaq exchange, indicative of less buying conviction coming from institutional investors. There were 15 high-ranked companies from the Leaders List that hit new 52-week highs and were listed on the BreakOuts Page, versus the total of 91 on the prior session. New 52-week highs totals contracted abruptly yet still outnumbered new 52-week lows totals on both exchanges. The major indices are in a confirmed uptrend (M criteria). Any sustainable rally requires a healthy crop of new leaders, so it remains ever-important to see substantial new highs totals.Charts used courtesy of www.stockcharts.com
PICTURED: The Nasdaq Composite Index rebounded with a gain on lighter volume following a "negative reversal" with heavier volume at its all-time high.
Stocks finished higher during a volatile trading session on Tuesday, as investors digested second-quarter earnings results from some of Wall Street’s biggest banks. All 11 S&P 500 sectors ended in positive territory with the Energy, Materials, and Industrials groups each rising more than 2%. The Consumer Discretionary sector underperformed on a relative basis, with Amazon (AMZN -0.64%) falling. In earnings, JP Morgan Chase & Co (JPM +0.57%) rose despite reporting a 51% decline in profit during the April-June period and its largest loan-loss provision on record. However, the largest U.S. bank by assets was helped in part by record revenue in its trading division. Meanwhile, Citigroup (C -3.93%) fell following a 73% drop in its earnings compared to a year earlier. Elsewhere, Delta Air Lines (DAL -2.65%) fell after posting a 91% decline in revenue and warning it would likely take more than two years before the industry could fully recover.
On the data front, the NFIB’s gauge of small business optimism improved last month to 100.6, but remained below February’s 104.5 pre-pandemic level. A separate update showed consumer prices rose 0.6% in June, the first uptick in four months. Core CPI (ex-food and energy) advanced 1.2% year-over-year, matching May’s pace. Treasuries modestly declined, with the yield on the 10-year note holding steady at 0.62%. In commodities, WTI crude added 0.4% to $40.27/barrel. COMEX gold fell 0.1% to $1,811.90/ounce.
|
 Kenneth J. Gruneisen started out as a licensed stockbroker in August 1987, a couple of months prior to the historic stock market crash that took the Dow Jones Industrial Average down -22.6% in a single day. He has published daily fact-based fundamental and technical analysis on high-ranked stocks online for two decades. Through FACTBASEDINVESTING.COM, Kenneth provides educational articles, news, market commentary, and other information regarding proven investment systems that work in good times and bad.
Comments contained in the body of this report are technical opinions only and are not necessarily those of Gruneisen Growth Corp. The material herein has been obtained from sources believed to be reliable and accurate, however, its accuracy and completeness cannot be guaranteed. Our firm, employees, and customers may effect transactions, including transactions contrary to any recommendation herein, or have positions in the securities mentioned herein or options with respect thereto. Any recommendation contained in this report may not be suitable for all investors and it is not to be deemed an offer or solicitation on our part with respect to the purchase or sale of any securities. |
|
 |
Broker/Dealer Index, Tech, and Commodity-Linked Groups Rose
Kenneth J. Gruneisen - Passed the CAN SLIM® Master's Exam
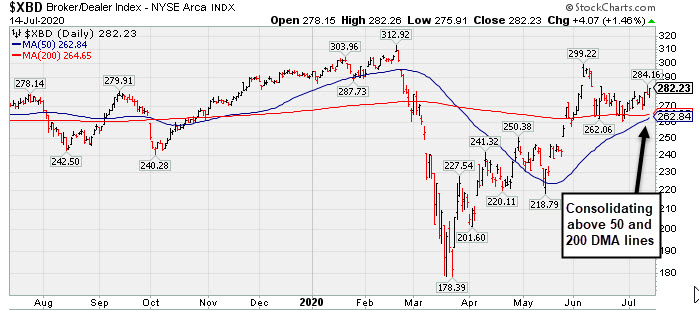
Financial stocks were mixed as the Bank ($BKX -1.62%) fell and the Broker/Dealer ($XBD +1.46%) notched a gain. The Retail ($RLX +0.32%) edged higher. Commodity-linked groups werre standout gainers as the Gold & Silver ($XAU +4.44%), Oil Services ($OSX +5.23%), and the Integrated Oil and ($XOI +3.55%) each posted solid gains. The tech sector also had a positive bias as the Semiconductor ($SOX +1.81%), Networking ($NWX +2.09%), and Biotech Index ($BTK +2.24%) posted unanimous gains.
PICTURED: The Broker/Dealer ($XBD +1.46%) posted a gain, and it recently has been consolidating above its 50 and 200 DMA lines. The financials are reliable "leading indicators" and may give investors an important signal as to whether or not the current rally will continue to be productive. Stay tuned!
| Oil Services |
$OSX |
32.80 |
+1.63 |
+5.23% |
-58.10% |
| Integrated Oil |
$XOI |
757.41 |
+25.97 |
+3.55% |
-40.39% |
| Semiconductor |
$SOX |
2,070.96 |
+36.82 |
+1.81% |
+11.97% |
| Networking |
$NWX |
545.83 |
+11.16 |
+2.09% |
-6.44% |
| Broker/Dealer |
$XBD |
282.23 |
+4.07 |
+1.46% |
-2.81% |
| Retail |
$RLX |
3,227.27 |
+10.27 |
+0.32% |
+31.76% |
| Gold & Silver |
$XAU |
137.07 |
+5.83 |
+4.44% |
+28.20% |
| Bank |
$BKX |
72.82 |
-1.20 |
-1.62% |
-35.76% |
| Biotech |
$BTK |
5,884.59 |
+128.90 |
+2.24% |
+16.13% |
|
|
|
 |
Managed Positive Reversal After Testing 50-Day Moving Average
Kenneth J. Gruneisen - Passed the CAN SLIM® Master's Exam
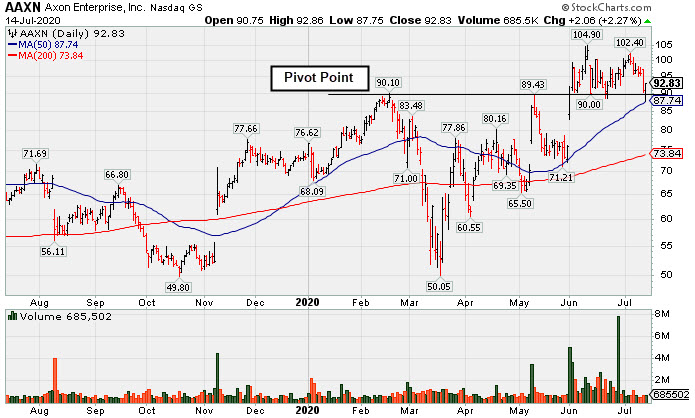
Axon Enterprise Inc (AAXN +$2.06 or +2.27% to $92.83) managed a "positive reversal" today after slumping near its 50-day moving average (DMA) line ($87.75) today. Its color code was changed to yellow after slumping below its "max buy" level with a big loss on light volume. It undercut prior highs in the $90-91 area but found prompt support. More damaging losses would raise concerns and trigger a worrisome technical sell signal.
AAXN completed a new Pubic Offering on 6/17/20. Such offerings often hinder price progress temporarily, yet they help companies attract greater institutional ownership interest (I criteria). AAXN was highlighted in yellow in the 5/08/20 mid-day report with pivot point cited based upon its 2/19/20 high plus 10 cents (read here). It was last shown in this FSU section on 6/19/20 with an annotated graph under the headline, "Completed New Pubic Offering and Found Support Near Prior High".
The company has a small supply of only 63 million shares outstanding (S criteria) which can contribute to greater price volatility in the event of institutional buying or selling. The number of top-rated funds owning its shares rose from 400 in Sep '19 to 468 in Jun '20, a reassuring sign concerning the I criteria. AAXN has a Timeliness Rating of A and an Accumulation/Distribution Rating of B-. The Security/Safety industry group currently has a Group Relative Strength Rating of A- (81).
The Sep, Dec '19 and Mar '20 quarterly comparisons versus the year ago periods showed earnings increases above the +25% minimum guideline (C criteria) with strong underlying sales revenues increases. Its annual earnings (A criteria) history has also been strong, helping it get a 98 Earnings Per Share Rating. |
|
|
Color Codes Explained :
Y - Better candidates highlighted by our
staff of experts.
G - Previously featured
in past reports as yellow but may no longer be buyable under the
guidelines.
***Last / Change / Volume data in this table is the closing quote data***
Symbol/Exchange
Company Name
Industry Group |
PRICE |
CHANGE
(%Change) |
Day High |
Volume
(% DAV)
(% 50 day avg vol) |
52 Wk Hi
% From Hi |
Featured
Date |
Price
Featured |
Pivot Featured |
|
Max Buy |
 FTNT
-
NASDAQ
FTNT
-
NASDAQ
Fortinet Inc
Computer Sftwr-Security
|
$134.48
|
+3.36
2.56% |
$136.38
|
2,746,815
155.72% of 50 DAV
50 DAV is 1,764,000
|
$151.95
-11.50%
|
6/22/2020
|
$142.68
|
PP = $149.79
|
|
MB = $157.28
|
 Most Recent Note - 7/14/2020 5:24:54 PM
G - Managed a "positive reversal" today, finding support near prior lows in the $128 area. More damaging losses would raise greater concerns. A rebound above its 50 DMA line ($136.84) is needed for its outlook to improve after a damaging loss on the prior session triggered a technical sell signal.
>>> FEATURED STOCK ARTICLE : Best Ever Close With Volume-Driven Gain Approaching Pivot Point - 7/8/2020 |
View all notes |
Set NEW NOTE alert |
Company Profile |
SEC
News |
Chart |
Request a new note
C
A
S
I |
EBS
-
NYSE
Emergent Biosolutions
DRUGS - Biotechnology
|
$96.66
|
+5.33
5.84% |
$96.98
|
504,675
79.23% of 50 DAV
50 DAV is 637,000
|
$97.10
-0.45%
|
7/7/2020
|
$89.47
|
PP = $93.68
|
|
MB = $98.36
|
Most Recent Note - 7/14/2020 5:21:40 PM
Y - Posted a solid gain today with below average volume for a best ever close near its all-time high. Recent gains above the new pivot point cited lacked great volume conviction. No resistance remains due to overhead supply. Fundamentals remain strong.
>>> FEATURED STOCK ARTICLE : Impressive Rebound to Hit a New High - 7/9/2020 |
View all notes |
Set NEW NOTE alert |
Company Profile |
SEC
News |
Chart |
Request a new note
C
A
S
I |
NBIX
-
NASDAQ
Neurocrine Biosciences
DRUGS - Biotechnology
|
$131.12
|
+5.04
4.00% |
$131.27
|
924,256
101.12% of 50 DAV
50 DAV is 914,000
|
$136.27
-3.78%
|
5/19/2020
|
$123.71
|
PP = $119.75
|
|
MB = $125.74
|
Most Recent Note - 7/14/2020 5:20:16 PM
G - Managed a "positive reversal" today as it posted a solid gain with average volume for its second best ever close. Its 50 DMA line ($120.39) and prior highs in the $119 area coincide defining important near-term support to watch. Fundamentals remain strong.
>>> FEATURED STOCK ARTICLE : Pulled Back Below "Max Buy" Level With Loss on Average Volume - 6/30/2020 |
View all notes |
Set NEW NOTE alert |
Company Profile |
SEC
News |
Chart |
Request a new note
C
A
S
I |
BMRN
-
NASDAQ
Biomarin Pharmaceutical
DRUGS - Drug Manufacturers - Other
|
$126.43
|
+2.03
1.63% |
$126.87
|
1,360,664
82.56% of 50 DAV
50 DAV is 1,648,000
|
$130.04
-2.78%
|
6/17/2020
|
$110.95
|
PP = $112.67
|
|
MB = $118.30
|
Most Recent Note - 7/14/2020 5:29:06 PM
G - Managed a "positive reversal" today and it remains perched near its all-time high, very extended from any sound base. Fundamentals remain strong. Prior high ($112.57) and its 50 DMA line ($109.34) define near-term support to watch on pullbacks.
>>> FEATURED STOCK ARTICLE : Hovering Near High With Volume Totals Cooling - 7/10/2020 |
View all notes |
Set NEW NOTE alert |
Company Profile |
SEC
News |
Chart |
Request a new note
C
A
S
I |
AMD
-
NASDAQ
Advanced Micro Devices
ELECTRONICS - Semiconductor - Broad Line
|
$54.72
|
+1.13
2.11% |
$54.86
|
54,468,427
99.44% of 50 DAV
50 DAV is 54,774,000
|
$59.27
-7.68%
|
6/9/2020
|
$55.41
|
PP = $56.98
|
|
MB = $59.83
|
Most Recent Note - 7/14/2020 5:34:14 PM
Y - Managed a "positive reversal" today after undercutting its 50 DMA line ($53.66). Previously met stubborn resistance in the $57-59 area. Subsequent gains above the pivot point backed by at least +40% above average volume may trigger a technical buy signal.
>>> FEATURED STOCK ARTICLE : Slump Below 50-Day Average Toward Prior Low Raises Concerns - 6/26/2020 |
View all notes |
Set NEW NOTE alert |
Company Profile |
SEC
News |
Chart |
Request a new note
C
A
S
I |
Symbol/Exchange
Company Name
Industry Group |
PRICE |
CHANGE
(%Change) |
Day High |
Volume
(% DAV)
(% 50 day avg vol) |
52 Wk Hi
% From Hi |
Featured
Date |
Price
Featured |
Pivot Featured |
|
Max Buy |
TREX
-
NYSE
Trex Company Inc
MATERIALS and CONSTRUCTION - General Building Materials
|
$128.52
|
+5.78
4.71% |
$128.66
|
743,486
68.52% of 50 DAV
50 DAV is 1,085,000
|
$135.32
-5.03%
|
6/26/2020
|
$109.05
|
PP = $132.94
|
|
MB = $139.59
|
Most Recent Note - 7/14/2020 5:27:09 PM
Y - Posted a solid gain today with light volume. Remains perched near its all-time high. Subsequent volume-driven gains and a close above the pivot point may clinch a new (or add-on) technical buy signal. Important near-term support is at its 50 DMA line ($120.55). Fundamentals remain strong.
>>> FEATURED STOCK ARTICLE : Quietly Perched Near All-Time High After Forming a New Base - 7/6/2020 |
View all notes |
Set NEW NOTE alert |
Company Profile |
SEC
News |
Chart |
Request a new note
C
A
S
I |
NFLX
-
NASDAQ
Netflix Inc
SPECIALTY RETAIL - Music and Video Stores
|
$524.88
|
-0.62
-0.12% |
$525.50
|
14,982,532
224.66% of 50 DAV
50 DAV is 6,669,000
|
$575.37
-8.78%
|
5/14/2020
|
$441.95
|
PP = $449.62
|
|
MB = $472.10
|
Most Recent Note - 7/14/2020 12:53:28 PM
G - There was a "negative reversal" on the prior session after spiking to a new all-time high with big volume-driven gains. Very extended from any sound base. Prior highs in the $458 area define near-term support above its 50 DMA line ($449).
>>> FEATURED STOCK ARTICLE : Powered to New High on Prior Session With Volume Driven Gain - 7/2/2020 |
View all notes |
Set NEW NOTE alert |
Company Profile |
SEC
News |
Chart |
Request a new note
C
A
S
I |
CHGG
-
NYSE
Chegg Inc
Consumer Svcs-Education
|
$69.20
|
-1.26
-1.79% |
$71.42
|
3,054,237
64.18% of 50 DAV
50 DAV is 4,759,000
|
$77.42
-10.62%
|
6/17/2020
|
$63.71
|
PP = $68.08
|
|
MB = $71.48
|
Most Recent Note - 7/13/2020 6:29:50 PM
Y - Color code is changed to yellow after pulling back below its "max buy" level with today's loss on average volume. Prior high in the $68 area defines initial support to watch on pullbacks. See the latest FSU analysis for more details and a new annotated graph.
>>> FEATURED STOCK ARTICLE : Negative Reversal After Recently Wedging into New High Territory - 7/13/2020 |
View all notes |
Set NEW NOTE alert |
Company Profile |
SEC
News |
Chart |
Request a new note
C
A
S
I |
LGIH
-
NASDAQ
L G I Homes Inc
Bldg-Resident/Comml
|
$104.61
|
+7.46
7.68% |
$104.91
|
442,754
112.09% of 50 DAV
50 DAV is 395,000
|
$104.49
0.11%
|
7/7/2020
|
$99.19
|
PP = $95.82
|
|
MB = $100.61
|
Most Recent Note - 7/14/2020 5:17:50 PM
G - Color code is changed to green after rallying well above its "max buy" level with a big gain today on +12% above average volume. Prior highs in the $95 area define initial support to watch following its recent technical breakout.
>>> FEATURED STOCK ARTICLE : Breakout to New High Backed by 53% Above Average Volume - 7/7/2020 |
View all notes |
Set NEW NOTE alert |
Company Profile |
SEC
News |
Chart |
Request a new note
C
A
S
I |
NOW
-
NYSE
Servicenow Inc
Computer Sftwr-Enterprse
|
$413.23
|
+11.36
2.83% |
$413.81
|
1,755,095
92.76% of 50 DAV
50 DAV is 1,892,000
|
$430.83
-4.09%
|
4/30/2020
|
$343.05
|
PP = $363.05
|
|
MB = $381.20
|
Most Recent Note - 7/13/2020 6:51:37 PM
G - Pulled back from its all-time high with a big loss today on below average volume. It has not formed a sound base. Its 50 DMA line ($389.41) defines important near-term support to watch where a violation may trigger a technical sell signal.
>>> FEATURED STOCK ARTICLE : Hovering Near All-Time High With Volume Totals Cooling - 6/25/2020 |
View all notes |
Set NEW NOTE alert |
Company Profile |
SEC
News |
Chart |
Request a new note
C
A
S
I |
Symbol/Exchange
Company Name
Industry Group |
PRICE |
CHANGE
(%Change) |
Day High |
Volume
(% DAV)
(% 50 day avg vol) |
52 Wk Hi
% From Hi |
Featured
Date |
Price
Featured |
Pivot Featured |
|
Max Buy |
TEAM
-
NASDAQ
Atlassian Corp Plc Cl A
Comp Sftwr-Spec Enterprs
|
$174.15
|
-5.40
-3.01% |
$180.95
|
4,008,708
209.22% of 50 DAV
50 DAV is 1,916,000
|
$198.41
-12.23%
|
7/7/2020
|
$190.44
|
PP = $191.82
|
|
MB = $201.41
|
Most Recent Note - 7/14/2020 1:02:24 PM
G - Color code is changed to green after it abruptly slumped below its 50 DMA line ($179.56) with higher volume behind today's big 4th consecutive loss triggering a technical sell signal. Recent gains above the pivot point lacked the +40% above average volume necessary to trigger a convincing new (or add-on) technical buy signal. The prior ow ($160.20 on 5/27/20) defines its next important support above prior highs in the $156 area.
>>> FEATURED STOCK ARTICLE : 50-Day Moving Average Defines Important Near-Term Support - 6/29/2020 |
View all notes |
Set NEW NOTE alert |
Company Profile |
SEC
News |
Chart |
Request a new note
C
A
S
I |
TTD
-
NASDAQ
The Trade Desk Inc Cl A
Comml Svcs-Advertising
|
$432.04
|
+1.41
0.33% |
$435.00
|
2,146,716
103.76% of 50 DAV
50 DAV is 2,069,000
|
$475.67
-9.17%
|
6/3/2020
|
$340.61
|
PP = $327.35
|
|
MB = $343.72
|
Most Recent Note - 7/13/2020 6:49:47 PM
G - Suffered a "negative reversal today after hitting a new all-time high. Very extended from any sound base. Its 50 DMA line ($356.80) defines near-term support to watch.
>>> FEATURED STOCK ARTICLE : Pullback Breaks Streak of 8 Straight Gains Into New High Ground - 6/24/2020 |
View all notes |
Set NEW NOTE alert |
Company Profile |
SEC
News |
Chart |
Request a new note
C
A
S
I |
DOCU
-
NASDAQ
Docusign Inc
Computer Sftwr-Enterprse
|
$196.43
|
+6.41
3.37% |
$196.94
|
7,440,702
137.84% of 50 DAV
50 DAV is 5,398,000
|
$217.00
-9.48%
|
6/10/2020
|
$149.73
|
PP = $152.10
|
|
MB = $159.71
|
Most Recent Note - 7/14/2020 12:37:07 PM
G - Abruptly retreated with a big loss on above average volume on the prior session. Very extended from any sound base. Its 50 DMA line ($151.33) defines near-term support to watch on pullbacks. DOCU is now priced +99% above its 200 DMA price, and it is taught in the Certification that a stock trading +70-100% or more above the 200 DMA is to be recognized as a "sell signal".
>>> FEATURED STOCK ARTICLE : Rally From Ascending Base Leaves Stock Very Extended - 7/1/2020 |
View all notes |
Set NEW NOTE alert |
Company Profile |
SEC
News |
Chart |
Request a new note
C
A
S
I |
PING
-
NYSE
Ping Identity Hldg Corp
Computer Sftwr-Security
|
$30.72
|
-0.02
-0.07% |
$31.52
|
2,751,495
176.49% of 50 DAV
50 DAV is 1,559,000
|
$35.36
-13.12%
|
6/1/2020
|
$29.24
|
PP = $29.90
|
|
MB = $31.40
|
Most Recent Note - 7/13/2020 6:45:22 PM
G - Abruptly retreated from its all-time high with a big loss today backed by above average volume. Priced another Secondary Offering on 7/09/20 after an earlier Secondary Offering on 5/15/20. It has not formed a sound base of sufficient length. Prior highs in the $29 area define initial support to watch above its 50 DMA line ($29.09).
>>> FEATURED STOCK ARTICLE : Gain for Recent New High Backed by +71% Above Average Volume - 6/22/2020 |
View all notes |
Set NEW NOTE alert |
Company Profile |
SEC
News |
Chart |
Request a new note
C
A
S
I |
AAXN
-
NASDAQ
Axon Enterprise Inc
Security/Sfty
|
$92.83
|
+2.06
2.27% |
$92.86
|
683,823
50.43% of 50 DAV
50 DAV is 1,356,000
|
$104.90
-11.51%
|
5/8/2020
|
$84.86
|
PP = $90.20
|
|
MB = $94.71
|
Most Recent Note - 7/14/2020 5:33:08 PM
Y - Undercut prior highs in the $90-91 area and managed a "positive reversal" today after testing support at its 50 DMA line ($87.74). More damaging losses would raise concerns and trigger a technical sell signal. Completed a new Public Offering on 6/17/20. See the latest FSU analysis for more details and a new annotated graph.
>>> FEATURED STOCK ARTICLE : Managed Positive Reversal After Testing 50-Day Moving Average - 7/14/2020 |
View all notes |
Set NEW NOTE alert |
Company Profile |
SEC
News |
Chart |
Request a new note
C
A
S
I |
Symbol/Exchange
Company Name
Industry Group |
PRICE |
CHANGE
(%Change) |
Day High |
Volume
(% DAV)
(% 50 day avg vol) |
52 Wk Hi
% From Hi |
Featured
Date |
Price
Featured |
Pivot Featured |
|
Max Buy |
|
|
|
THESE ARE NOT BUY RECOMMENDATIONS!
Comments contained in the body of this report are technical
opinions only. The material herein has been obtained
from sources believed to be reliable and accurate, however,
its accuracy and completeness cannot be guaranteed.
This site is not an investment advisor, hence it does
not endorse or recommend any securities or other investments.
Any recommendation contained in this report may not
be suitable for all investors and it is not to be deemed
an offer or solicitation on our part with respect to
the purchase or sale of any securities. All trademarks,
service marks and trade names appearing in this report
are the property of their respective owners, and are
likewise used for identification purposes only.
This report is a service available
only to active Paid Premium Members.
You may opt-out of receiving report notifications
at any time. Questions or comments may be submitted
by writing to Premium Membership Services 665 S.E. 10 Street, Suite 201 Deerfield Beach, FL 33441-5634 or by calling 1-800-965-8307
or 954-785-1121.
|
|
|