You are not logged in.
This means you
CAN ONLY VIEW reports that were published prior to Sunday, February 25, 2024.
You
MUST UPGRADE YOUR MEMBERSHIP if you want to see any current reports.
AFTER MARKET UPDATE - TUESDAY, JULY 12TH, 2022
Previous After Market Report Next After Market Report >>>
|
|
|
|
DOW |
-192.51 |
30,981.33 |
-0.62% |
|
Volume |
878,456,359 |
+10% |
|
Volume |
4,307,953,200 |
-1% |
|
NASDAQ |
-107.87 |
11,264.73 |
-0.95% |
|
Advancers |
1,347 |
44% |
|
Advancers |
1,924 |
45% |
|
S&P 500 |
-35.63 |
3,818.80 |
-0.92% |
|
Decliners |
1,716 |
56% |
|
Decliners |
2,325 |
55% |
|
Russell 2000 |
-3.83 |
1,728.18 |
-0.22% |
|
52 Wk Highs |
10 |
|
|
52 Wk Highs |
24 |
|
|
S&P 600 |
-1.36 |
1,126.99 |
-0.12% |
|
52 Wk Lows |
158 |
|
|
52 Wk Lows |
214 |
|
|
 |
Major Indices Sputtered With Leadership Still Thin
Kenneth J. Gruneisen - Passed the CAN SLIM® Master's Exam
The S&P 500 fell 0.9%, while the Nasdaq Composite eased 1%. Meanwhile, the Dow lost 192 points. Volume totals reported were mixed, higher than the prior session on the NYSE and slightly lower on the Nasdaq exchange. Breadth was negative as decliners led advancers by a 9-7 margin on the NYSE and by a 6-5 margin on the Nasdaq exchange. There were 5 high-ranked companies from the Leaders List that hit new 52-week highs and were listed on the BreakOuts Page, versus the total of 6 on the prior session. New 52-week lows totals expanded and still outnumbered new 52-week highs on the NYSE and on the Nasdaq exchange. The brief new market uptrend is already under pressure (M criteria). Any sustainable rally requires a healthy crop of leading stocks hitting new highs, but leadership has been very thin.
Chart courtesy of www.stockcharts.com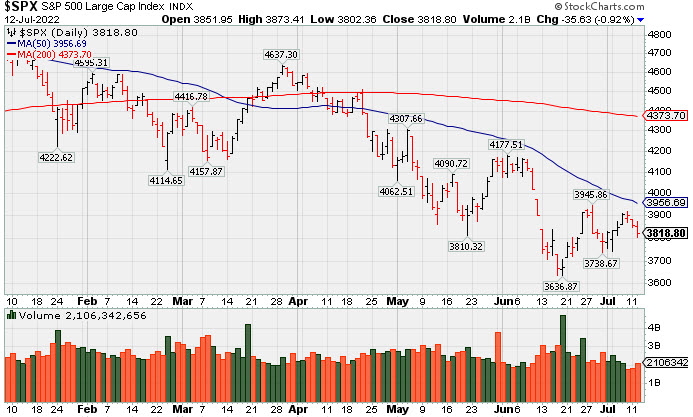 PICTURED: The S&P 500 Index has been sputtering below its 50-day and fell for a 3rd consecutive loss with slightly higher volume.
U.S. stocks finished lower on Tuesday, weighed down by rising concern over inflation and slowing economic growth. Investors are anxiously awaiting tomorrow’s release of the Consumer Price Index (CPI) and also remain jittery about the upcoming corporate earnings season. Consumer prices are expected to jump 8.8% year-over-year in June, accelerating from the prior 8.6% annual increase which had marked a fresh 40-year high.
Treasuries strengthened, with the yield on the 10-year note down two basis points (0.02%) to 2.96% following today’s soft $33 billion auction of the maturity. The sale’s bid-to-cover ratio (an indicator of demand) came in at the lowest level since December 2020. Meanwhile, the yield on the shorter-dated two-year note settled lower at 3.04%. The yield curve’s inversion persisted into a sixth session amid lingering worries over a looming recession. The gap between the two yields was the most negative since 2007 in earlier trading. In FOREX, the U.S. dollar advanced 0.1%, after hitting its highest level since March 2020 to reach parity with the euro for the first time in two decades. On the data front, a measure of small business optimism fell to the lowest level since January 2013 last month.
All 11 S&P 500 sectors closed in negative territory, with Energy shares leading the downturn as West Texas Intermediate crude slid 8.1% to $95.65/barrel. In earnings, PepsiCo Inc. (PEP -0.57%) fell as investors weighed a warning about foreign exchange headwinds against otherwise positive results.
|
 Kenneth J. Gruneisen started out as a licensed stockbroker in August 1987, a couple of months prior to the historic stock market crash that took the Dow Jones Industrial Average down -22.6% in a single day. He has published daily fact-based fundamental and technical analysis on high-ranked stocks online for two decades. Through FACTBASEDINVESTING.COM, Kenneth provides educational articles, news, market commentary, and other information regarding proven investment systems that work in good times and bad.
Comments contained in the body of this report are technical opinions only and are not necessarily those of Gruneisen Growth Corp. The material herein has been obtained from sources believed to be reliable and accurate, however, its accuracy and completeness cannot be guaranteed. Our firm, employees, and customers may effect transactions, including transactions contrary to any recommendation herein, or have positions in the securities mentioned herein or options with respect thereto. Any recommendation contained in this report may not be suitable for all investors and it is not to be deemed an offer or solicitation on our part with respect to the purchase or sale of any securities. |
|
 |
Retail, Tech, and Commodity-Linked Groups Fell
Kenneth J. Gruneisen - Passed the CAN SLIM® Master's Exam
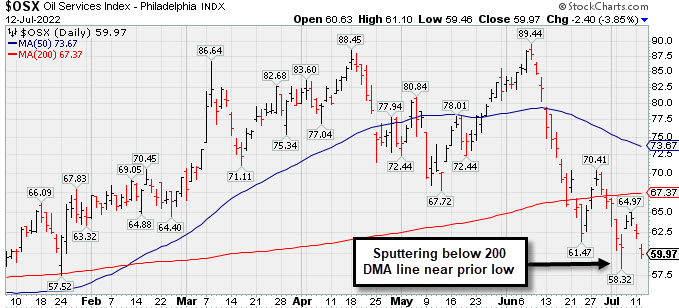
The Retail Index ($RLX -1.32%) lost ground and the Bank Index ($BKX -0.24%) edged lower while the Broker/Dealer Index ($XBD +0.18%) edged higher. The Semiconductor Index ($SOX +0.18%) eked out a small gain while the Networking Index ($NWX -0.76%) and Biotech Index ($BTK -0.69%) both edged lower. Commodity-linked groups had a negative bias as the Oil Services Index ($OSX -3.85%), Integrated Oil Index ($XOI -2.48%), and Gold & Silver Index ($XAU -1.80%) suffered unanimous losses.
PICTURED: The Oil Services Index ($OSX -3.85%) is still sputtering below its 200-day moving average (DMA) line and near its prior low.
| Oil Services |
$OSX |
59.97 |
-2.40 |
-3.85% |
+13.74% |
| Integrated Oil |
$XOI |
1,405.40 |
-35.78 |
-2.48% |
+19.28% |
| Semiconductor |
$SOX |
2,558.17 |
+4.49 |
+0.18% |
-35.17% |
| Networking |
$NWX |
681.89 |
-5.23 |
-0.76% |
-29.78% |
| Broker/Dealer |
$XBD |
391.14 |
+0.72 |
+0.18% |
-19.66% |
| Retail |
$RLX |
2,933.80 |
-39.28 |
-1.32% |
-30.58% |
| Gold & Silver |
$XAU |
105.66 |
-1.94 |
-1.80% |
-20.22% |
| Bank |
$BKX |
101.87 |
-0.24 |
-0.24% |
-22.95% |
| Biotech |
$BTK |
4,789.10 |
-33.41 |
-0.69% |
-13.22% |
|
|
|
 |
Featured Stocks
Kenneth J. Gruneisen - Passed the CAN SLIM® Master's Exam
|
|
|
Color Codes Explained :
Y - Better candidates highlighted by our
staff of experts.
G - Previously featured
in past reports as yellow but may no longer be buyable under the
guidelines.
***Last / Change / Volume data in this table is the closing quote data***
Symbol/Exchange
Company Name
Industry Group |
PRICE |
CHANGE
(%Change) |
Day High |
Volume
(% DAV)
(% 50 day avg vol) |
52 Wk Hi
% From Hi |
Featured
Date |
Price
Featured |
Pivot Featured |
|
Max Buy |
 LLY
-
NYSE
LLY
-
NYSE
Eli Lilly & Co
Medical-Diversified
|
$323.59
|
-7.48
-2.26% |
$331.99
|
2,058,194
66.22% of 50 DAV
50 DAV is 3,108,000
|
$334.52
-3.27%
|
5/16/2022
|
$302.46
|
PP = $314.10
|
|
MB = $329.81
|
 Most Recent Note - 7/12/2022 7:09:21 PM
Y - Color code is changed to yellow after slumping below its "max buy" level with light volume behind today's loss. Its 50 DMA line ($305.48) defines near-term support above prior lows.
>>> FEATURED STOCK ARTICLE : Lilly Quietly Wedged to a New All-Time High This Week - 7/8/2022 |
View all notes |
Set NEW NOTE alert |
Company Profile |
SEC
News |
Chart |
Request a new note
C
A
S
I |
IMXI
-
NASDAQ
International Money Exp
Financial Svcs-Specialty
|
$22.01
|
+0.02
0.09% |
$22.41
|
398,264
99.57% of 50 DAV
50 DAV is 400,000
|
$22.94
-4.05%
|
7/1/2022
|
$21.27
|
PP = $21.38
|
|
MB = $22.45
|
Most Recent Note - 7/11/2022 5:52:19 PM
G - Pulled back from its 52-week high with near average volume behind its 3rd consecutive loss. Color code is changed to yellow after pulling back below its "max buy" level. No resistance remains due to overhead supply. Rebound above the 50 DMA line ($20.18) helped its outlook improve. Fundamentals through the Mar '22 quarter have been strong.
>>> FEATURED STOCK ARTICLE : Volume Heavy While Rallying from Double Bottom Base - 7/1/2022 |
View all notes |
Set NEW NOTE alert |
Company Profile |
SEC
News |
Chart |
Request a new note
C
A
S
I |
HRMY
-
NASDAQ
Harmony Biosciences Hldg
Medical-Biomed/Biotech
|
$54.31
|
-0.39
-0.71% |
$54.93
|
389,355
73.74% of 50 DAV
50 DAV is 528,000
|
$57.13
-4.94%
|
7/6/2022
|
$54.12
|
PP = $52.85
|
|
MB = $55.49
|
Most Recent Note - 7/11/2022 5:50:23 PM
Y - Perched near its with volume-totals cooling following 4 consecutive gains marked by above average volume as it rallied to new highs and triggered a technical buy signal. Prior highs in the $52-54 area define initial support to watch on pullbacks. Reported strong sales revenues and earnings increases in quarterly comparisons through Mar '22 versus the year ago periods. Annual earnings history is limited. Completed its $24 IPO on 8/19/20.
>>> FEATURED STOCK ARTICLE : Volume-Driven Breakout For Biotech Firm - 7/6/2022 |
View all notes |
Set NEW NOTE alert |
Company Profile |
SEC
News |
Chart |
Request a new note
C
A
S
I |
CI
-
NYSE
Cigna Corp
Medical-Managed Care
|
$279.35
|
-0.56
-0.20% |
$282.33
|
2,599,281
138.26% of 50 DAV
50 DAV is 1,880,000
|
$281.49
-0.76%
|
7/7/2022
|
$276.55
|
PP = $273.68
|
|
MB = $287.36
|
Most Recent Note - 7/12/2022 12:20:08 PM
Y - Perched at its all-time high with today's 5th consecutive gain. Prior highs in the $273 area define initial support to watch on pullbacks. Volume-driven gains recently triggered a technical buy signal after a rebound above its 50 DMA line ($261) helped its outlook to improve.
>>> FEATURED STOCK ARTICLE : Volume-Driven Breakout for Cigna Corp - 7/7/2022 |
View all notes |
Set NEW NOTE alert |
Company Profile |
SEC
News |
Chart |
Request a new note
C
A
S
I |
|
|
|
THESE ARE NOT BUY RECOMMENDATIONS!
Comments contained in the body of this report are technical
opinions only. The material herein has been obtained
from sources believed to be reliable and accurate, however,
its accuracy and completeness cannot be guaranteed.
This site is not an investment advisor, hence it does
not endorse or recommend any securities or other investments.
Any recommendation contained in this report may not
be suitable for all investors and it is not to be deemed
an offer or solicitation on our part with respect to
the purchase or sale of any securities. All trademarks,
service marks and trade names appearing in this report
are the property of their respective owners, and are
likewise used for identification purposes only.
This report is a service available
only to active Paid Premium Members.
You may opt-out of receiving report notifications
at any time. Questions or comments may be submitted
by writing to Premium Membership Services 665 S.E. 10 Street, Suite 201 Deerfield Beach, FL 33441-5634 or by calling 1-800-965-8307
or 954-785-1121.
|
|
|