You are not logged in.
This means you
CAN ONLY VIEW reports that were published prior to Monday, February 19, 2024.
You
MUST UPGRADE YOUR MEMBERSHIP if you want to see any current reports.
AFTER MARKET UPDATE - MONDAY, JULY 11TH, 2022
Previous After Market Report Next After Market Report >>>
|
|
|
|
DOW |
-164.31 |
31,173.84 |
-0.52% |
|
Volume |
801,659,648 |
+2% |
|
Volume |
4,340,324,200 |
-3% |
|
NASDAQ |
-262.71 |
11,372.60 |
-2.26% |
|
Advancers |
945 |
31% |
|
Advancers |
1,208 |
28% |
|
S&P 500 |
-44.95 |
3,854.43 |
-1.15% |
|
Decliners |
2,133 |
69% |
|
Decliners |
3,143 |
72% |
|
Russell 2000 |
-37.36 |
1,732.01 |
-2.11% |
|
52 Wk Highs |
5 |
|
|
52 Wk Highs |
24 |
|
|
S&P 600 |
-15.49 |
1,128.35 |
-1.35% |
|
52 Wk Lows |
132 |
|
|
52 Wk Lows |
185 |
|
|
 |
Leadership Thin and Breadth Negative as Major Indices Lost Ground
Kenneth J. Gruneisen - Passed the CAN SLIM® Master's Exam
The Dow lost 164 points, while the S&P 500 fell 1.2%. The Nasdaq Composite retreated 2.3% amid weakness in mega-cap shares. The tech-heavy index snapped a five-day stretch of gains that had been its longest winning streak since November 2021. Volume totals reported were slightly higher than the prior session on the NYSE and lower on the Nasdaq exchange. Breadth was negative as decliners led advancers by a 2-1 margin on the NYSE and by a 5-2 margin on the Nasdaq exchange. There were 6 high-ranked companies from the Leaders List that hit new 52-week highs and were listed on the BreakOuts Page, versus the total of 7 on the prior session. New 52-week lows totals still outnumbered new 52-week highs on the NYSE and on the Nasdaq exchange. The brief new market uptrend is already under pressure (M criteria). Any sustainable rally requires a healthy crop of leading stocks hitting new highs, but leadership has been very thin.
Chart courtesy of www.stockcharts.com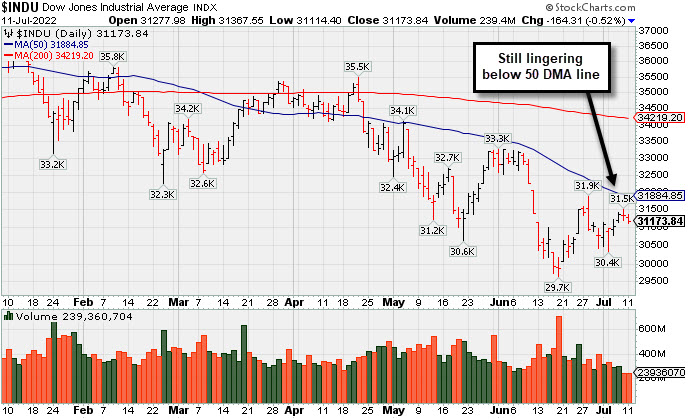 PICTURED: The Dow Jones Industrial Average has been sputtering below its 50-day with lighter volume.
U.S. stocks finished lower on Monday as lingering market headwinds continued to inspire a perceived risk-off tone. Last Friday, a solid monthly jobs report reinforced expectations for continued aggressive monetary policy tightening from the Federal Reserve. Market participants are also awaiting a key update on inflation (Wednesday). Meanwhile, worsening COVID-19 trends in China renewed prospects for more lockdowns in the world’s second largest economy. Second-quarter corporate earnings season could also represent the next catalyst for stocks as investors parse reports this week for any signs of guidance revisions or cautious management commentary.
Treasuries strengthened, with the yield on the 10-year note yield down 10 basis points (0.10%) to 2.98%, still below the shorter-dated two-year note yield, which declined four basis points (0.04%) to 3.06%. This inversion of the yield curve persisted for a fifth session as worries over a possible recession lingered. In FOREX trading, a gauge of the U.S. dollar surged 1.2% as the greenback caught a perceived safe haven bid.
Nine of 11 S&P 500 sectors closed negative territory, with growth-oriented groups leading the downturn. Twitter Inc. (TWTR -10.7%) slumped after Elon Musk terminated a $44 billion deal to buy the social media company. Casino stocks also fared poorly amid news Macau closed its gaming venues for the week for the first time since February 2020. Bond proxies outperformed, with Utilities and Real Estate bucking the downtrend.
|
 Kenneth J. Gruneisen started out as a licensed stockbroker in August 1987, a couple of months prior to the historic stock market crash that took the Dow Jones Industrial Average down -22.6% in a single day. He has published daily fact-based fundamental and technical analysis on high-ranked stocks online for two decades. Through FACTBASEDINVESTING.COM, Kenneth provides educational articles, news, market commentary, and other information regarding proven investment systems that work in good times and bad.
Comments contained in the body of this report are technical opinions only and are not necessarily those of Gruneisen Growth Corp. The material herein has been obtained from sources believed to be reliable and accurate, however, its accuracy and completeness cannot be guaranteed. Our firm, employees, and customers may effect transactions, including transactions contrary to any recommendation herein, or have positions in the securities mentioned herein or options with respect thereto. Any recommendation contained in this report may not be suitable for all investors and it is not to be deemed an offer or solicitation on our part with respect to the purchase or sale of any securities. |
|
 |
Financial, Retail, Tech, and Commodity Linked Groups Fell
Kenneth J. Gruneisen - Passed the CAN SLIM® Master's Exam
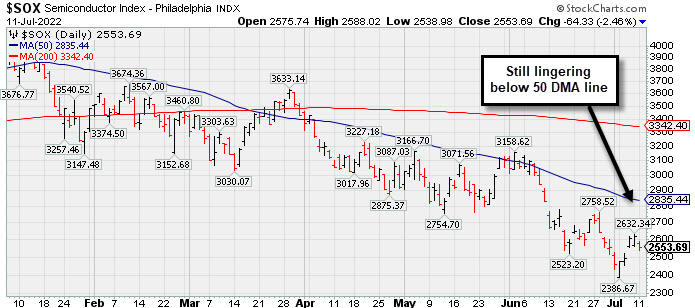
The Broker/Dealer Index ($XBD -1.54%), Bank Index ($BKX -0.86%), and Retail Index ($RLX -1.98%) each lost ground and weighed on the major averages. The Semiconductor Index ($SOX -2.46%), Networking Index ($NWX -2.08%), and Biotech Index ($BTK -1.71%) fell. Commodity-linked groups also fell as the Oil Services Index ($OSX -2.78%), Integrated Oil Index ($XOI -1.00%), and Gold & Silver Index ($XAU -1.25%) each lost ground.
PICTURED: The Semiconductor Index ($SOX -2.46%) is still lingering below its 50-day moving average (DMA) line and still sputtering near its 2022 low.
| Oil Services |
$OSX |
62.37 |
-1.79 |
-2.78% |
+18.30% |
| Integrated Oil |
$XOI |
1,441.18 |
-14.51 |
-1.00% |
+22.32% |
| Semiconductor |
$SOX |
2,553.69 |
-64.33 |
-2.46% |
-35.29% |
| Networking |
$NWX |
687.11 |
-14.61 |
-2.08% |
-29.24% |
| Broker/Dealer |
$XBD |
390.43 |
-6.11 |
-1.54% |
-19.81% |
| Retail |
$RLX |
2,973.08 |
-60.20 |
-1.98% |
-29.66% |
| Gold & Silver |
$XAU |
107.60 |
-1.37 |
-1.25% |
-18.76% |
| Bank |
$BKX |
102.11 |
-0.89 |
-0.86% |
-22.77% |
| Biotech |
$BTK |
4,822.52 |
-83.66 |
-1.71% |
-12.61% |
|
|
|
 |
Featured Stocks
Kenneth J. Gruneisen - Passed the CAN SLIM® Master's Exam
|
|
|
Color Codes Explained :
Y - Better candidates highlighted by our
staff of experts.
G - Previously featured
in past reports as yellow but may no longer be buyable under the
guidelines.
***Last / Change / Volume data in this table is the closing quote data***
Symbol/Exchange
Company Name
Industry Group |
PRICE |
CHANGE
(%Change) |
Day High |
Volume
(% DAV)
(% 50 day avg vol) |
52 Wk Hi
% From Hi |
Featured
Date |
Price
Featured |
Pivot Featured |
|
Max Buy |
 LLY
-
NYSE
LLY
-
NYSE
Eli Lilly & Co
Medical-Diversified
|
$331.07
|
+0.60
0.18% |
$332.68
|
1,342,385
42.92% of 50 DAV
50 DAV is 3,128,000
|
$334.52
-1.03%
|
5/16/2022
|
$302.46
|
PP = $314.10
|
|
MB = $329.81
|
 Most Recent Note - 7/11/2022 5:53:50 PM
G - Volume totals have been cooling while recently wedging up above its "max buy" level . Its 50 DMA line ($305) defines near-term support above prior lows. See the latest FSU analysis for more detailed analysis and an annotated graph.
>>> FEATURED STOCK ARTICLE : Lilly Quietly Wedged to a New All-Time High This Week - 7/8/2022 |
View all notes |
Set NEW NOTE alert |
Company Profile |
SEC
News |
Chart |
Request a new note
C
A
S
I |
IMXI
-
NASDAQ
International Money Exp
Financial Svcs-Specialty
|
$21.99
|
-0.49
-2.18% |
$22.69
|
382,784
96.66% of 50 DAV
50 DAV is 396,000
|
$22.94
-4.14%
|
7/1/2022
|
$21.27
|
PP = $21.38
|
|
MB = $22.45
|
Most Recent Note - 7/11/2022 5:52:19 PM
G - Pulled back from its 52-week high with near average volume behind its 3rd consecutive loss. Color code is changed to yellow after pulling back below its "max buy" level. No resistance remains due to overhead supply. Rebound above the 50 DMA line ($20.18) helped its outlook improve. Fundamentals through the Mar '22 quarter have been strong.
>>> FEATURED STOCK ARTICLE : Volume Heavy While Rallying from Double Bottom Base - 7/1/2022 |
View all notes |
Set NEW NOTE alert |
Company Profile |
SEC
News |
Chart |
Request a new note
C
A
S
I |
HRMY
-
NASDAQ
Harmony Biosciences Hldg
Medical-Biomed/Biotech
|
$54.70
|
-0.05
-0.09% |
$55.25
|
332,705
62.77% of 50 DAV
50 DAV is 530,000
|
$57.13
-4.25%
|
7/6/2022
|
$54.12
|
PP = $52.85
|
|
MB = $55.49
|
Most Recent Note - 7/11/2022 5:50:23 PM
Y - Perched near its with volume-totals cooling following 4 consecutive gains marked by above average volume as it rallied to new highs and triggered a technical buy signal. Prior highs in the $52-54 area define initial support to watch on pullbacks. Reported strong sales revenues and earnings increases in quarterly comparisons through Mar '22 versus the year ago periods. Annual earnings history is limited. Completed its $24 IPO on 8/19/20.
>>> FEATURED STOCK ARTICLE : Volume-Driven Breakout For Biotech Firm - 7/6/2022 |
View all notes |
Set NEW NOTE alert |
Company Profile |
SEC
News |
Chart |
Request a new note
C
A
S
I |
CI
-
NYSE
Cigna Corp
Medical-Managed Care
|
$279.91
|
+0.72
0.26% |
$281.91
|
1,550,502
82.78% of 50 DAV
50 DAV is 1,873,000
|
$281.49
-0.56%
|
7/7/2022
|
$276.55
|
PP = $273.68
|
|
MB = $287.36
|
Most Recent Note - 7/11/2022 5:49:16 PM
Y - Perched at its all-time high after today's 4th consecutive gain was backed by lighter volume, but prior volume-driven gains triggered a technical buy signal. Rebound above its 50 DMA line ($260) helped its outlook to improve since dropped from the Featured Stocks list on 6/13/22.
>>> FEATURED STOCK ARTICLE : Volume-Driven Breakout for Cigna Corp - 7/7/2022 |
View all notes |
Set NEW NOTE alert |
Company Profile |
SEC
News |
Chart |
Request a new note
C
A
S
I |
|
|
|
THESE ARE NOT BUY RECOMMENDATIONS!
Comments contained in the body of this report are technical
opinions only. The material herein has been obtained
from sources believed to be reliable and accurate, however,
its accuracy and completeness cannot be guaranteed.
This site is not an investment advisor, hence it does
not endorse or recommend any securities or other investments.
Any recommendation contained in this report may not
be suitable for all investors and it is not to be deemed
an offer or solicitation on our part with respect to
the purchase or sale of any securities. All trademarks,
service marks and trade names appearing in this report
are the property of their respective owners, and are
likewise used for identification purposes only.
This report is a service available
only to active Paid Premium Members.
You may opt-out of receiving report notifications
at any time. Questions or comments may be submitted
by writing to Premium Membership Services 665 S.E. 10 Street, Suite 201 Deerfield Beach, FL 33441-5634 or by calling 1-800-965-8307
or 954-785-1121.
|
|
|