You are not logged in.
This means you
CAN ONLY VIEW reports that were published prior to Monday, February 19, 2024.
You
MUST UPGRADE YOUR MEMBERSHIP if you want to see any current reports.
AFTER MARKET UPDATE - THURSDAY, JULY 11TH, 2019
Previous After Market Report Next After Market Report >>>
|
|
|
|
DOW |
+227.88 |
27,088.08 |
+0.85% |
|
Volume |
684,467,110 |
-2% |
|
Volume |
1,943,654,914 |
-4% |
|
NASDAQ |
-6.49 |
8,196.04 |
-0.08% |
|
Advancers |
1,434 |
50% |
|
Advancers |
1,320 |
44% |
|
S&P 500 |
+6.84 |
2,999.91 |
+0.23% |
|
Decliners |
1,413 |
50% |
|
Decliners |
1,702 |
56% |
|
Russell 2000 |
-7.13 |
1,557.92 |
-0.46% |
|
52 Wk Highs |
182 |
|
|
52 Wk Highs |
124 |
|
|
S&P 600 |
-4.40 |
944.35 |
-0.46% |
|
52 Wk Lows |
42 |
|
|
52 Wk Lows |
55 |
|
|
 |
Dow Jones Industrial Average and S&P 500 Index End at New Records
Kenneth J. Gruneisen - Passed the CAN SLIM® Master's Exam
The S&P 500 advanced 6 points to 2,999 and the Dow rallied 227 points to 27,088, with both benchmarks finishing at their respective record highs. The Nasdaq Composite bucked the upward trend, finishing down 0.1%. The volume totals reported were lighter than the prior session totals on both the NYSE and on the Nasdaq exchange. Advancers and decliners were evenly mixed on the NYSE but decliners led advancers by a 4-3 margin on the Nasdaq exchange. There were 53 high-ranked companies from the Leaders List hit new 52-week highs and were listed on the BreakOuts Page, versus the total of 84 on the prior session. New 52-week highs totals contracted yet easily outnumbered new 52-week lows on the NYSE and Nasdaq exchange. The major indices (M criteria) are in a "confirmed uptrend" under the fact-based system. The Featured Stocks Page provides the most timely analysis on high-ranked leaders. Charts used courtesy of www.stockcharts.com
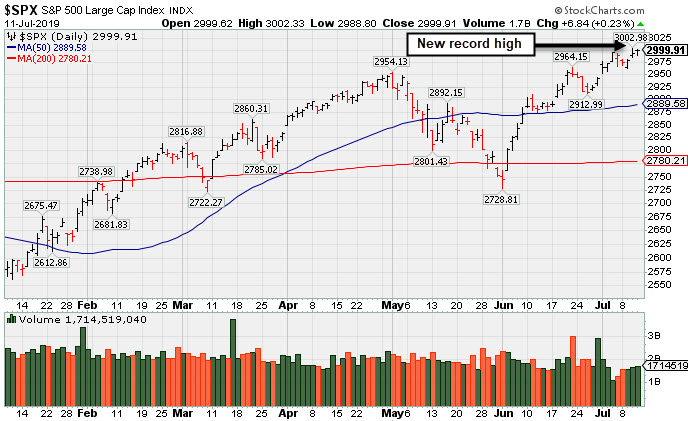
PICTURED: The S&P 500 Index hit a new record high.
Stocks were mixed Thursday as investors digested trade and central bank news. Federal Reserve Chair Jerome Powell continued his semi-annual monetary policy testimony today before the Senate Banking Committee, suggesting that the Fed had room to ease amid a weakening relationship between inflation and unemployment. Yesterday, he reiterated plans to "act as appropriate to sustain the expansion" in the midst of "crosscurrents" posing increased risks to the U.S. economic outlook. The perceived dovish comments solidified expectations that the Fed will likely cut rates, spurring an early rally. Gains were capped, however, after President Trump tweeted that China is "letting us down" by not purchasing U.S. farm products, raising concerns around the trade negotiations.
On the data front, core CPI (excluding food and energy) increased 0.3% in June, the largest uptick in 18 months. Treasuries weakened following the stronger-than-anticipated inflation update, with the yield on the 10-year note up seven basis points to 2.13%. The yield on the 30-year bond rose eight basis points to 2.65% after an auction of the maturity drew soft demand.
Nine of 11 S&P 500 sectors finished in positive territory. Industrials paced the gains with Delta Air Lines (DAL +1.14%) up after delivering record revenue during the last quarter. Financials also outperformed amid a jump in Treasury yields. UnitedHealth (UNH +5.53%) rallied after the Trump administration withdrew its proposed drug rebate overhaul.
|
 Kenneth J. Gruneisen started out as a licensed stockbroker in August 1987, a couple of months prior to the historic stock market crash that took the Dow Jones Industrial Average down -22.6% in a single day. He has published daily fact-based fundamental and technical analysis on high-ranked stocks online for two decades. Through FACTBASEDINVESTING.COM, Kenneth provides educational articles, news, market commentary, and other information regarding proven investment systems that work in good times and bad.
Comments contained in the body of this report are technical opinions only and are not necessarily those of Gruneisen Growth Corp. The material herein has been obtained from sources believed to be reliable and accurate, however, its accuracy and completeness cannot be guaranteed. Our firm, employees, and customers may effect transactions, including transactions contrary to any recommendation herein, or have positions in the securities mentioned herein or options with respect thereto. Any recommendation contained in this report may not be suitable for all investors and it is not to be deemed an offer or solicitation on our part with respect to the purchase or sale of any securities. |
|
 |
Financial, Semiconductor, Networking, and Integrated Oil Indexes Rose
Kenneth J. Gruneisen - Passed the CAN SLIM® Master's Exam
The Broker/Dealer Index ($XBD +0.89%) and Bank Index ($BKX +0.97%) both posted solid gains while the Retail Index ($RLX +0.04%) finished flat. The Semiconductor Index ($SOX +0.32%), Networking Index ($NWX +0.35%) both edged higher while the Biotech Index ($BTK -1.33%) lost ground. The Gold & Silver Index ($XAU -1.05%) slumped and the Oil Services Index ($OSX -0.27%) edged lower while the Integrated Oil Index ($XOI +0.45%)posted a modest gain.
Charts courtesy of www.stockcharts.com
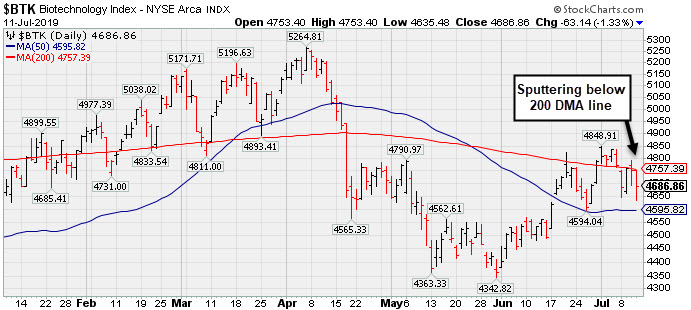 PICTURED: The Biotech Index ($BTK -0.19%) is sputtering near its 200-day moving average (DMA) line.
| Oil Services |
$OSX |
81.52 |
-0.23 |
-0.28% |
+1.14% |
| Integrated Oil |
$XOI |
1,284.48 |
+5.75 |
+0.45% |
+10.82% |
| Semiconductor |
$SOX |
1,476.28 |
+4.77 |
+0.32% |
+27.80% |
| Networking |
$NWX |
580.36 |
+2.02 |
+0.35% |
+18.76% |
| Broker/Dealer |
$XBD |
270.81 |
+2.39 |
+0.89% |
+14.10% |
| Retail |
$RLX |
2,457.96 |
+1.03 |
+0.04% |
+25.96% |
| Gold & Silver |
$XAU |
84.96 |
-0.90 |
-1.05% |
+20.24% |
| Bank |
$BKX |
99.09 |
+0.95 |
+0.97% |
+15.50% |
| Biotech |
$BTK |
4,686.86 |
-63.14 |
-1.33% |
+11.04% |
|
|
|
 |
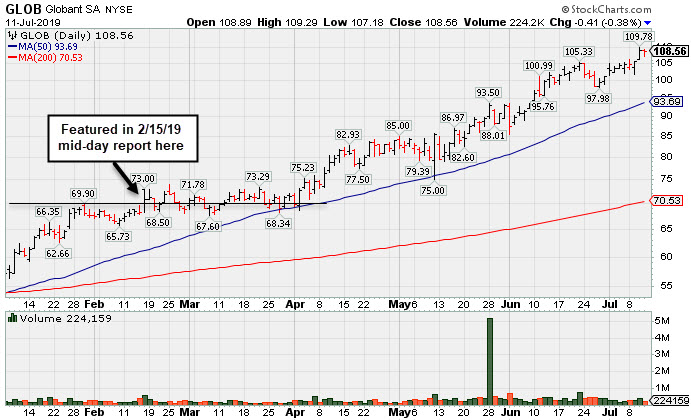
Extended From Any Sound Base After Wedging Higher
Kenneth J. Gruneisen - Passed the CAN SLIM® Master's Exam
Globant SA (GLOB -$0.41 or -0.38% to $108.56) is very extended from any sound base and perched at its all-time high following a spurt of gains marked by below average volume. Its 50-day moving average (DMA) line ($93.69) defines important support to watch on pullbacks.
Fundamentals remain strong. Bullish action came after it reported earnings +32% on +22% sales revenues for the quarter ended March 31st, 2019 versus the year ago period, continuing its strong earning track record. GLOB was last shown in this FSU section on 6/12/19 with an annotated graph under the headline, "Posted Big Gain for Another New High Close". It was highlighted in yellow with pivot point cited based on its 1/30/19 high plus 10 cents in the 2/15/19 mid-day report (read here). Prior quarterly comparisons versus the year ago periods were very near or above the +25% minimum earnings guideline (C criteria). It has a strong annual earnings (A criteria) history and has a 96 Earnings Per Share Rating.
This Luxembourg-based Computer - Tech Services firm completed a Secondary Offering on 6/21/18. The number of top-rated funds owning its shares rose from 235 in Mar '18 to 418 in Jun '19, a reassuring sign concerning the I criteria. Its current Up/Down Volume Ratio of 2.9 is an unbiased indication its shares have been under accumulation over the past 50 days. It has a Timeliness rating of A and Sponsorship Rating of B. Its small supply of 36.3 million shares outstanding (S criteria) can contribute to greater volatility in the event of institutional buying or selling.
Charts courtesy of www.stockcharts.com
|
|
|
Color Codes Explained :
Y - Better candidates highlighted by our
staff of experts.
G - Previously featured
in past reports as yellow but may no longer be buyable under the
guidelines.
***Last / Change / Volume data in this table is the closing quote data***
Symbol/Exchange
Company Name
Industry Group |
PRICE |
CHANGE
(%Change) |
Day High |
Volume
(% DAV)
(% 50 day avg vol) |
52 Wk Hi
% From Hi |
Featured
Date |
Price
Featured |
Pivot Featured |
|
Max Buy |
 SPSC
-
NASDAQ
SPSC
-
NASDAQ
S P S Commerce Inc
COMPUTER SOFTWARE and SERVICES - Application Software
|
$102.84
|
-0.29
-0.28% |
$103.64
|
52,804
35.44% of 50 DAV
50 DAV is 149,000
|
$115.00
-10.57%
|
6/7/2019
|
$107.72
|
PP = $115.10
|
|
MB = $120.86
|
Most Recent Note - 7/9/2019 5:22:39 PM
G - A rebound above its 50 DMA line ($104.26) and subsequent volume-driven gains above the pivot point are needed to trigger a new (or add-on) technical buy signal. Faces some resistance due to overhead supply up to the $115 level. Fundamentals remain strong. See the latest FSU analysis for more details and a new annotated graph.
>>> FEATURED STOCK ARTICLE : Recently Sputtering Below 50-Day Moving Average - 7/9/2019 |
View all notes |
Set NEW NOTE alert |
Company Profile |
SEC
News |
Chart |
Request a new note
C
A
S
I |
EPAM
-
NYSE
Epam Systems Inc
COMPUTER SOFTWARE and SERVICES - Information Technology Service
|
$191.05
|
+2.94
1.56% |
$191.24
|
516,156
99.64% of 50 DAV
50 DAV is 518,000
|
$191.31
-0.14%
|
5/9/2019
|
$169.25
|
PP = $180.55
|
|
MB = $189.58
|
 Most Recent Note - 7/11/2019 5:08:31 PM
G - Perched at its 52-week high today and its color code is changed to green after rallying above its "max buy" level with 11 consecutive gains. Prior highs in the $179-180 area define initial support above its 50 DMA line ($173).
>>> FEATURED STOCK ARTICLE : Perched Near Pivot Point After a New Flat Base - 6/13/2019 |
View all notes |
Set NEW NOTE alert |
Company Profile |
SEC
News |
Chart |
Request a new note
C
A
S
I |
ENV
-
NYSE
Envestnet Inc
FINANCIAL SERVICES - Diversified Investments
|
$71.08
|
+0.74
1.05% |
$71.29
|
250,389
92.05% of 50 DAV
50 DAV is 272,000
|
$72.67
-2.19%
|
3/15/2019
|
$66.05
|
PP = $64.90
|
|
MB = $68.15
|
Most Recent Note - 7/8/2019 4:17:37 PM
G - Consolidating above its 50 DMA line ($68.90) and perched within striking distance of its 52-week high. Prior lows in the $65-66 area define the next important near-term support to watch. Recently reported earnings +5% on +1% sales revenues for the Mar '19 quarter, below the +25% minimum earnings guideline (C criteria).
>>> FEATURED STOCK ARTICLE : Rebounded Above 50-Day Moving Average Line - 7/2/2019 |
View all notes |
Set NEW NOTE alert |
Company Profile |
SEC
News |
Chart |
Request a new note
C
A
S
I |
LHCG
-
NASDAQ
L H C Group Inc
HEALTH SERVICES - Home Health Care
|
$124.78
|
+1.89
1.54% |
$125.28
|
261,110
114.02% of 50 DAV
50 DAV is 229,000
|
$123.14
1.33%
|
7/1/2019
|
$110.94
|
PP = $122.20
|
|
MB = $128.31
|
Most Recent Note - 7/9/2019 12:49:41 PM
Y - Pulling back from its all-time high after wedging higher. Subsequent gains above its pivot point backed by at least +40% above average volume may trigger a new (or add-on) technical buy signal. Its 50 DMA line ($116) defines near-term support above recent lows. Fundamentals remain strong.
>>> FEATURED STOCK ARTICLE : Prior Gains Lacked Volume; 50-Day Moving Average Defines Support - 6/17/2019 |
View all notes |
Set NEW NOTE alert |
Company Profile |
SEC
News |
Chart |
Request a new note
C
A
S
I |
ENSG
-
NASDAQ
Ensign Group Inc
HEALTH SERVICES - Long-Term Care Facilities
|
$57.85
|
+0.50
0.87% |
$58.05
|
161,194
53.02% of 50 DAV
50 DAV is 304,000
|
$58.88
-1.75%
|
4/30/2019
|
$51.46
|
PP = $53.30
|
|
MB = $55.97
|
Most Recent Note - 7/8/2019 4:16:03 PM
G - Perched near its all-time high. Its 50 DMA line ($54.85) and recent low ($52.34 on 5/31/19) define near-term support to watch. Recently reported earnings +22% on +12% sales revenues for the Mar '19 quarter, below the +25% minimum earnings guideline (C criteria), raising fundamental concerns.
>>> FEATURED STOCK ARTICLE : Nursing Facility Operator Touched New High - 7/1/2019 |
View all notes |
Set NEW NOTE alert |
Company Profile |
SEC
News |
Chart |
Request a new note
C
A
S
I |
Symbol/Exchange
Company Name
Industry Group |
PRICE |
CHANGE
(%Change) |
Day High |
Volume
(% DAV)
(% 50 day avg vol) |
52 Wk Hi
% From Hi |
Featured
Date |
Price
Featured |
Pivot Featured |
|
Max Buy |
CHDN
-
NASDAQ
Churchill Downs Inc
LEISURE - Gaming Activities
|
$114.73
|
-2.25
-1.92% |
$117.23
|
182,333
61.19% of 50 DAV
50 DAV is 298,000
|
$118.89
-3.50%
|
6/5/2019
|
$108.87
|
PP = $104.96
|
|
MB = $110.21
|
Most Recent Note - 7/11/2019 5:09:52 PM
G - Consolidating near its all-time high, extended from any sound base. Its 50 DMA line ($106.20) and prior highs in the $104 area define important near-term support to watch on pullbacks. Share price was impacted by a 3:1 split when noted on 1/28/19.
>>> FEATURED STOCK ARTICLE : Consolidating Near 50-Day Moving Average - 6/29/2018 |
View all notes |
Set NEW NOTE alert |
Company Profile |
SEC
News |
Chart |
Request a new note
C
A
S
I |
WWD
-
NASDAQ
Woodward Inc
MANUFACTURING - Diversified Machinery
|
$113.64
|
+0.78
0.69% |
$113.74
|
265,918
48.88% of 50 DAV
50 DAV is 544,000
|
$116.46
-2.42%
|
6/18/2019
|
$112.34
|
PP = $114.65
|
|
MB = $120.38
|
Most Recent Note - 7/11/2019 5:17:28 PM
Y - Posted a quiet gain today finding support above its 50 DMA line, still perched near its all-time high. Subsequent gains for new highs backed by at least +40% above average volume may clinch a convincing technical buy signal. Fundamentals remain strong.
>>> FEATURED STOCK ARTICLE : High Ranked Industrial Firm Perched Near All-Time High - 6/18/2019 |
View all notes |
Set NEW NOTE alert |
Company Profile |
SEC
News |
Chart |
Request a new note
C
A
S
I |
LULU
-
NASDAQ
Lululemon Athletica
MANUFACTURING - Textile Manufacturing
|
$183.07
|
-0.80
-0.44% |
$184.41
|
1,243,316
58.10% of 50 DAV
50 DAV is 2,140,000
|
$190.52
-3.91%
|
6/13/2019
|
$174.48
|
PP = $179.60
|
|
MB = $188.58
|
Most Recent Note - 7/8/2019 4:23:09 PM
Y - Found support while recently consolidating above its 50 DMA line ($175.69) which defines important support above the prior low ($160.88 on 5/29/19). Reported Apr '19 quarterly earnings +35% on +20% sales revenues versus the ear ago period.
>>> FEATURED STOCK ARTICLE : Perched Near High Following Another Strong Earnings Report - 6/14/2019 |
View all notes |
Set NEW NOTE alert |
Company Profile |
SEC
News |
Chart |
Request a new note
C
A
S
I |
ULTA
-
NASDAQ
Ulta Beauty Inc
SPECIALTY RETAIL - Specialty Retail, Other
|
$346.98
|
-0.22
-0.06% |
$349.95
|
535,022
69.39% of 50 DAV
50 DAV is 771,000
|
$365.54
-5.08%
|
3/15/2019
|
$341.27
|
PP = $322.59
|
|
MB = $338.72
|
Most Recent Note - 7/11/2019 5:15:27 PM
G - Volume totals have been cooling while hovering above its 50 DMA line ($343), perched within striking distance of its all-time high. Reported earnings +17% on +13% sales revenues for the Apr '19 quarter, below the +25% minimum earnings guideline (C criteria), raising fundamental concerns.
>>> FEATURED STOCK ARTICLE : Stalled After Recently Wedging to New Record High - 7/5/2019 |
View all notes |
Set NEW NOTE alert |
Company Profile |
SEC
News |
Chart |
Request a new note
C
A
S
I |
CHGG
-
NYSE
Chegg Inc
Consumer Svcs-Education
|
$44.73
|
+1.11
2.54% |
$44.83
|
2,923,867
180.82% of 50 DAV
50 DAV is 1,617,000
|
$44.45
0.63%
|
7/8/2019
|
$44.11
|
PP = $41.79
|
|
MB = $43.88
|
Most Recent Note - 7/11/2019 5:05:44 PM
G - Hit a new 52-week high and its color code is changed to green after rallying above its "max buy" level with above average volume behind today's 11th consecutive gain. Triggered a technical buy signal with a volume-driven gain when highlighted in the 7/08/19 mid-day report. Prior highs in the $40-41 area define initial support to watch on pullbacks.
>>> FEATURED STOCK ARTICLE : Tallied a Big Volume-Driven Breakout Gain for a New High - 7/8/2019 |
View all notes |
Set NEW NOTE alert |
Company Profile |
SEC
News |
Chart |
Request a new note
C
A
S
I |
Symbol/Exchange
Company Name
Industry Group |
PRICE |
CHANGE
(%Change) |
Day High |
Volume
(% DAV)
(% 50 day avg vol) |
52 Wk Hi
% From Hi |
Featured
Date |
Price
Featured |
Pivot Featured |
|
Max Buy |
ESNT
-
NYSE
Essent Group Ltd
Finance-MrtgandRel Svc
|
$48.94
|
+0.16
0.33% |
$48.94
|
661,772
106.39% of 50 DAV
50 DAV is 622,000
|
$50.51
-3.11%
|
3/18/2019
|
$45.84
|
PP = $45.06
|
|
MB = $47.31
|
Most Recent Note - 7/11/2019 11:54:52 AM
G - Still quietly consolidating above its 50 DMA line ($47.84) and very little resistance remains due to overhead supply. Fundamental concerns remain since it reported earnings +15% on +20% sales revenues for the Mar '19 quarter, below the +25% minimum earnings guideline (C criteria).
>>> FEATURED STOCK ARTICLE : Rebounded Above 50 Day Moving Average After Violation - 7/3/2019 |
View all notes |
Set NEW NOTE alert |
Company Profile |
SEC
News |
Chart |
Request a new note
C
A
S
I |
NOW
-
NYSE
Servicenow Inc
Computer Sftwr-Enterprse
|
$302.31
|
+3.56
1.19% |
$302.63
|
883,811
54.06% of 50 DAV
50 DAV is 1,635,000
|
$302.99
-0.22%
|
4/22/2019
|
$242.64
|
PP = $251.75
|
|
MB = $264.34
|
Most Recent Note - 7/8/2019 4:23:53 PM
G - Still perched near its all-time high, extended from an sound base. Its 50 DMA line ($272.76) defines near-term support to watch. Recently reported earnings +20% on +34% sales revenues for the Mar '19 quarter, below the +25% minimum earnings guideline (C criteria), raising fundamental concerns.
>>> FEATURED STOCK ARTICLE : Pulling Back After Wedging to New Highs - 6/26/2019 |
View all notes |
Set NEW NOTE alert |
Company Profile |
SEC
News |
Chart |
Request a new note
C
A
S
I |
VEEV
-
NYSE
Veeva Systems Inc Cl A
Computer Sftwr-Medical
|
$175.65
|
+1.83
1.05% |
$175.78
|
920,595
60.65% of 50 DAV
50 DAV is 1,518,000
|
$176.62
-0.55%
|
5/30/2019
|
$154.32
|
PP = $145.80
|
|
MB = $153.09
|
Most Recent Note - 7/9/2019 3:17:42 PM
G -Poised for a best-ever close with today's gain backed by light volume. It remains very extended from any sound base. Its prior low and 50 DMA line ($153.35) define near-term support. Reported earnings +52% on +25% sales revenues for the Apr '19 quarter, marking its 5th strong quarter with earnings above the +25% minimum guideline (C criteria).
>>> FEATURED STOCK ARTICLE : Halted Slide After 4 Volume-Driven Losses From High - 6/27/2019 |
View all notes |
Set NEW NOTE alert |
Company Profile |
SEC
News |
Chart |
Request a new note
C
A
S
I |
PAYC
-
NYSE
Paycom Software Inc
COMPUTER SOFTWARE and SERVICES - Application Software
|
$243.87
|
-0.60
-0.25% |
$246.85
|
520,372
66.97% of 50 DAV
50 DAV is 777,000
|
$245.38
-0.62%
|
2/6/2019
|
$171.66
|
PP = $164.18
|
|
MB = $172.39
|
Most Recent Note - 7/9/2019 11:48:03 AM
G - Extended from any sound base and wedging into new high territory with recent gains lacking great volume conviction. Its 50 DMA line ($215) defines near-term support to watch Reported earnings +25% on +30% sales revenues for the Mar '19 quarter.
>>> FEATURED STOCK ARTICLE : Perched Near High Extended From Any Sound Base - 6/28/2019 |
View all notes |
Set NEW NOTE alert |
Company Profile |
SEC
News |
Chart |
Request a new note
C
A
S
I |
PYPL
-
NASDAQ
Paypal Holdings Inc
Finance-CrdtCard/PmtPr
|
$120.65
|
+1.01
0.84% |
$120.75
|
4,865,415
91.03% of 50 DAV
50 DAV is 5,345,000
|
$120.20
0.37%
|
1/24/2019
|
$92.56
|
PP = $93.80
|
|
MB = $98.49
|
Most Recent Note - 7/8/2019 4:26:23 PM
G - It remains quietly perched near its all-time high. Did not form a sound base, yet promptly rebounded after violating its 50 DMA line and prior low ($106.52) on 6/03/19. Recently reported earnings +37% on +12% sales revenues for the Mar '19 quarter, continuing its strong earnings track record.
>>> FEATURED STOCK ARTICLE : Popular Payments Firm Extended From Any Sound Base - 6/19/2019 |
View all notes |
Set NEW NOTE alert |
Company Profile |
SEC
News |
Chart |
Request a new note
C
A
S
I |
Symbol/Exchange
Company Name
Industry Group |
PRICE |
CHANGE
(%Change) |
Day High |
Volume
(% DAV)
(% 50 day avg vol) |
52 Wk Hi
% From Hi |
Featured
Date |
Price
Featured |
Pivot Featured |
|
Max Buy |
PLNT
-
NYSE
Planet Fitness Inc Cl A
Leisure-Services
|
$76.67
|
+0.00
0.00% |
$76.85
|
946,541
55.74% of 50 DAV
50 DAV is 1,698,000
|
$81.90
-6.39%
|
11/7/2018
|
$57.10
|
PP = $55.45
|
|
MB = $58.22
|
Most Recent Note - 7/8/2019 4:25:07 PM
G - Its 50 DMA line has acted as resistance, but a rebound above the 50 DMA line ($76.58) is needed for its outlook to improve. Fundamentals remain strong.
>>> FEATURED STOCK ARTICLE : Undercut 50-Day Moving Average With Volume Behind Losses - 6/21/2019 |
View all notes |
Set NEW NOTE alert |
Company Profile |
SEC
News |
Chart |
Request a new note
C
A
S
I |
BLD
-
NYSE
Topbuild Corp
Bldg-Constr Prds/Misc
|
$82.25
|
+0.58
0.71% |
$82.25
|
187,912
55.93% of 50 DAV
50 DAV is 336,000
|
$86.96
-5.42%
|
5/17/2019
|
$82.19
|
PP = $87.31
|
|
MB = $91.68
|
Most Recent Note - 7/11/2019 5:13:42 PM
Y - Still perched within striking distance of its 52-week high. Consolidating above support defined by its 50 DMA line ($80.20) and recent lows. Subsequent gains above the pivot point backed by at least +40% above average volume may trigger a technical buy signal. Fundamentals remain strong.
>>> FEATURED STOCK ARTICLE : Found Support at 50-Day Moving Averge Line - 6/20/2019 |
View all notes |
Set NEW NOTE alert |
Company Profile |
SEC
News |
Chart |
Request a new note
C
A
S
I |
TEAM
-
NASDAQ
Atlassian Corp Plc Cl A
Comp Sftwr-Spec Enterprs
|
$140.90
|
+0.54
0.38% |
$142.30
|
689,696
47.50% of 50 DAV
50 DAV is 1,452,000
|
$143.68
-1.93%
|
5/24/2019
|
$129.52
|
PP = $132.09
|
|
MB = $138.69
|
Most Recent Note - 7/9/2019 3:15:40 PM
G - Color code is changed to green after quietly rising above its "max buy" level to a new all-time high. The 50 DMA line ($126) and prior low ($123.43 on 6/25/19) define important near-term support to watch. Reported earnings +133% on +38% sales revenues for the Mar '19 quarter, continuing its strong earnings track record.
>>> FEATURED STOCK ARTICLE : Perched at High After Wedging into New High Territory - 6/24/2019 |
View all notes |
Set NEW NOTE alert |
Company Profile |
SEC
News |
Chart |
Request a new note
C
A
S
I |
UPLD
-
NASDAQ
Upland Software Inc
Computer Sftwr-Enterprse
|
$47.00
|
-0.50
-1.05% |
$47.98
|
170,095
29.03% of 50 DAV
50 DAV is 586,000
|
$54.87
-14.34%
|
6/10/2019
|
$53.30
|
PP = $50.74
|
|
MB = $53.28
|
Most Recent Note - 7/8/2019 4:30:16 PM
G - Its 50 DMA line ($47.19) has been acting as resistance, meanwhile, a rebound above it is needed for its outlook to improve.Completed a new Public Offering on 5/08/19. Quarterly comparisons through Mar '19 have shown impressive sales revenues growth and greatly improved earnings increases above the +25% minimum guideline (C criteria).
>>> FEATURED STOCK ARTICLE : Consolidating Near 50-Day Average After Slump Into Prior Base - 7/10/2019 |
View all notes |
Set NEW NOTE alert |
Company Profile |
SEC
News |
Chart |
Request a new note
C
A
S
I |
GLOB
-
NYSE
Globant SA
Computer-Tech Services
|
$108.56
|
-0.41
-0.38% |
$109.29
|
224,159
51.65% of 50 DAV
50 DAV is 434,000
|
$109.78
-1.11%
|
2/15/2019
|
$69.35
|
PP = $70.00
|
|
MB = $73.50
|
Most Recent Note - 7/11/2019 5:11:41 PM
G - Perched at its all-time after wedging higher with recent gains lacking great volume conviction, very extended from any sound base. Its 50 DMA line ($93.69) defines important support to watch on pullbacks. Fundamentals remain strong.
>>> FEATURED STOCK ARTICLE : Extended From Any Sound Base After Wedging Higher - 7/11/2019 |
View all notes |
Set NEW NOTE alert |
Company Profile |
SEC
News |
Chart |
Request a new note
C
A
S
I |
Symbol/Exchange
Company Name
Industry Group |
PRICE |
CHANGE
(%Change) |
Day High |
Volume
(% DAV)
(% 50 day avg vol) |
52 Wk Hi
% From Hi |
Featured
Date |
Price
Featured |
Pivot Featured |
|
Max Buy |
PAGS
-
NYSE
Pagseguro Digital Cl A
Finance-CrdtCard/PmtPr
|
$42.93
|
-0.05
-0.12% |
$43.28
|
2,377,582
111.78% of 50 DAV
50 DAV is 2,127,000
|
$43.84
-2.08%
|
6/25/2019
|
$37.69
|
PP = $40.07
|
|
MB = $42.07
|
Most Recent Note - 7/10/2019 12:56:55 PM
G - Gapped up today and its color code is changed to green after trading above its "max buy" level, hitting a new high with ever increasing volume behind its 6th consecutive gain. It was highlighted in yellow with pivot point cited based on its 3/29/18 high plus 10 cents in the 6/25/19 mid-day report.
>>> FEATURED STOCK ARTICLE : Brazilian Payment Tech Firm Perched Near High - 6/25/2019 |
View all notes |
Set NEW NOTE alert |
Company Profile |
SEC
News |
Chart |
Request a new note
C
A
S
I |
|
|
|
THESE ARE NOT BUY RECOMMENDATIONS!
Comments contained in the body of this report are technical
opinions only. The material herein has been obtained
from sources believed to be reliable and accurate, however,
its accuracy and completeness cannot be guaranteed.
This site is not an investment advisor, hence it does
not endorse or recommend any securities or other investments.
Any recommendation contained in this report may not
be suitable for all investors and it is not to be deemed
an offer or solicitation on our part with respect to
the purchase or sale of any securities. All trademarks,
service marks and trade names appearing in this report
are the property of their respective owners, and are
likewise used for identification purposes only.
This report is a service available
only to active Paid Premium Members.
You may opt-out of receiving report notifications
at any time. Questions or comments may be submitted
by writing to Premium Membership Services 665 S.E. 10 Street, Suite 201 Deerfield Beach, FL 33441-5634 or by calling 1-800-965-8307
or 954-785-1121.
|
|
|

