You are not logged in.
This means you
CAN ONLY VIEW reports that were published prior to Sunday, February 25, 2024.
You
MUST UPGRADE YOUR MEMBERSHIP if you want to see any current reports.
AFTER MARKET UPDATE - THURSDAY, JULY 9TH, 2020
Previous After Market Report Next After Market Report >>>
|
|
|
|
DOW |
-361.19 |
25,706.09 |
-1.39% |
|
Volume |
972,036,831 |
-4% |
|
Volume |
3,979,360,300 |
+0% |
|
NASDAQ |
+55.25 |
10,547.75 |
+0.53% |
|
Advancers |
771 |
27% |
|
Advancers |
1,029 |
33% |
|
S&P 500 |
-17.89 |
3,152.05 |
-0.56% |
|
Decliners |
2,125 |
73% |
|
Decliners |
2,129 |
67% |
|
Russell 2000 |
-28.48 |
1,398.92 |
-2.00% |
|
52 Wk Highs |
85 |
|
|
52 Wk Highs |
181 |
|
|
S&P 600 |
-18.70 |
799.86 |
-2.28% |
|
52 Wk Lows |
16 |
|
|
52 Wk Lows |
35 |
|
|
 |
Tech-Heavy Nasdaq Composite Continues to Led Market Rally
Kenneth J. Gruneisen - Passed the CAN SLIM® Master's Exam
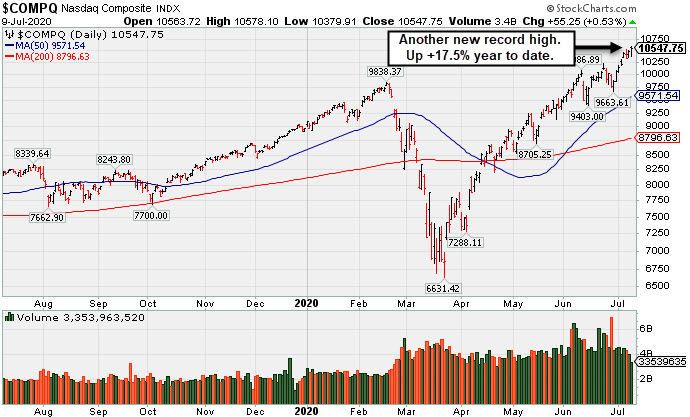
The Nasdaq Composite Index reversed midday losses to add 0.5%, notching its fifth record high so far this month. Meanwhile, the Dow slumped 361 points, and the S&P 500 lost 0.6%. Breadth was negative as decliners led advancers by almost a 3-1 margin on the NYSE and 2-1 on the Nasdaq exchange. The reported volume totals were mixed, lighter than the prior session on the NYSE and slightly higher on the Nasdaq exchange. There were 95 high-ranked companies from the Leaders List that hit new 52-week highs and were listed on the BreakOuts Page, versus the total of 68 on the prior session. New 52-week highs totals expanded and solidly outnumbered new 52-week lows totals on both exchanges. The major indices are in a confirmed uptrend (M criteria). Any sustainable rally requires a healthy crop of new leaders, so it remains ever-important to see substantial new highs totals.Charts used courtesy of www.stockcharts.com
PICTURED: The Nasdaq Composite Index hit a new record high and is up +17.5% year-to-date.
Stock U.S. equities finished mixed on Thursday as the uptick in coronavirus infections continued to weigh on risk sentiment. The Nasdaq Composite extended its divergence. Investors also assessed updates on the U.S. labor market, as high-profiled companies in the Financial and Industrial sectors warned of potential job cuts numbering in the thousands. Meanwhile, weekly initial jobless claims eased more than anticipated to 1.31 million for the week ending July 4th, but remained elevated above the 1 million mark for the 16th straight week. Treasuries strengthened amid the perceived risk-off tone, with the yield on the 10-year note down four basis points to 0.61%. The 30-year bond fell eight basis points to 1.31% following strong demand for the maturity’s auction.
Nine of 11 S&P 500 sectors ended in negative territory. The Consumer Discretionary and Technology groups were the lone gainers, with Amazon (AMZN +3.29%) and chipmakers adding more than 1%. Energy led laggards with WTI crude falling 3.5% to $39.48/barrel. In earnings, Walgreens Boots Alliance (WBA -7.76%) fell after third-quarter profits missed expectations, while also suspending its share buyback program and announcing plans to cut jobs. Bed Bath and Beyond (BBBY -24.50%) fell after a disappointing earnings report and releasing plans to close roughly 200 stores over the next two years. Elsewhere, Costco (COST +2.91%) hit a new all-time high after the bulk discount retailer reported stronger than expected June sales.
|
 Kenneth J. Gruneisen started out as a licensed stockbroker in August 1987, a couple of months prior to the historic stock market crash that took the Dow Jones Industrial Average down -22.6% in a single day. He has published daily fact-based fundamental and technical analysis on high-ranked stocks online for two decades. Through FACTBASEDINVESTING.COM, Kenneth provides educational articles, news, market commentary, and other information regarding proven investment systems that work in good times and bad.
Comments contained in the body of this report are technical opinions only and are not necessarily those of Gruneisen Growth Corp. The material herein has been obtained from sources believed to be reliable and accurate, however, its accuracy and completeness cannot be guaranteed. Our firm, employees, and customers may effect transactions, including transactions contrary to any recommendation herein, or have positions in the securities mentioned herein or options with respect thereto. Any recommendation contained in this report may not be suitable for all investors and it is not to be deemed an offer or solicitation on our part with respect to the purchase or sale of any securities. |
|
 |
Retail, Semiconductor, and Networking Indexes Rose
Kenneth J. Gruneisen - Passed the CAN SLIM® Master's Exam
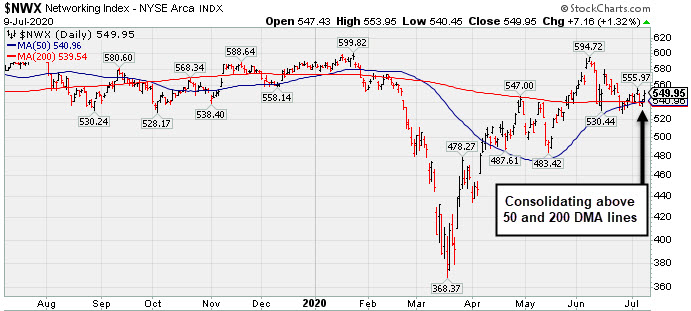
The Retail Index ($RLX +1.79%) posted a solid gain while the Broker/Dealer Index ($XBD -2.16%) and the Bank Index ($BKX -3.44%) both fell. The tech sector was mixed as the Semiconductor Index ($SOX +1.32%) and the Networking Index ($NWX +1.32%) both rose, but the Biotech Index ($BTK -0.14%) edged lower. Energy-linked groups were weak as the Integrated Oil Index ($XOI -5.24%) and the Oil Services Index ($OSX -5.25%) both suffered large losses. The Gold & Silver Index ($XAU -0.02%) finished flat.
PICTURED: The Networking Index ($NWX +1.32%) is consolidating above its 50-day and 200-day moving average (DMA) lines.
| Oil Services |
$OSX |
31.23 |
-1.73 |
-5.25% |
-60.11% |
| Integrated Oil |
$XOI |
715.41 |
-39.53 |
-5.24% |
-43.69% |
| Semiconductor |
$SOX |
2,076.72 |
+26.96 |
+1.32% |
+12.28% |
| Networking |
$NWX |
549.95 |
+7.16 |
+1.32% |
-5.73% |
| Broker/Dealer |
$XBD |
270.80 |
-5.97 |
-2.16% |
-6.74% |
| Retail |
$RLX |
3,260.69 |
+57.44 |
+1.79% |
+33.13% |
| Gold & Silver |
$XAU |
136.55 |
-0.03 |
-0.02% |
+27.71% |
| Bank |
$BKX |
69.65 |
-2.48 |
-3.44% |
-38.56% |
| Biotech |
$BTK |
5,945.85 |
-8.38 |
-0.14% |
+17.33% |
|
|
|
 |
Impressive Rebound to Hit a New High
Kenneth J. Gruneisen - Passed the CAN SLIM® Master's Exam
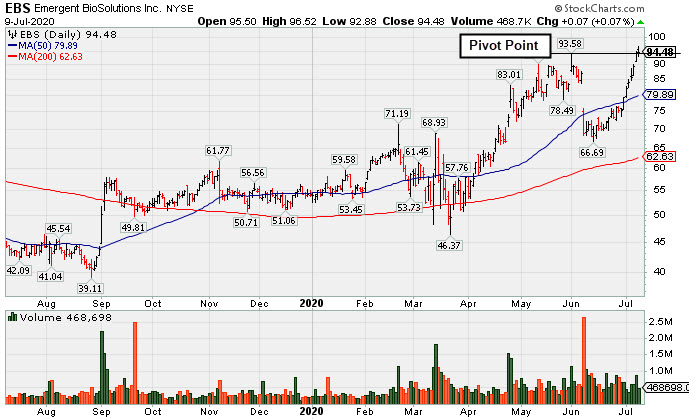
Emergent Biosolutions (EBS +$0.07 or +0.07% to $94.48) hit a new all-time high with today's 7th consecutive gain. Its color code was changed to yellow with a new pivot point cited based on its 6/01/20 high plus 10 cents. Recent gains above the 50-day moving average (DMA) line ($79.89) helped its outlook improve. No resistance remains due to overhead supply. Fundamentals remain strong.
EBS showed resilience since last shown in this FSU section on 6/16/20 with an annotated graph under the headline, "Still Below 50-Day Moving Average Following Damaging Gap Down". It currently has a 91 Earnings Per Share Rating, putting it in the top 10% of all publicly traded companies based on its earnings history. It reported Mar '20 earnings of 1 cent per share versus a 10 cents per share loss for the year ago period with +1% better sales revenues. Earnings rose +101% on +33% sales revenues for the Dec '19 quarter, and earnings rose +120% on +80% sales revenues in the Sep '19 quarter, very strong quarterly comparisons versus the year ago periods. Annual earnings history (A criteria) has been strong since a downturn in FY '16.
It has a small supply (S criteria) of only 45.1 million shares in the publicly traded float which can contribute to greater price volatility in the event of institutional buying or selling. The number of top-rated funds owning its shares rose from 453 in Sep '19 to 522 in Jun '20, and its current Up/Down Volume Ratio of 1.5 is an unbiased indication its shares have been under accumulation over the past 50 days. It has an A Timeliness rating and an A- Accumulation/Distribution rating. The company is in the Medical - Biomed/Biotech industry group which is a leading group currently ranked 14th out of the 197 industry groups (L criteria). |
|
|
Color Codes Explained :
Y - Better candidates highlighted by our
staff of experts.
G - Previously featured
in past reports as yellow but may no longer be buyable under the
guidelines.
***Last / Change / Volume data in this table is the closing quote data***
Symbol/Exchange
Company Name
Industry Group |
PRICE |
CHANGE
(%Change) |
Day High |
Volume
(% DAV)
(% 50 day avg vol) |
52 Wk Hi
% From Hi |
Featured
Date |
Price
Featured |
Pivot Featured |
|
Max Buy |
 FTNT
-
NASDAQ
FTNT
-
NASDAQ
Fortinet Inc
Computer Sftwr-Security
|
$149.60
|
+3.25
2.22% |
$151.95
|
2,693,551
158.17% of 50 DAV
50 DAV is 1,703,000
|
$149.69
-0.06%
|
6/22/2020
|
$142.68
|
PP = $149.79
|
|
MB = $157.28
|
 Most Recent Note - 7/9/2020 5:51:35 PM
Y - Hit a new high with today's solid gain backed by +55% above average volume however it finished the session just below the pivot point. Found prompt support at its 50 DMA line ($135) and above the prior low ($126.88 on 6/15/20) during the recent consolidation. Gains and a strong close above the pivot point backed by at least +40% above average volume are needed to clinch a convincing new (or add-on) technical buy signal. See the latest FSU analysis for more details and an annotated graph.
>>> FEATURED STOCK ARTICLE : Best Ever Close With Volume-Driven Gain Approaching Pivot Point - 7/8/2020 |
View all notes |
Set NEW NOTE alert |
Company Profile |
SEC
News |
Chart |
Request a new note
C
A
S
I |
EBS
-
NYSE
Emergent Biosolutions
DRUGS - Biotechnology
|
$94.48
|
+0.07
0.07% |
$96.52
|
468,699
72.78% of 50 DAV
50 DAV is 644,000
|
$94.96
-0.51%
|
7/7/2020
|
$89.47
|
PP = $93.68
|
|
MB = $98.36
|
Most Recent Note - 7/9/2020 7:16:05 PM
Y - Hit a new all-time high with today's 7th consecutive gain. Color code was changed to yellow with a new pivot point cited based on its 6/01/20 high plus 10 cents. Recent gains above the 50 DMA line helped its outlook improve. No resistance remains due to overhead supply. Fundamentals remain strong. See the latest FSU analysis for more details and a new annotated graph.
>>> FEATURED STOCK ARTICLE : Impressive Rebound to Hit a New High - 7/9/2020 |
View all notes |
Set NEW NOTE alert |
Company Profile |
SEC
News |
Chart |
Request a new note
C
A
S
I |
NBIX
-
NASDAQ
Neurocrine Biosciences
DRUGS - Biotechnology
|
$131.56
|
+1.45
1.11% |
$136.27
|
1,064,951
119.52% of 50 DAV
50 DAV is 891,000
|
$131.00
0.43%
|
5/19/2020
|
$123.71
|
PP = $119.75
|
|
MB = $125.74
|
Most Recent Note - 7/9/2020 12:55:05 PM
G - Backed off from earlier highs after hitting a new all-time high with today's 4th consecutive gain. Prior highs in the $119 area define important near-term support to watch along with its 50 DMA line ($118.52). Fundamentals remain strong.
>>> FEATURED STOCK ARTICLE : Pulled Back Below "Max Buy" Level With Loss on Average Volume - 6/30/2020 |
View all notes |
Set NEW NOTE alert |
Company Profile |
SEC
News |
Chart |
Request a new note
C
A
S
I |
BMRN
-
NASDAQ
Biomarin Pharmaceutical
DRUGS - Drug Manufacturers - Other
|
$126.81
|
-1.92
-1.49% |
$129.21
|
1,004,362
59.75% of 50 DAV
50 DAV is 1,681,000
|
$129.89
-2.37%
|
6/17/2020
|
$110.95
|
PP = $112.67
|
|
MB = $118.30
|
Most Recent Note - 7/7/2020 6:19:50 PM
G - Posted a 5th consecutive gain today for another new all-time high, getting very extended from any sound base. Stubbornly held its ground after a streak of gains for new highs marked by heavy volume. Reported strong results for the Mar '20 quarter and recent comparisons showed improved earnings increases. Annual earnings (A criteria) history has been strong. Prior high ($112.57) defines initial support to watch on pullbacks.
>>> FEATURED STOCK ARTICLE : Hit New 52-Week High But Closed Below Pivot After 3-Weeks Tight - 6/17/2020 |
View all notes |
Set NEW NOTE alert |
Company Profile |
SEC
News |
Chart |
Request a new note
C
A
S
I |
AMD
-
NASDAQ
Advanced Micro Devices
ELECTRONICS - Semiconductor - Broad Line
|
$57.26
|
+3.83
7.16% |
$57.58
|
87,025,296
155.92% of 50 DAV
50 DAV is 55,815,000
|
$59.27
-3.40%
|
6/9/2020
|
$55.41
|
PP = $56.98
|
|
MB = $59.83
|
Most Recent Note - 7/9/2020 5:46:18 PM
Y - Color code was changed to yellow while rebounding above its 50 DMA line ($53.50) with today's gain backed by +55% above average volume helping its outlook to improve. Previously met stubborn resistance in the $57-59 area. Subsequent gains above the pivot point backed by at least +40% above average volume may trigger a technical buy signal.
>>> FEATURED STOCK ARTICLE : Slump Below 50-Day Average Toward Prior Low Raises Concerns - 6/26/2020 |
View all notes |
Set NEW NOTE alert |
Company Profile |
SEC
News |
Chart |
Request a new note
C
A
S
I |
Symbol/Exchange
Company Name
Industry Group |
PRICE |
CHANGE
(%Change) |
Day High |
Volume
(% DAV)
(% 50 day avg vol) |
52 Wk Hi
% From Hi |
Featured
Date |
Price
Featured |
Pivot Featured |
|
Max Buy |
TREX
-
NYSE
Trex Company Inc
MATERIALS and CONSTRUCTION - General Building Materials
|
$129.28
|
+1.00
0.78% |
$135.32
|
2,179,517
205.03% of 50 DAV
50 DAV is 1,063,000
|
$132.84
-2.68%
|
6/26/2020
|
$109.05
|
PP = $132.94
|
|
MB = $139.59
|
Most Recent Note - 7/9/2020 7:19:47 PM
Y - Hit a new all-time high today and volume was +105% above average as it traded above the pivot point but stalled and ended in the lower half of its intra-day range. Subsequent volume-driven gains and a close above the pivot point may clinch a new (or add-on) technical buy signal. Important near-term support is at its 50 DMA line ($118.77). Fundamentals remain strong.
>>> FEATURED STOCK ARTICLE : Quietly Perched Near All-Time High After Forming a New Base - 7/6/2020 |
View all notes |
Set NEW NOTE alert |
Company Profile |
SEC
News |
Chart |
Request a new note
C
A
S
I |
NFLX
-
NASDAQ
Netflix Inc
SPECIALTY RETAIL - Music and Video Stores
|
$507.76
|
+4.98
0.99% |
$510.00
|
5,837,607
92.56% of 50 DAV
50 DAV is 6,307,000
|
$505.10
0.53%
|
5/14/2020
|
$441.95
|
PP = $449.62
|
|
MB = $472.10
|
Most Recent Note - 7/6/2020 5:53:16 PM
G - Hit another new all-time high with today's volume-driven gain, getting extended from any sound base. Found support near its 50 DMA line ($437) during recent consolidations.
>>> FEATURED STOCK ARTICLE : Powered to New High on Prior Session With Volume Driven Gain - 7/2/2020 |
View all notes |
Set NEW NOTE alert |
Company Profile |
SEC
News |
Chart |
Request a new note
C
A
S
I |
CHGG
-
NYSE
Chegg Inc
Consumer Svcs-Education
|
$72.81
|
+0.02
0.03% |
$74.00
|
2,076,338
44.27% of 50 DAV
50 DAV is 4,690,000
|
$73.78
-1.31%
|
6/17/2020
|
$63.71
|
PP = $68.08
|
|
MB = $71.48
|
Most Recent Note - 7/6/2020 5:57:39 PM
Y - Hit a new all-time high as it posted a 7th consecutive gain today with near average volume. Disciplined investors may note that the recent gains above the pivot point were not backed by the at least +40% above average volume necessary to trigger a convincing technical buy signal. Confirming gains above the pivot point backed by volume would be a reassuring sign of fresh institutional buying demand.
>>> FEATURED STOCK ARTICLE : Formed a Flat Base Perched Within Striking Distance of 52-Week High - 6/18/2020 |
View all notes |
Set NEW NOTE alert |
Company Profile |
SEC
News |
Chart |
Request a new note
C
A
S
I |
LGIH
-
NASDAQ
L G I Homes Inc
Bldg-Resident/Comml
|
$98.48
|
-4.25
-4.14% |
$103.72
|
408,360
99.12% of 50 DAV
50 DAV is 412,000
|
$103.21
-4.58%
|
7/7/2020
|
$99.19
|
PP = $95.82
|
|
MB = $100.61
|
Most Recent Note - 7/9/2020 5:44:50 PM
Y - Reversed into the red after hitting another new 52-week high today following 4 consecutive gains marked by ever increasing volume. Finished strong after highlighted in yellow in the 7/07/20 mid-day report with a pivot point cited based on its 2/21/20 high plus 10 cents. Its gain and strong close above the pivot point was backed by +53% above average volume triggering a convincing technical buy signal. Went through a deep consolidation below its 200 DMA line and rebounded impressively in recent months. Reported earnings +129% on +58% sales revenues for the Mar '20 quarter versus the year ago period, its 3rd consecutive quarterly comparison above the +25% minimum earnings guideline (C criteria). Annual earnings history has been strong. See the latest FSU analysis for more details and an annotated graph.
>>> FEATURED STOCK ARTICLE : Breakout to New High Backed by 53% Above Average Volume - 7/7/2020 |
View all notes |
Set NEW NOTE alert |
Company Profile |
SEC
News |
Chart |
Request a new note
C
A
S
I |
NOW
-
NYSE
Servicenow Inc
Computer Sftwr-Enterprse
|
$426.37
|
+1.17
0.28% |
$430.83
|
1,406,610
69.46% of 50 DAV
50 DAV is 2,025,000
|
$426.78
-0.10%
|
4/30/2020
|
$343.05
|
PP = $363.05
|
|
MB = $381.20
|
Most Recent Note - 7/8/2020 6:10:36 PM
G - Posted a quiet gain today for another new all-time high. It has not formed a sound base. Its 50 DMA line ($384) defines important near-term support to watch on pullbacks.
>>> FEATURED STOCK ARTICLE : Hovering Near All-Time High With Volume Totals Cooling - 6/25/2020 |
View all notes |
Set NEW NOTE alert |
Company Profile |
SEC
News |
Chart |
Request a new note
C
A
S
I |
Symbol/Exchange
Company Name
Industry Group |
PRICE |
CHANGE
(%Change) |
Day High |
Volume
(% DAV)
(% 50 day avg vol) |
52 Wk Hi
% From Hi |
Featured
Date |
Price
Featured |
Pivot Featured |
|
Max Buy |
TEAM
-
NASDAQ
Atlassian Corp Plc Cl A
Comp Sftwr-Spec Enterprs
|
$195.63
|
-0.25
-0.13% |
$198.41
|
1,970,816
102.65% of 50 DAV
50 DAV is 1,920,000
|
$197.06
-0.73%
|
7/7/2020
|
$190.44
|
PP = $191.82
|
|
MB = $201.41
|
Most Recent Note - 7/7/2020 6:25:25 PM
Y - Stalled after quietly touching a new all-time high on the prior session. Color code is changed to yellow with new pivot point cited based on its 6/01/20 high plus 10 cents after an orderly consolidation above its 50 DMA line ($176). Subsequent gains above the pivot point backed by at least +40% above average volume may trigger a new (or add-on) technical buy signal.
>>> FEATURED STOCK ARTICLE : 50-Day Moving Average Defines Important Near-Term Support - 6/29/2020 |
View all notes |
Set NEW NOTE alert |
Company Profile |
SEC
News |
Chart |
Request a new note
C
A
S
I |
TTD
-
NASDAQ
The Trade Desk Inc Cl A
Comml Svcs-Advertising
|
$463.00
|
+0.51
0.11% |
$471.12
|
1,822,609
86.01% of 50 DAV
50 DAV is 2,119,000
|
$466.00
-0.64%
|
6/3/2020
|
$340.61
|
PP = $327.35
|
|
MB = $343.72
|
Most Recent Note - 7/8/2020 6:08:29 PM
G - Hit yet another new 52-week high with today's 6th consecutive gain, getting very extended from any sound base. Its 50 DMA line ($346.58) defines near-term support above prior highs in the $327 area.
>>> FEATURED STOCK ARTICLE : Pullback Breaks Streak of 8 Straight Gains Into New High Ground - 6/24/2020 |
View all notes |
Set NEW NOTE alert |
Company Profile |
SEC
News |
Chart |
Request a new note
C
A
S
I |
DOCU
-
NASDAQ
Docusign Inc
Computer Sftwr-Enterprse
|
$212.42
|
+6.07
2.94% |
$217.00
|
10,231,975
201.54% of 50 DAV
50 DAV is 5,077,000
|
$206.55
2.84%
|
6/10/2020
|
$149.73
|
PP = $152.10
|
|
MB = $159.71
|
Most Recent Note - 7/9/2020 12:25:13 PM
G - Hitting yet another new all-time high today, getting very extended from any sound base. Its 50 DMA line ($145) defines near-term support to watch on pullbacks. DOCU is now priced +127% above its 200 DMA price, and it is taught in the Certification that a stock trading +70-100% or more above the 200 DMA is to be recognized as a "sell signal".
>>> FEATURED STOCK ARTICLE : Rally From Ascending Base Leaves Stock Very Extended - 7/1/2020 |
View all notes |
Set NEW NOTE alert |
Company Profile |
SEC
News |
Chart |
Request a new note
C
A
S
I |
PING
-
NYSE
Ping Identity Hldg Corp
Computer Sftwr-Security
|
$33.36
|
+0.48
1.46% |
$34.41
|
7,044,288
524.13% of 50 DAV
50 DAV is 1,344,000
|
$35.36
-5.66%
|
6/1/2020
|
$29.24
|
PP = $29.90
|
|
MB = $31.40
|
Most Recent Note - 7/9/2020 1:00:06 PM
G - Posting a gain today after pricing a follow-on Offering of shares. It has not formed a sound base of sufficient length. Prior highs in the $29 area define initial support to watch.
>>> FEATURED STOCK ARTICLE : Gain for Recent New High Backed by +71% Above Average Volume - 6/22/2020 |
View all notes |
Set NEW NOTE alert |
Company Profile |
SEC
News |
Chart |
Request a new note
C
A
S
I |
AAXN
-
NASDAQ
Axon Enterprise Inc
Security/Sfty
|
$96.42
|
-0.51
-0.53% |
$98.04
|
481,589
35.33% of 50 DAV
50 DAV is 1,363,000
|
$104.90
-8.08%
|
5/8/2020
|
$84.86
|
PP = $90.20
|
|
MB = $94.71
|
Most Recent Note - 7/7/2020 6:26:44 PM
G - Pulled back today with below average volume, yet it remains above its "max buy" level. Completed a new Public Offering on 6/17/20. Prior highs in the $90-91 area have acted as support following a powerful breakout. More damaging losses would raise concerns and trigger a technical sell signal.
>>> FEATURED STOCK ARTICLE : Completed New Pubic Offering and Found Support Near Prior High - 6/19/2020 |
View all notes |
Set NEW NOTE alert |
Company Profile |
SEC
News |
Chart |
Request a new note
C
A
S
I |
Symbol/Exchange
Company Name
Industry Group |
PRICE |
CHANGE
(%Change) |
Day High |
Volume
(% DAV)
(% 50 day avg vol) |
52 Wk Hi
% From Hi |
Featured
Date |
Price
Featured |
Pivot Featured |
|
Max Buy |
|
|
|
THESE ARE NOT BUY RECOMMENDATIONS!
Comments contained in the body of this report are technical
opinions only. The material herein has been obtained
from sources believed to be reliable and accurate, however,
its accuracy and completeness cannot be guaranteed.
This site is not an investment advisor, hence it does
not endorse or recommend any securities or other investments.
Any recommendation contained in this report may not
be suitable for all investors and it is not to be deemed
an offer or solicitation on our part with respect to
the purchase or sale of any securities. All trademarks,
service marks and trade names appearing in this report
are the property of their respective owners, and are
likewise used for identification purposes only.
This report is a service available
only to active Paid Premium Members.
You may opt-out of receiving report notifications
at any time. Questions or comments may be submitted
by writing to Premium Membership Services 665 S.E. 10 Street, Suite 201 Deerfield Beach, FL 33441-5634 or by calling 1-800-965-8307
or 954-785-1121.
|
|
|