You are not logged in.
This means you
CAN ONLY VIEW reports that were published prior to Sunday, February 25, 2024.
You
MUST UPGRADE YOUR MEMBERSHIP if you want to see any current reports.
AFTER MARKET UPDATE - FRIDAY, JULY 8TH, 2022
Previous After Market Report Next After Market Report >>>
|
|
|
|
DOW |
-46.40 |
31,338.15 |
-0.15% |
|
Volume |
783,337,836 |
-13% |
|
Volume |
4,488,317,200 |
-3% |
|
NASDAQ |
+13.96 |
11,635.31 |
+0.12% |
|
Advancers |
1,450 |
47% |
|
Advancers |
2,392 |
55% |
|
S&P 500 |
-3.24 |
3,899.38 |
-0.08% |
|
Decliners |
1,631 |
53% |
|
Decliners |
1,959 |
45% |
|
Russell 2000 |
-0.24 |
1,769.36 |
-0.01% |
|
52 Wk Highs |
7 |
|
|
52 Wk Highs |
27 |
|
|
S&P 600 |
-2.72 |
1,143.84 |
-0.24% |
|
52 Wk Lows |
56 |
|
|
52 Wk Lows |
83 |
|
|
 |
Major Indices Were Mixed With Leadership Still Thin
Kenneth J. Gruneisen - Passed the CAN SLIM® Master's Exam
The S&P 500 dipped 0.1%, to end its longest stretch of daily gains since March (four). The broad benchmark climbed 1.9% during the holiday-shortened week in only its third weekly advance in the past 14. The tech-heavy Nasdaq Composite rose 0.1%, capping a 4.6% weekly rally and five-day winning streak that marked its best run since November 2021. The Dow lost 46 points but ended the week 0.8% higher. Volume totals reported were lighter than the prior session on the NYSE and on the Nasdaq exchange. Breadth was mixed decliners led advancers by an 8-7 margin on the NYSE while advancers led decliners by a 6-5 margin on the Nasdaq exchange. There were 7 high-ranked companies from the Leaders List that hit new 52-week highs and were listed on the BreakOuts Page, versus the total of 7 on the prior session. New 52-week lows totals contracted yet still outnumbered new 52-week highs on the NYSE and on the Nasdaq exchange. The brief new market uptrend is already under pressure (M criteria). Any sustainable rally requires a healthy crop of leading stocks hitting new highs, but leadership has been very thin.
Chart courtesy of www.stockcharts.com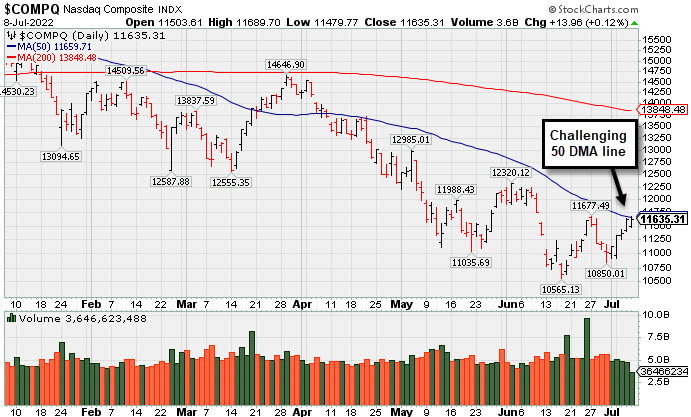 PICTURED: The Nasdaq Composite Index posted a 5th consecutive gain backed by lighter volume. It is challenging its 50-day and still well below its 200-day moving average (DMA) line.
U.S. stocks finished little changed on Friday as Wall Street mulled the macroeconomic implications of a stronger-than-expected monthly jobs report. On the data front, the Labor Department revealed non-farm payrolls increased by a better-than-anticipated 372,000 in June, well above estimates of a 268,000 addition. The unemployment rate held steady at 3.6% for a fourth consecutive month, while wage inflation modestly decelerated. Average hourly earnings climbed at a still-elevated 5.1% year-over-year pace, easing slightly from May’s 5.3% annual increase. While the headline number signaled underlying economic strength, helping alleviate worries about an impending recession, the update also bolstered expectations for further monetary policy tightening by the Federal Reserve (Fed).
Treasuries retreated, as the solid jobs number was perceived as paving the way for another aggressive 0.75% rate hike at this month’s July 26-27 central bank policy meeting. Recent Fedspeak also reiterated the Fed’s hawkish stance and commitment to combating inflation. An inversion between the 10- and two-year note yields persisted for a fourth day, with the yield on the shorter-dated two-year note spiking seven basis points (0.07%) to 3.10%, still above the 10-year note yield, which jumped by the same amount to 3.08%.
|
 Kenneth J. Gruneisen started out as a licensed stockbroker in August 1987, a couple of months prior to the historic stock market crash that took the Dow Jones Industrial Average down -22.6% in a single day. He has published daily fact-based fundamental and technical analysis on high-ranked stocks online for two decades. Through FACTBASEDINVESTING.COM, Kenneth provides educational articles, news, market commentary, and other information regarding proven investment systems that work in good times and bad.
Comments contained in the body of this report are technical opinions only and are not necessarily those of Gruneisen Growth Corp. The material herein has been obtained from sources believed to be reliable and accurate, however, its accuracy and completeness cannot be guaranteed. Our firm, employees, and customers may effect transactions, including transactions contrary to any recommendation herein, or have positions in the securities mentioned herein or options with respect thereto. Any recommendation contained in this report may not be suitable for all investors and it is not to be deemed an offer or solicitation on our part with respect to the purchase or sale of any securities. |
|
 |
Tech, Broker/Dealer, and Oil Services Indexes Rose
Kenneth J. Gruneisen - Passed the CAN SLIM® Master's Exam
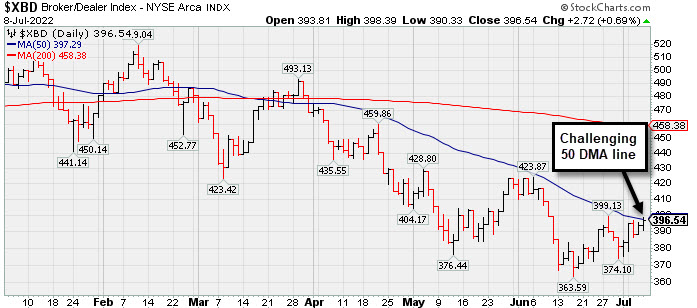
The tech sector had a positive bias as the Semiconductor Index ($SOX +0.47%), Biotech Index ($BTK +0.39%), and Networking Index ($NWX +0.16%) each edged higher. The Broker/Dealer Index ($XBD +0.69%) rose while the Bank Index ($BKX -0.42%) and Retail Index ($RLX -0.58%) both edged lower. Commodity-linked groups were mixed as the Oil Services Index ($OSX +0.57%) edged higher and the Integrated Oil Index ($XOI -0.18%) ended slightly lower while the Gold & Silver Index ($XAU -0.70%) slumped.
PICTURED: The Broker/Dealer Index ($XBD +0.69%) is challenging its 50-day moving average (DMA) line and still sputtering near its 2022 low.
| Oil Services |
$OSX |
64.15 |
+0.36 |
+0.57% |
+21.68% |
| Integrated Oil |
$XOI |
1,455.69 |
-2.57 |
-0.18% |
+23.55% |
| Semiconductor |
$SOX |
2,618.02 |
+12.13 |
+0.47% |
-33.66% |
| Networking |
$NWX |
701.73 |
+1.11 |
+0.16% |
-27.74% |
| Broker/Dealer |
$XBD |
396.54 |
+2.72 |
+0.69% |
-18.55% |
| Retail |
$RLX |
3,033.28 |
-17.67 |
-0.58% |
-28.23% |
| Gold & Silver |
$XAU |
108.97 |
-0.77 |
-0.70% |
-17.73% |
| Bank |
$BKX |
103.00 |
-0.43 |
-0.42% |
-22.10% |
| Biotech |
$BTK |
4,906.18 |
+19.28 |
+0.39% |
-11.09% |
|
|
|
 |
Lilly Quietly Wedged to a New All-Time High This Week
Kenneth J. Gruneisen - Passed the CAN SLIM® Master's Exam
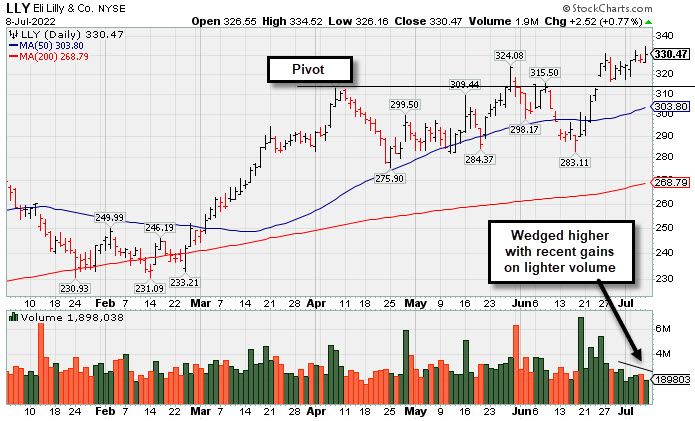
Eli Lilly & Co (LLY +$2.52 or +0.77% to $330.47) posted a gain with light volume and its color code was changed to green after closing above its "max buy" level. On pullbacks, its 50-day moving average (DMA) line ($303) defines near-term support above prior lows.
LLY was highlighted in yellow with pivot point cited based on its 4/07/22 high plus 10 cents in the 5/16/22 mid-day report (read here). This giant Medical - Diversified firm showed impressive resilience and strength after slumping below its 50 DMA line since last covered in greater detail on 6/06/22 with an annotated graph under the headline, "Encountering Distributional Pressure After Reaching New Highs".
Fundamentals remain strong. LLY has a 93 Earnings Per Share Rating, well above the 80+ minimum for buy candidates. It reported Mar '22 quarterly earnings +63% on +15% sales revenues versus the year ago period. Three of the past 4 quarterly comparisons were above the +25% minimum earnings guideline (C criteria). Annual earnings (A criteria) improved steadily since a downturn in FY '14.
The number of top-rated funds owning its shares rose from 3,055 in Dec '20 to 3,695 in Jun '22, a reassuring sign concerning the I criteria. Its current Up/Down Volume Ratio of 1.6 is an unbiased indication its shares have been under accumulation over the past 50 days. It has a Timeliness Rating of A and a Sponsorship Rating of B. There are 950.2 million shares outstanding, making it an unlikely sprinter, while it is also well-recognized already by the institutional crowd. |
|
|
Color Codes Explained :
Y - Better candidates highlighted by our
staff of experts.
G - Previously featured
in past reports as yellow but may no longer be buyable under the
guidelines.
***Last / Change / Volume data in this table is the closing quote data***
Symbol/Exchange
Company Name
Industry Group |
PRICE |
CHANGE
(%Change) |
Day High |
Volume
(% DAV)
(% 50 day avg vol) |
52 Wk Hi
% From Hi |
Featured
Date |
Price
Featured |
Pivot Featured |
|
Max Buy |
 LLY
-
NYSE
LLY
-
NYSE
Eli Lilly & Co
Medical-Diversified
|
$330.47
|
+2.52
0.77% |
$334.52
|
1,881,625
60.02% of 50 DAV
50 DAV is 3,135,000
|
$332.74
-0.68%
|
5/16/2022
|
$302.46
|
PP = $314.10
|
|
MB = $329.81
|
 Most Recent Note - 7/8/2022 5:30:57 PM
G - Color code is changed to green after quietly wedging up above its "max buy" level with light volume totals behind recent gains. Its 50 DMA line ($304) defines near-term support above prior lows. See the latest FSU analysis for more detailed analysis and a new annotated graph.
>>> FEATURED STOCK ARTICLE : Lilly Quietly Wedged to a New All-Time High This Week - 7/8/2022 |
View all notes |
Set NEW NOTE alert |
Company Profile |
SEC
News |
Chart |
Request a new note
C
A
S
I |
IMXI
-
NASDAQ
International Money Exp
Financial Svcs-Specialty
|
$22.48
|
-0.02
-0.09% |
$22.72
|
353,447
92.04% of 50 DAV
50 DAV is 384,000
|
$22.86
-1.66%
|
7/1/2022
|
$21.27
|
PP = $21.38
|
|
MB = $22.45
|
Most Recent Note - 7/8/2022 5:15:52 PM
G - Finished flat for a 2nd day with lighter volume, perched at its 52-week high after rising above its "max buy" level with volume-driven gains. No resistance remains due to overhead supply. Rebound above the 50 DMA line ($20.13) helped its outlook improve. Fundamentals through the Mar '22 quarter have been strong.
>>> FEATURED STOCK ARTICLE : Volume Heavy While Rallying from Double Bottom Base - 7/1/2022 |
View all notes |
Set NEW NOTE alert |
Company Profile |
SEC
News |
Chart |
Request a new note
C
A
S
I |
HRMY
-
NASDAQ
Harmony Biosciences Hldg
Medical-Biomed/Biotech
|
$54.75
|
-0.70
-1.26% |
$55.20
|
592,839
113.35% of 50 DAV
50 DAV is 523,000
|
$55.60
-1.53%
|
7/6/2022
|
$54.12
|
PP = $52.85
|
|
MB = $55.49
|
Most Recent Note - 7/8/2022 5:14:14 PM
Y - Pulled back today yet finished near the session high with a small loss following 4 consecutive gains marked by above average volume as it rallied to new highs and triggered a technical buy signal. Prior highs in the $52-54 area define initial support to watch on pullbacks. Reported strong sales revenues and earnings increases in quarterly comparisons through Mar '22 versus the year ago periods. Annual earnings history is limited. Completed its $24 IPO on 8/19/20.
>>> FEATURED STOCK ARTICLE : Volume-Driven Breakout For Biotech Firm - 7/6/2022 |
View all notes |
Set NEW NOTE alert |
Company Profile |
SEC
News |
Chart |
Request a new note
C
A
S
I |
CI
-
NYSE
Cigna Corp
Medical-Managed Care
|
$279.19
|
+3.41
1.24% |
$281.49
|
2,325,054
131.21% of 50 DAV
50 DAV is 1,772,000
|
$273.58
2.05%
|
7/7/2022
|
$276.55
|
PP = $273.68
|
|
MB = $287.36
|
Most Recent Note - 7/8/2022 5:13:21 PM
Y - Hit another new all-time high with today's 3rd consecutive volume-driven gain. Finished strong after highlighted in yellow in the prior mid-day report with new pivot point based on its 5/31/22 high plus 10 cents. The volume-driven gain triggered a technical buy signal. Rebound above its 50 DMA line ($260) helped its outlook to improve since dropped from the Featured Stocks list on 6/13/22.
>>> FEATURED STOCK ARTICLE : Volume-Driven Breakout for Cigna Corp - 7/7/2022 |
View all notes |
Set NEW NOTE alert |
Company Profile |
SEC
News |
Chart |
Request a new note
C
A
S
I |
|
|
|
THESE ARE NOT BUY RECOMMENDATIONS!
Comments contained in the body of this report are technical
opinions only. The material herein has been obtained
from sources believed to be reliable and accurate, however,
its accuracy and completeness cannot be guaranteed.
This site is not an investment advisor, hence it does
not endorse or recommend any securities or other investments.
Any recommendation contained in this report may not
be suitable for all investors and it is not to be deemed
an offer or solicitation on our part with respect to
the purchase or sale of any securities. All trademarks,
service marks and trade names appearing in this report
are the property of their respective owners, and are
likewise used for identification purposes only.
This report is a service available
only to active Paid Premium Members.
You may opt-out of receiving report notifications
at any time. Questions or comments may be submitted
by writing to Premium Membership Services 665 S.E. 10 Street, Suite 201 Deerfield Beach, FL 33441-5634 or by calling 1-800-965-8307
or 954-785-1121.
|
|
|